Zip Codes with the Highest Percentage of Population with a Degree in Liberal Arts and History in Flint, MI
RELATED REPORTS & OPTIONS
Liberal Arts and History
Flint
Compare Zip Codes
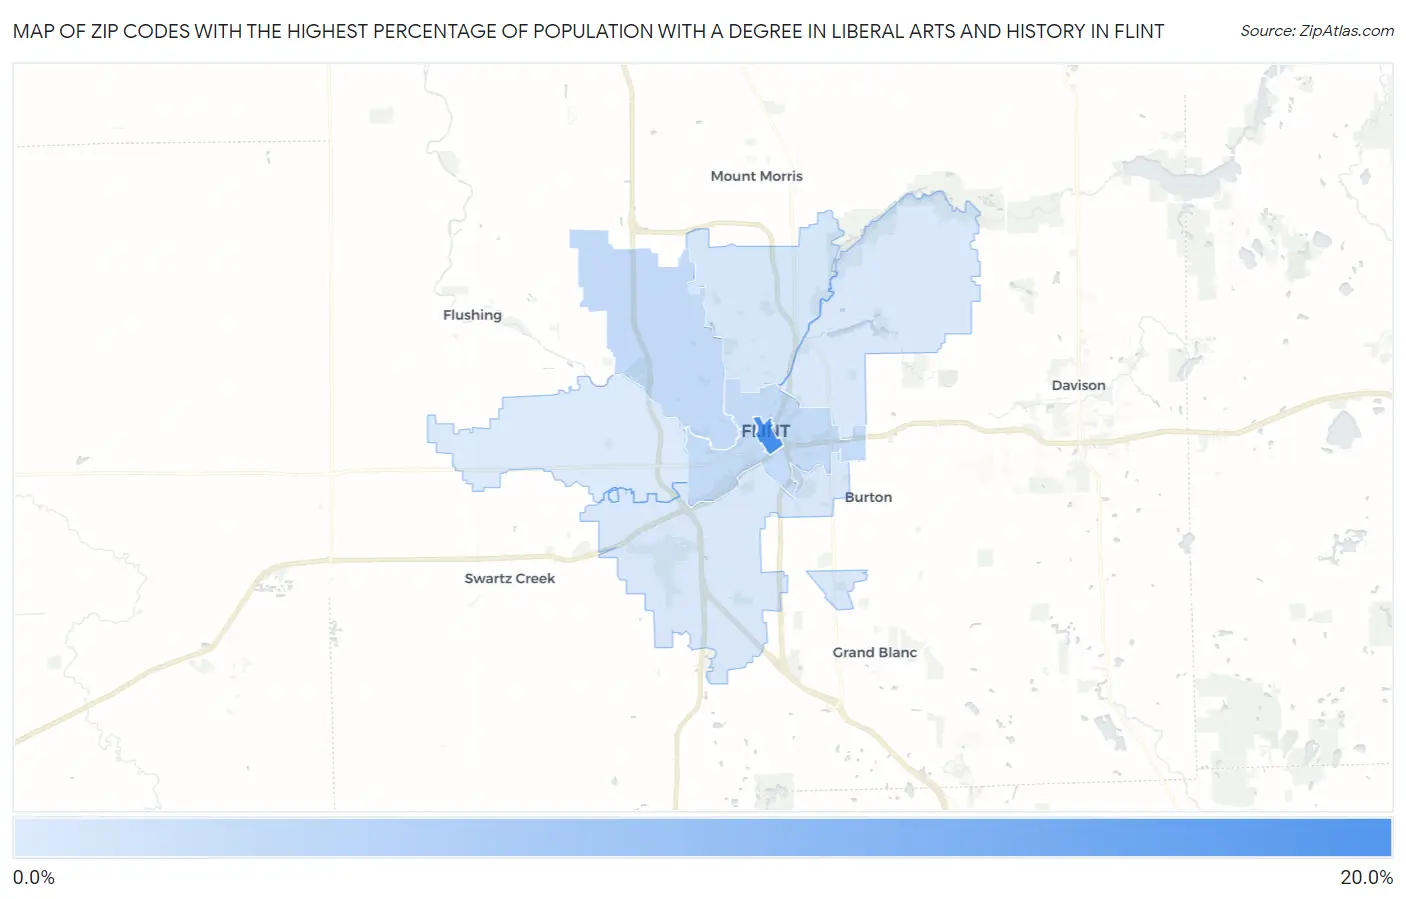
Map of Zip Codes with the Highest Percentage of Population with a Degree in Liberal Arts and History in Flint
3.0%
19.2%
Zip Codes with the Highest Percentage of Population with a Degree in Liberal Arts and History in Flint, MI
| Zip Code | % Graduates | vs State | vs National | |
| 1. | 48502 | 19.2% | 4.0%(+15.2)#13 | 4.9%(+14.3)#921 |
| 2. | 48504 | 5.9% | 4.0%(+1.92)#203 | 4.9%(+1.03)#8,771 |
| 3. | 48503 | 5.5% | 4.0%(+1.53)#233 | 4.9%(+0.636)#9,849 |
| 4. | 48505 | 3.8% | 4.0%(-0.227)#445 | 4.9%(-1.12)#15,686 |
| 5. | 48507 | 3.4% | 4.0%(-0.549)#516 | 4.9%(-1.44)#16,867 |
| 6. | 48506 | 3.2% | 4.0%(-0.760)#546 | 4.9%(-1.65)#17,578 |
| 7. | 48532 | 3.0% | 4.0%(-0.937)#579 | 4.9%(-1.83)#18,174 |
1
Common Questions
What are the Top 5 Zip Codes with the Highest Percentage of Population with a Degree in Liberal Arts and History in Flint, MI?
Top 5 Zip Codes with the Highest Percentage of Population with a Degree in Liberal Arts and History in Flint, MI are:
What zip code has the Highest Percentage of Population with a Degree in Liberal Arts and History in Flint, MI?
48502 has the Highest Percentage of Population with a Degree in Liberal Arts and History in Flint, MI with 19.2%.
What is the Percentage of Population with a Degree in Liberal Arts and History in Flint, MI?
Percentage of Population with a Degree in Liberal Arts and History in Flint is 4.9%.
What is the Percentage of Population with a Degree in Liberal Arts and History in Michigan?
Percentage of Population with a Degree in Liberal Arts and History in Michigan is 4.0%.
What is the Percentage of Population with a Degree in Liberal Arts and History in the United States?
Percentage of Population with a Degree in Liberal Arts and History in the United States is 4.9%.