Zip Codes with the Highest Percentage of Population with a Degree in Liberal Arts and History in Washington, MI
RELATED REPORTS & OPTIONS
Liberal Arts and History
Washington
Compare Zip Codes
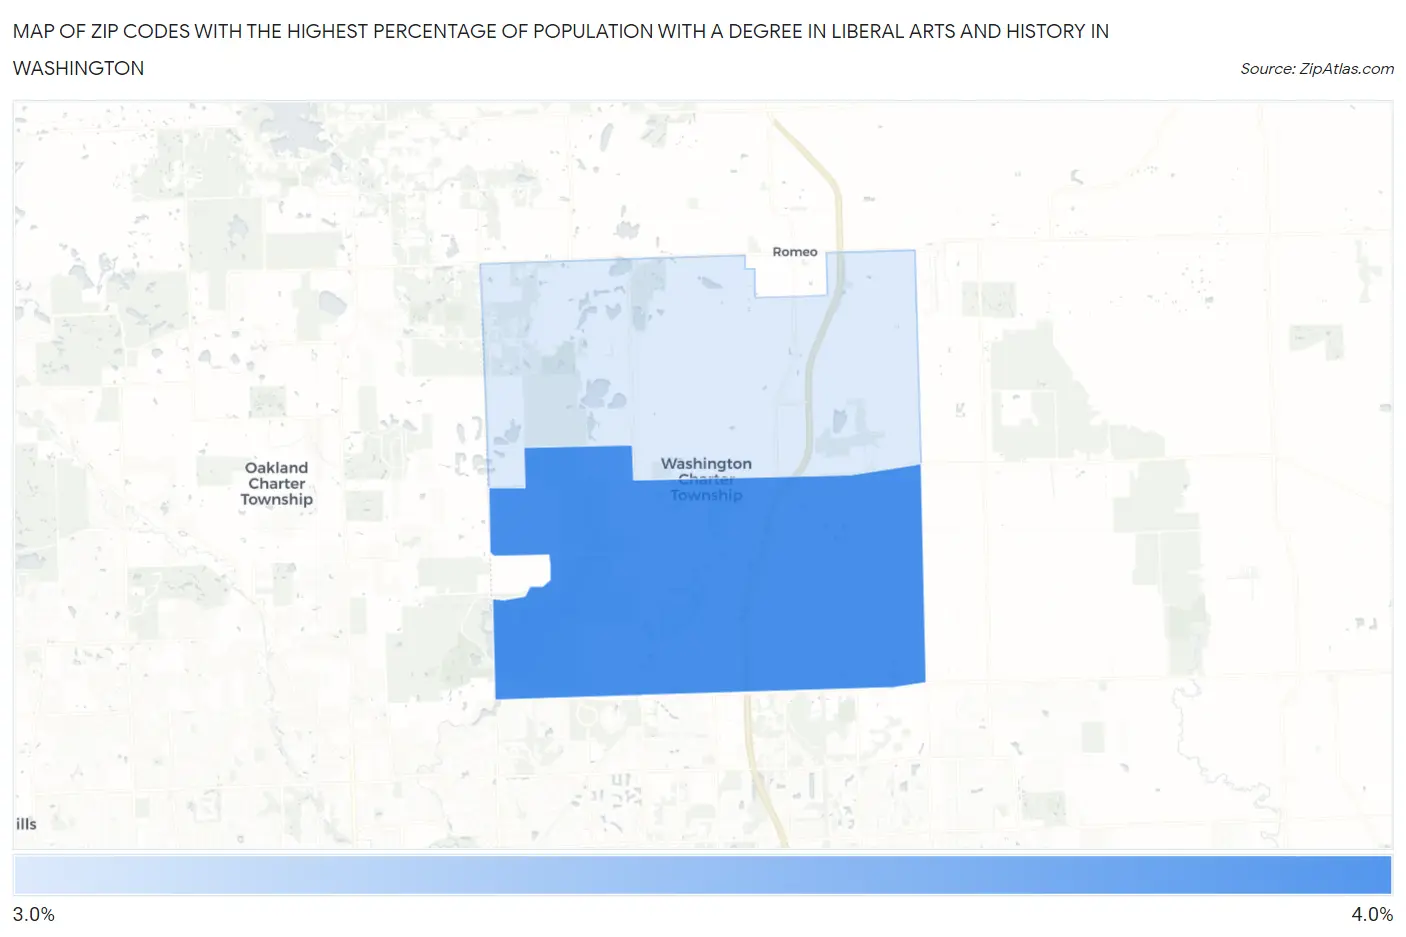
Map of Zip Codes with the Highest Percentage of Population with a Degree in Liberal Arts and History in Washington
3.1%
3.6%
Zip Codes with the Highest Percentage of Population with a Degree in Liberal Arts and History in Washington, MI
| Zip Code | % Graduates | vs State | vs National | |
| 1. | 48094 | 3.6% | 4.0%(-0.405)#481 | 4.9%(-1.29)#16,312 |
| 2. | 48095 | 3.1% | 4.0%(-0.931)#577 | 4.9%(-1.82)#18,153 |
1
Common Questions
What are the Top Zip Codes with the Highest Percentage of Population with a Degree in Liberal Arts and History in Washington, MI?
Top Zip Codes with the Highest Percentage of Population with a Degree in Liberal Arts and History in Washington, MI are:
What zip code has the Highest Percentage of Population with a Degree in Liberal Arts and History in Washington, MI?
48094 has the Highest Percentage of Population with a Degree in Liberal Arts and History in Washington, MI with 3.6%.
What is the Percentage of Population with a Degree in Liberal Arts and History in Michigan?
Percentage of Population with a Degree in Liberal Arts and History in Michigan is 4.0%.
What is the Percentage of Population with a Degree in Liberal Arts and History in the United States?
Percentage of Population with a Degree in Liberal Arts and History in the United States is 4.9%.