Zip Codes with the Highest Percentage of Population with a Degree in Liberal Arts and History in Clinton Township, MI
RELATED REPORTS & OPTIONS
Liberal Arts and History
Clinton Township
Compare Zip Codes
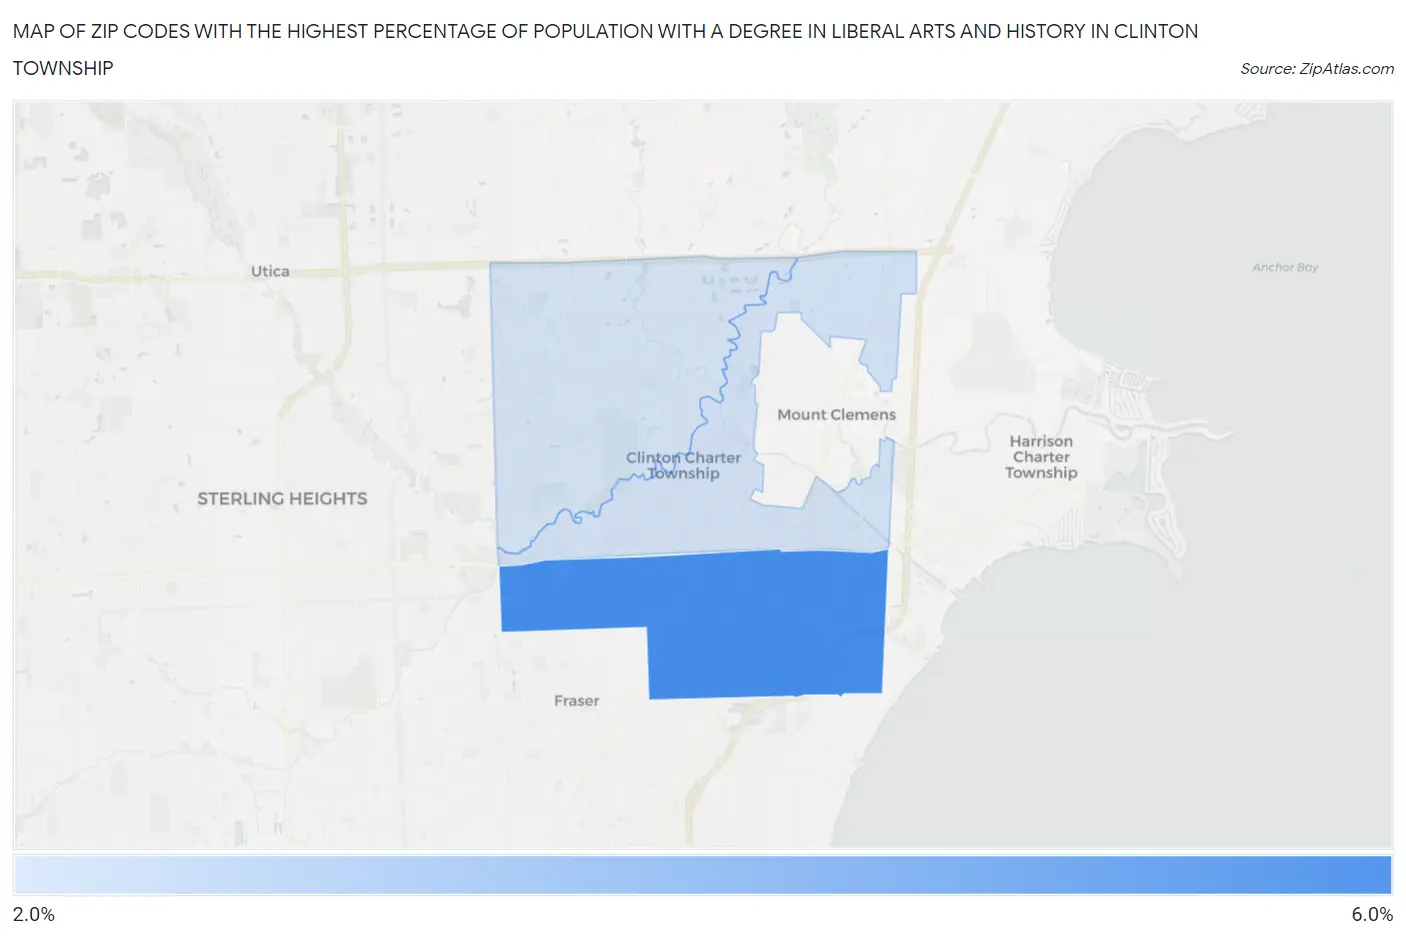
Map of Zip Codes with the Highest Percentage of Population with a Degree in Liberal Arts and History in Clinton Township
2.6%
5.0%
Zip Codes with the Highest Percentage of Population with a Degree in Liberal Arts and History in Clinton Township, MI
| Zip Code | % Graduates | vs State | vs National | |
| 1. | 48035 | 5.0% | 4.0%(+1.03)#284 | 4.9%(+0.136)#11,309 |
| 2. | 48036 | 2.6% | 4.0%(-1.38)#640 | 4.9%(-2.27)#19,644 |
| 3. | 48038 | 2.6% | 4.0%(-1.43)#647 | 4.9%(-2.32)#19,804 |
1
Common Questions
What are the Top Zip Codes with the Highest Percentage of Population with a Degree in Liberal Arts and History in Clinton Township, MI?
Top Zip Codes with the Highest Percentage of Population with a Degree in Liberal Arts and History in Clinton Township, MI are:
What zip code has the Highest Percentage of Population with a Degree in Liberal Arts and History in Clinton Township, MI?
48035 has the Highest Percentage of Population with a Degree in Liberal Arts and History in Clinton Township, MI with 5.0%.
What is the Percentage of Population with a Degree in Liberal Arts and History in Michigan?
Percentage of Population with a Degree in Liberal Arts and History in Michigan is 4.0%.
What is the Percentage of Population with a Degree in Liberal Arts and History in the United States?
Percentage of Population with a Degree in Liberal Arts and History in the United States is 4.9%.