Zip Codes with the Highest Percentage of Population with a Degree in Liberal Arts and History in Westland, MI
RELATED REPORTS & OPTIONS
Liberal Arts and History
Westland
Compare Zip Codes
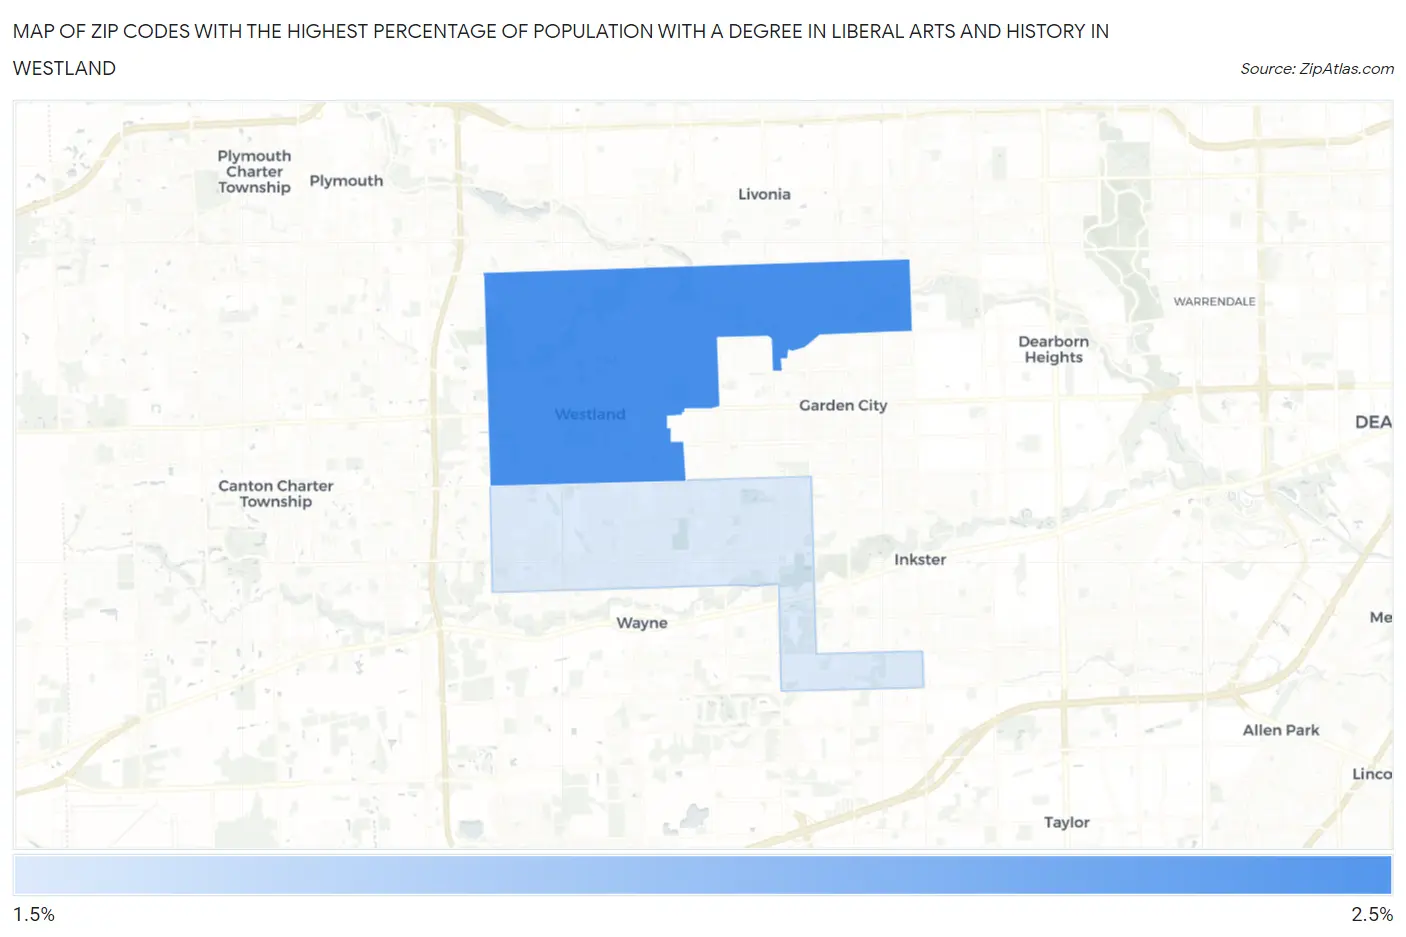
Map of Zip Codes with the Highest Percentage of Population with a Degree in Liberal Arts and History in Westland
2.1%
2.3%
Zip Codes with the Highest Percentage of Population with a Degree in Liberal Arts and History in Westland, MI
| Zip Code | % Graduates | vs State | vs National | |
| 1. | 48185 | 2.3% | 4.0%(-1.73)#700 | 4.9%(-2.62)#20,686 |
| 2. | 48186 | 2.1% | 4.0%(-1.88)#717 | 4.9%(-2.77)#21,089 |
1
Common Questions
What are the Top Zip Codes with the Highest Percentage of Population with a Degree in Liberal Arts and History in Westland, MI?
Top Zip Codes with the Highest Percentage of Population with a Degree in Liberal Arts and History in Westland, MI are:
What zip code has the Highest Percentage of Population with a Degree in Liberal Arts and History in Westland, MI?
48185 has the Highest Percentage of Population with a Degree in Liberal Arts and History in Westland, MI with 2.3%.
What is the Percentage of Population with a Degree in Liberal Arts and History in Westland, MI?
Percentage of Population with a Degree in Liberal Arts and History in Westland is 2.2%.
What is the Percentage of Population with a Degree in Liberal Arts and History in Michigan?
Percentage of Population with a Degree in Liberal Arts and History in Michigan is 4.0%.
What is the Percentage of Population with a Degree in Liberal Arts and History in the United States?
Percentage of Population with a Degree in Liberal Arts and History in the United States is 4.9%.