Zip Codes with the Highest Percentage of Population Employed in Security & Protection in Saint Clair Shores, MI
RELATED REPORTS & OPTIONS
Security & Protection
Saint Clair Shores
Compare Zip Codes
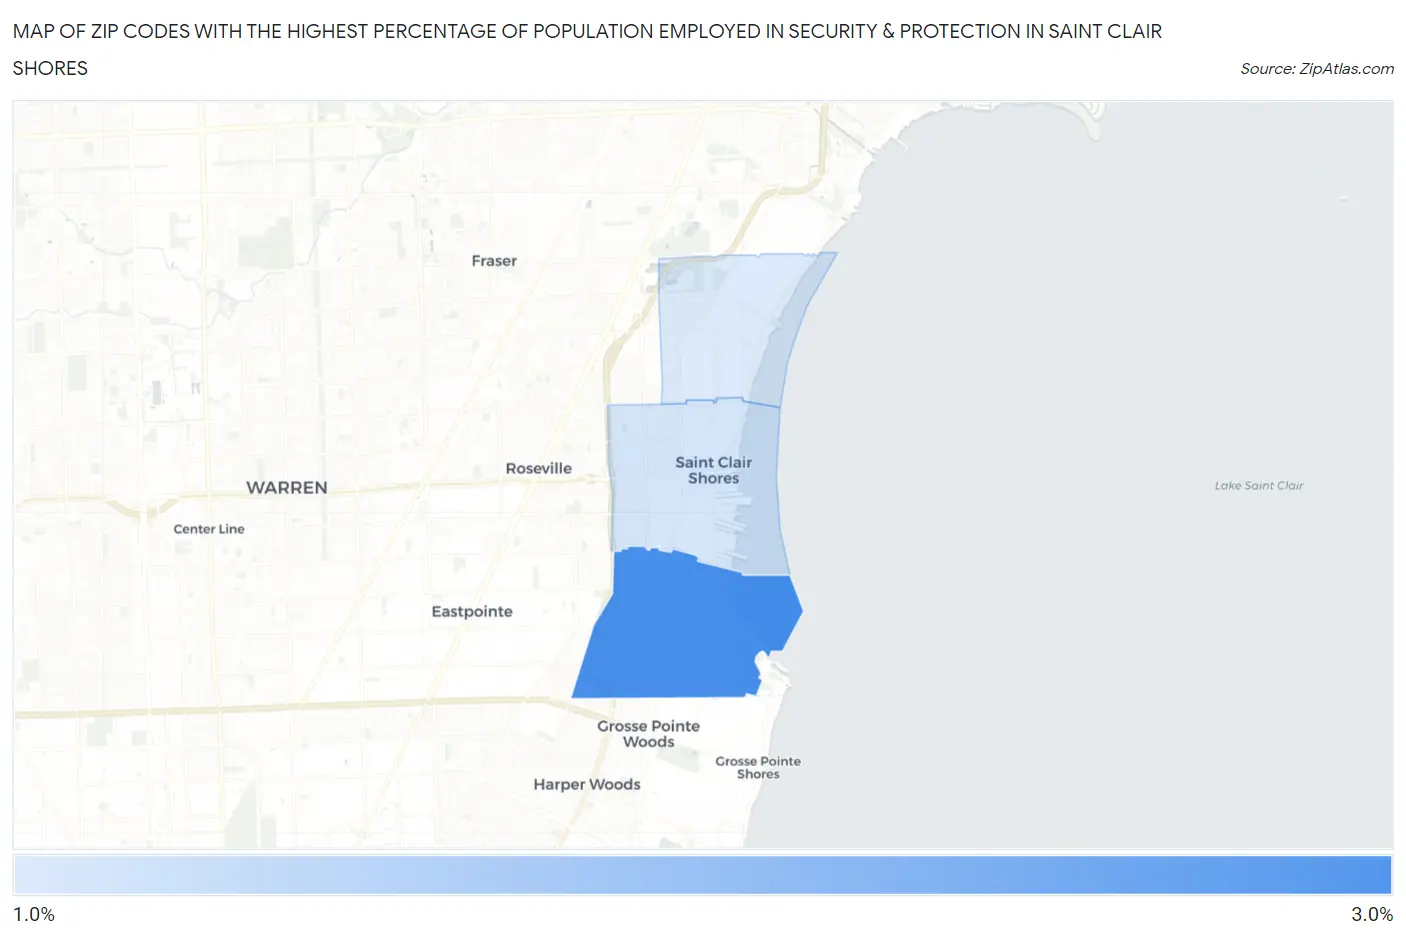
Map of Zip Codes with the Highest Percentage of Population Employed in Security & Protection in Saint Clair Shores
1.6%
2.9%
Zip Codes with the Highest Percentage of Population Employed in Security & Protection in Saint Clair Shores, MI
| Zip Code | % Employed | vs State | vs National | |
| 1. | 48080 | 2.9% | 1.6%(+1.28)#147 | 2.1%(+0.773)#7,548 |
| 2. | 48081 | 1.7% | 1.6%(+0.052)#389 | 2.1%(-0.455)#14,734 |
| 3. | 48082 | 1.6% | 1.6%(-0.012)#403 | 2.1%(-0.519)#15,182 |
1
Common Questions
What are the Top Zip Codes with the Highest Percentage of Population Employed in Security & Protection in Saint Clair Shores, MI?
Top Zip Codes with the Highest Percentage of Population Employed in Security & Protection in Saint Clair Shores, MI are:
What zip code has the Highest Percentage of Population Employed in Security & Protection in Saint Clair Shores, MI?
48080 has the Highest Percentage of Population Employed in Security & Protection in Saint Clair Shores, MI with 2.9%.
What is the Percentage of Population Employed in Security & Protection in Michigan?
Percentage of Population Employed in Security & Protection in Michigan is 1.6%.
What is the Percentage of Population Employed in Security & Protection in the United States?
Percentage of Population Employed in Security & Protection in the United States is 2.1%.