Zip Codes with the Highest Percentage of Population Employed in Security & Protection in Milford, MI
RELATED REPORTS & OPTIONS
Security & Protection
Milford
Compare Zip Codes
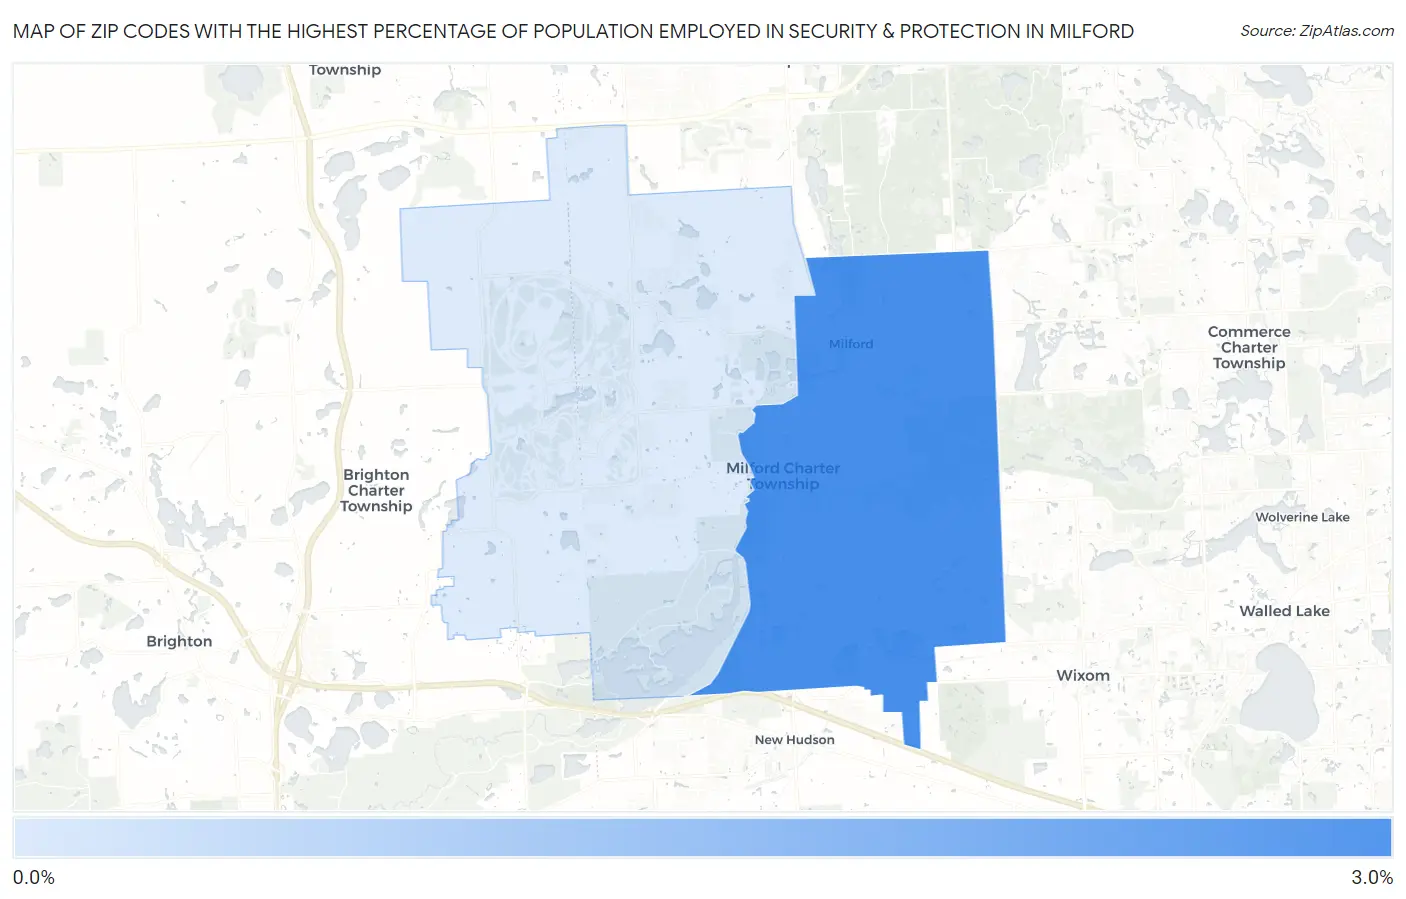
Map of Zip Codes with the Highest Percentage of Population Employed in Security & Protection in Milford
0.61%
2.6%
Zip Codes with the Highest Percentage of Population Employed in Security & Protection in Milford, MI
| Zip Code | % Employed | vs State | vs National | |
| 1. | 48381 | 2.6% | 1.6%(+0.991)#173 | 2.1%(+0.484)#8,853 |
| 2. | 48380 | 0.61% | 1.6%(-1.04)#739 | 2.1%(-1.54)#22,637 |
1
Common Questions
What are the Top Zip Codes with the Highest Percentage of Population Employed in Security & Protection in Milford, MI?
Top Zip Codes with the Highest Percentage of Population Employed in Security & Protection in Milford, MI are:
What zip code has the Highest Percentage of Population Employed in Security & Protection in Milford, MI?
48381 has the Highest Percentage of Population Employed in Security & Protection in Milford, MI with 2.6%.
What is the Percentage of Population Employed in Security & Protection in Milford, MI?
Percentage of Population Employed in Security & Protection in Milford is 2.7%.
What is the Percentage of Population Employed in Security & Protection in Michigan?
Percentage of Population Employed in Security & Protection in Michigan is 1.6%.
What is the Percentage of Population Employed in Security & Protection in the United States?
Percentage of Population Employed in Security & Protection in the United States is 2.1%.