Zip Codes with the Highest Percentage of Population Employed in Security & Protection in Holland, MI
RELATED REPORTS & OPTIONS
Security & Protection
Holland
Compare Zip Codes
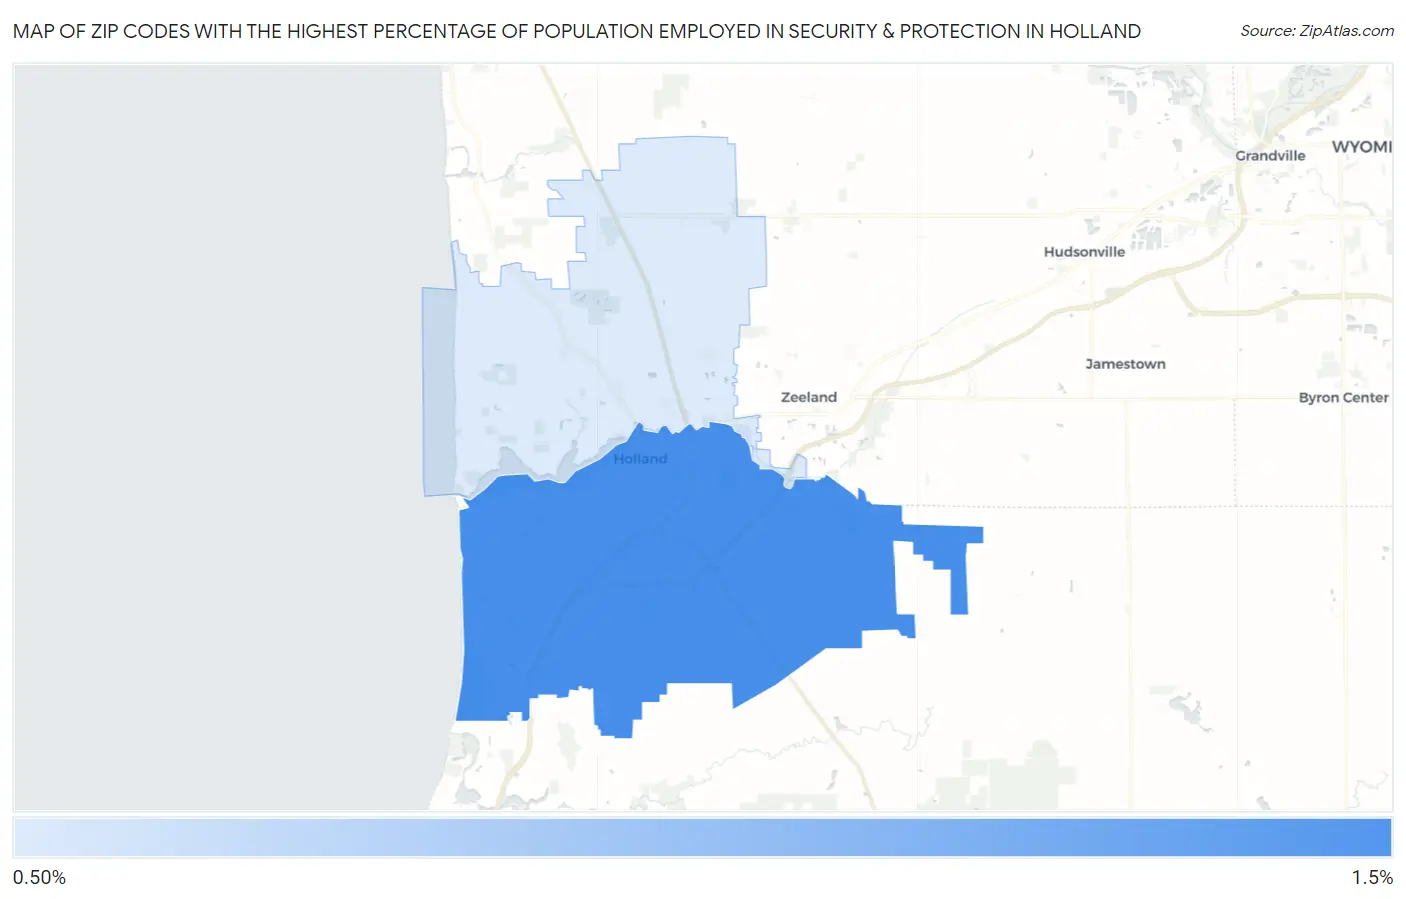
Map of Zip Codes with the Highest Percentage of Population Employed in Security & Protection in Holland
0.75%
1.2%
Zip Codes with the Highest Percentage of Population Employed in Security & Protection in Holland, MI
| Zip Code | % Employed | vs State | vs National | |
| 1. | 49423 | 1.2% | 1.6%(-0.480)#563 | 2.1%(-0.987)#18,806 |
| 2. | 49424 | 0.75% | 1.6%(-0.888)#696 | 2.1%(-1.39)#21,700 |
1
Common Questions
What are the Top Zip Codes with the Highest Percentage of Population Employed in Security & Protection in Holland, MI?
Top Zip Codes with the Highest Percentage of Population Employed in Security & Protection in Holland, MI are:
What zip code has the Highest Percentage of Population Employed in Security & Protection in Holland, MI?
49423 has the Highest Percentage of Population Employed in Security & Protection in Holland, MI with 1.2%.
What is the Percentage of Population Employed in Security & Protection in Holland, MI?
Percentage of Population Employed in Security & Protection in Holland is 1.3%.
What is the Percentage of Population Employed in Security & Protection in Michigan?
Percentage of Population Employed in Security & Protection in Michigan is 1.6%.
What is the Percentage of Population Employed in Security & Protection in the United States?
Percentage of Population Employed in Security & Protection in the United States is 2.1%.