Zip Codes with the Highest Percentage of Population Employed in Farming, Fishing & Forestry in Flint, MI
RELATED REPORTS & OPTIONS
Farming, Fishing & Forestry
Flint
Compare Zip Codes
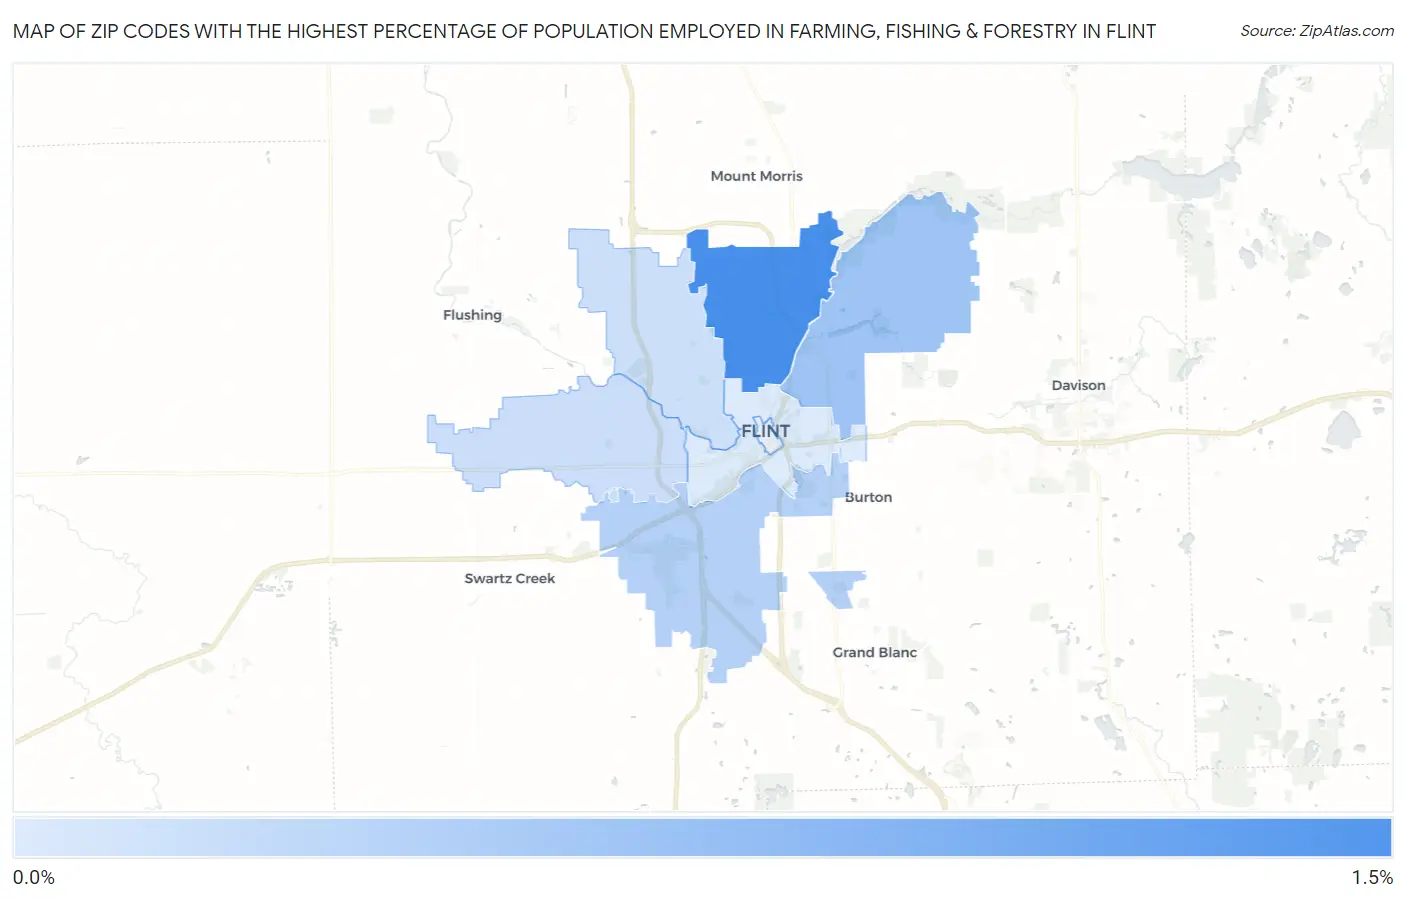
Map of Zip Codes with the Highest Percentage of Population Employed in Farming, Fishing & Forestry in Flint
0.073%
1.5%

Zip Codes with the Highest Percentage of Population Employed in Farming, Fishing & Forestry in Flint, MI
| Zip Code | % Employed | vs State | vs National | |
| 1. | 48505 | 1.5% | 0.47%(+1.02)#219 | 0.61%(+0.881)#7,924 |
| 2. | 48506 | 0.66% | 0.47%(+0.191)#366 | 0.61%(+0.052)#11,656 |
| 3. | 48507 | 0.46% | 0.47%(-0.007)#443 | 0.61%(-0.146)#13,209 |
| 4. | 48532 | 0.24% | 0.47%(-0.228)#539 | 0.61%(-0.367)#15,567 |
| 5. | 48504 | 0.22% | 0.47%(-0.243)#550 | 0.61%(-0.382)#15,788 |
| 6. | 48503 | 0.073% | 0.47%(-0.394)#652 | 0.61%(-0.533)#18,248 |
1
Common Questions
What are the Top 5 Zip Codes with the Highest Percentage of Population Employed in Farming, Fishing & Forestry in Flint, MI?
Top 5 Zip Codes with the Highest Percentage of Population Employed in Farming, Fishing & Forestry in Flint, MI are:
What zip code has the Highest Percentage of Population Employed in Farming, Fishing & Forestry in Flint, MI?
48505 has the Highest Percentage of Population Employed in Farming, Fishing & Forestry in Flint, MI with 1.5%.
What is the Percentage of Population Employed in Farming, Fishing & Forestry in Flint, MI?
Percentage of Population Employed in Farming, Fishing & Forestry in Flint is 0.49%.
What is the Percentage of Population Employed in Farming, Fishing & Forestry in Michigan?
Percentage of Population Employed in Farming, Fishing & Forestry in Michigan is 0.47%.
What is the Percentage of Population Employed in Farming, Fishing & Forestry in the United States?
Percentage of Population Employed in Farming, Fishing & Forestry in the United States is 0.61%.