Zip Codes with the Highest Percentage of Population Employed in Administrative & Support Services in Dearborn Heights, MI
RELATED REPORTS & OPTIONS
Administrative & Support Services
Dearborn Heights
Compare Zip Codes
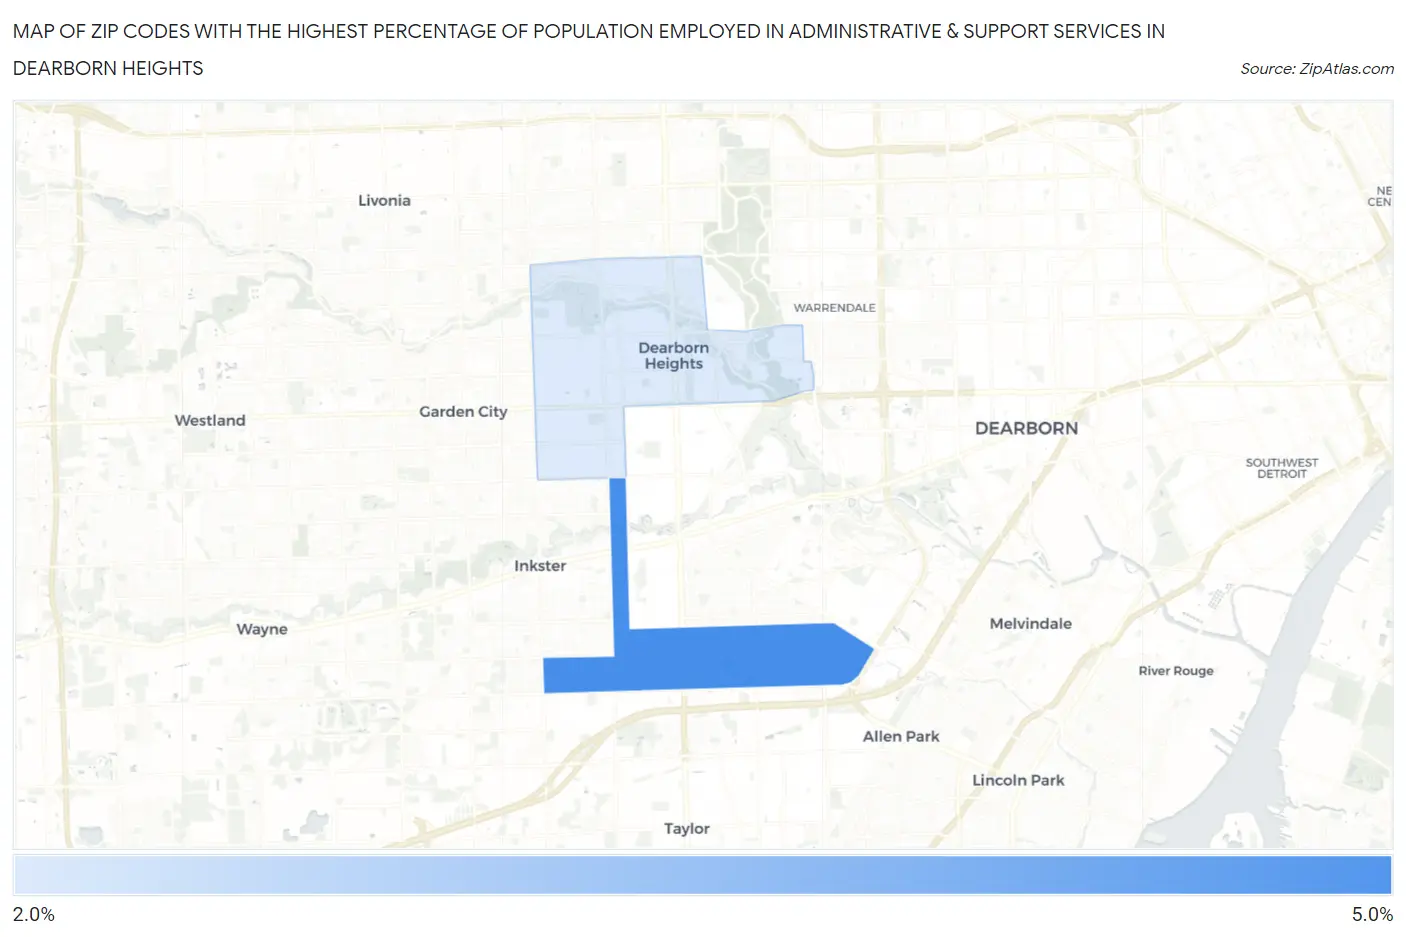
Map of Zip Codes with the Highest Percentage of Population Employed in Administrative & Support Services in Dearborn Heights
2.2%
4.8%
Zip Codes with the Highest Percentage of Population Employed in Administrative & Support Services in Dearborn Heights, MI
| Zip Code | % Employed | vs State | vs National | |
| 1. | 48125 | 4.8% | 3.7%(+1.03)#213 | 4.1%(+0.612)#7,849 |
| 2. | 48127 | 2.2% | 3.7%(-1.51)#679 | 4.1%(-1.93)#19,579 |
1
Common Questions
What are the Top Zip Codes with the Highest Percentage of Population Employed in Administrative & Support Services in Dearborn Heights, MI?
Top Zip Codes with the Highest Percentage of Population Employed in Administrative & Support Services in Dearborn Heights, MI are:
What zip code has the Highest Percentage of Population Employed in Administrative & Support Services in Dearborn Heights, MI?
48125 has the Highest Percentage of Population Employed in Administrative & Support Services in Dearborn Heights, MI with 4.8%.
What is the Percentage of Population Employed in Administrative & Support Services in Dearborn Heights, MI?
Percentage of Population Employed in Administrative & Support Services in Dearborn Heights is 3.1%.
What is the Percentage of Population Employed in Administrative & Support Services in Michigan?
Percentage of Population Employed in Administrative & Support Services in Michigan is 3.7%.
What is the Percentage of Population Employed in Administrative & Support Services in the United States?
Percentage of Population Employed in Administrative & Support Services in the United States is 4.1%.