Zip Codes with the Highest Percentage of Population Employed in Real Estate, Rental & Leasing in Dearborn Heights, MI
RELATED REPORTS & OPTIONS
Real Estate, Rental & Leasing
Dearborn Heights
Compare Zip Codes
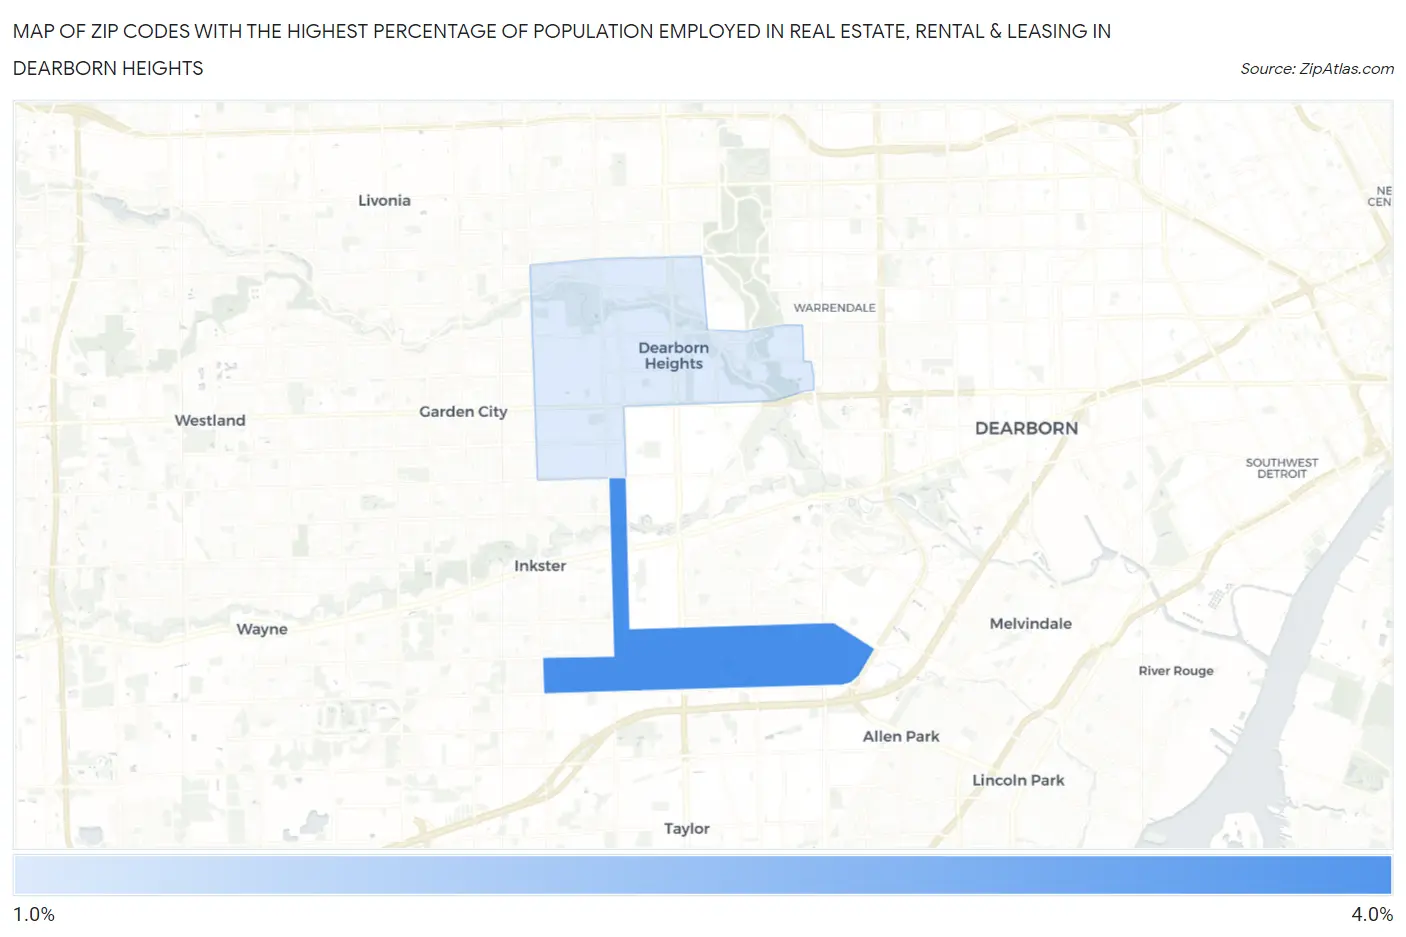
Map of Zip Codes with the Highest Percentage of Population Employed in Real Estate, Rental & Leasing in Dearborn Heights
1.3%
3.4%
Zip Codes with the Highest Percentage of Population Employed in Real Estate, Rental & Leasing in Dearborn Heights, MI
| Zip Code | % Employed | vs State | vs National | |
| 1. | 48125 | 3.4% | 1.5%(+1.89)#61 | 1.9%(+1.50)#3,029 |
| 2. | 48127 | 1.3% | 1.5%(-0.190)#395 | 1.9%(-0.576)#12,619 |
1
Common Questions
What are the Top Zip Codes with the Highest Percentage of Population Employed in Real Estate, Rental & Leasing in Dearborn Heights, MI?
Top Zip Codes with the Highest Percentage of Population Employed in Real Estate, Rental & Leasing in Dearborn Heights, MI are:
What zip code has the Highest Percentage of Population Employed in Real Estate, Rental & Leasing in Dearborn Heights, MI?
48125 has the Highest Percentage of Population Employed in Real Estate, Rental & Leasing in Dearborn Heights, MI with 3.4%.
What is the Percentage of Population Employed in Real Estate, Rental & Leasing in Dearborn Heights, MI?
Percentage of Population Employed in Real Estate, Rental & Leasing in Dearborn Heights is 2.1%.
What is the Percentage of Population Employed in Real Estate, Rental & Leasing in Michigan?
Percentage of Population Employed in Real Estate, Rental & Leasing in Michigan is 1.5%.
What is the Percentage of Population Employed in Real Estate, Rental & Leasing in the United States?
Percentage of Population Employed in Real Estate, Rental & Leasing in the United States is 1.9%.