Zip Codes with the Highest Percentage of Population Employed in Business & Financial in Dearborn Heights, MI
RELATED REPORTS & OPTIONS
Business & Financial
Dearborn Heights
Compare Zip Codes
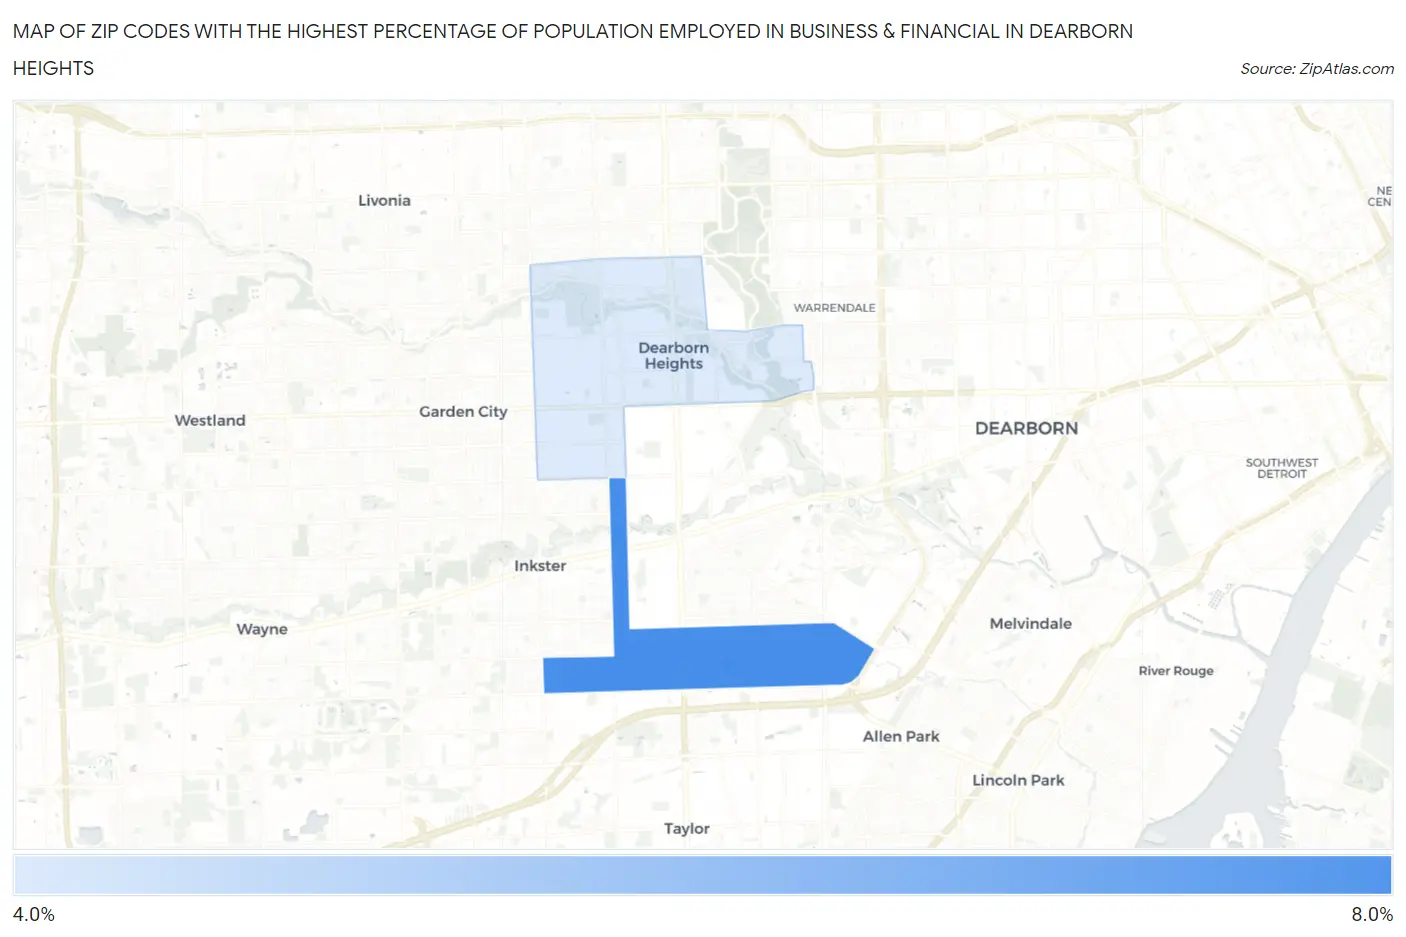
Map of Zip Codes with the Highest Percentage of Population Employed in Business & Financial in Dearborn Heights
5.0%
6.1%
Zip Codes with the Highest Percentage of Population Employed in Business & Financial in Dearborn Heights, MI
| Zip Code | % Employed | vs State | vs National | |
| 1. | 48125 | 6.1% | 5.3%(+0.819)#202 | 5.8%(+0.320)#7,643 |
| 2. | 48127 | 5.0% | 5.3%(-0.289)#296 | 5.8%(-0.788)#10,540 |
1
Common Questions
What are the Top Zip Codes with the Highest Percentage of Population Employed in Business & Financial in Dearborn Heights, MI?
Top Zip Codes with the Highest Percentage of Population Employed in Business & Financial in Dearborn Heights, MI are:
What zip code has the Highest Percentage of Population Employed in Business & Financial in Dearborn Heights, MI?
48125 has the Highest Percentage of Population Employed in Business & Financial in Dearborn Heights, MI with 6.1%.
What is the Percentage of Population Employed in Business & Financial in Dearborn Heights, MI?
Percentage of Population Employed in Business & Financial in Dearborn Heights is 5.4%.
What is the Percentage of Population Employed in Business & Financial in Michigan?
Percentage of Population Employed in Business & Financial in Michigan is 5.3%.
What is the Percentage of Population Employed in Business & Financial in the United States?
Percentage of Population Employed in Business & Financial in the United States is 5.8%.