Dutch vs Immigrants from Caribbean Median Family Income
COMPARE
Dutch
Immigrants from Caribbean
Median Family Income
Median Family Income Comparison
Dutch
Immigrants from Caribbean
$101,192
MEDIAN FAMILY INCOME
31.9/ 100
METRIC RATING
185th/ 347
METRIC RANK
$83,319
MEDIAN FAMILY INCOME
0.0/ 100
METRIC RATING
321st/ 347
METRIC RANK
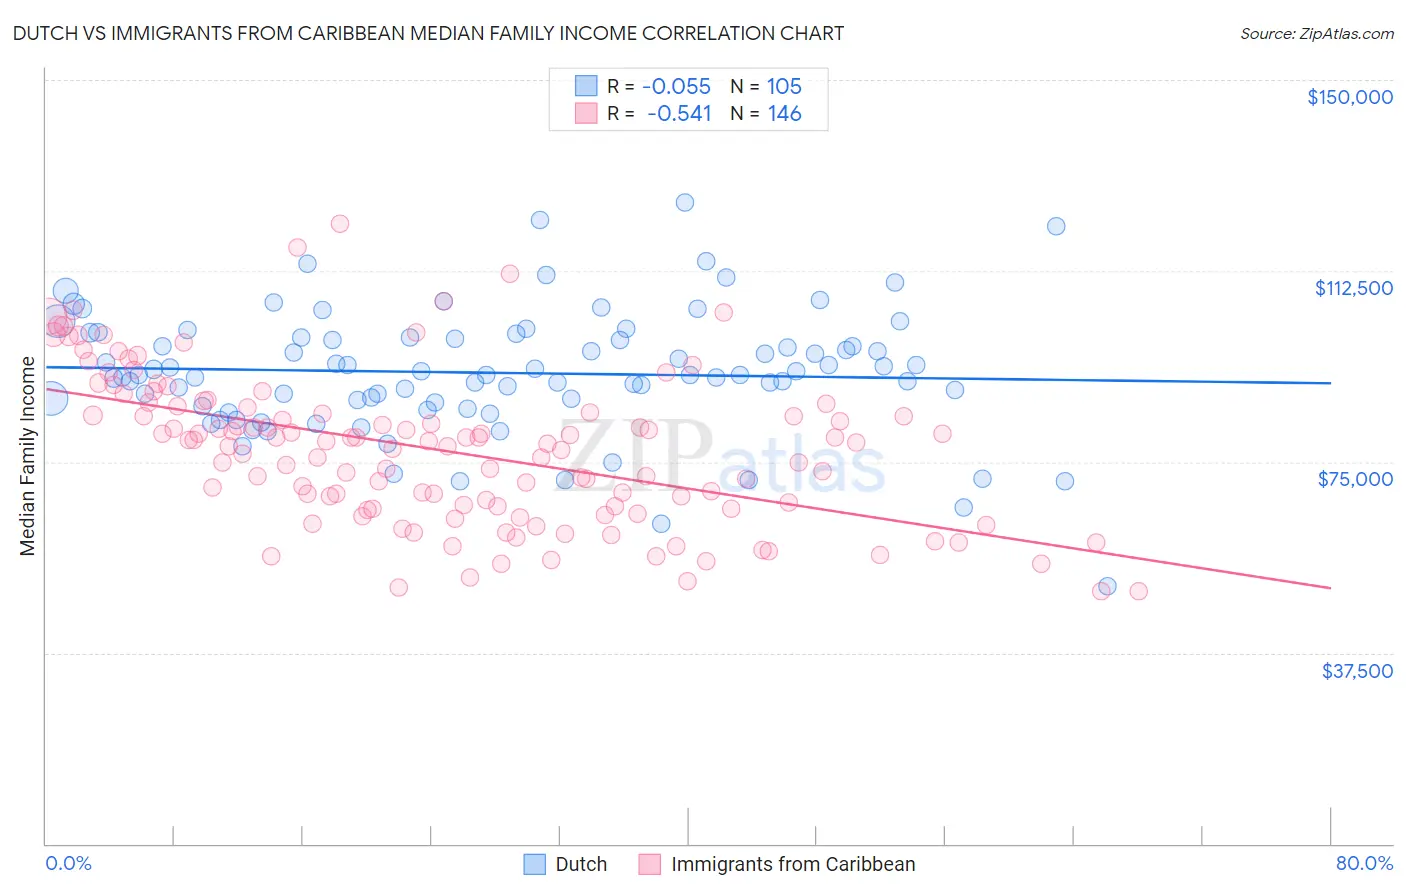
Dutch vs Immigrants from Caribbean Median Family Income Correlation Chart
The statistical analysis conducted on geographies consisting of 553,300,632 people shows a slight negative correlation between the proportion of Dutch and median family income in the United States with a correlation coefficient (R) of -0.055 and weighted average of $101,192. Similarly, the statistical analysis conducted on geographies consisting of 449,450,188 people shows a substantial negative correlation between the proportion of Immigrants from Caribbean and median family income in the United States with a correlation coefficient (R) of -0.541 and weighted average of $83,319, a difference of 21.4%.
Median Family Income Correlation Summary
| Measurement | Dutch | Immigrants from Caribbean |
| Minimum | $50,679 | $49,547 |
| Maximum | $126,042 | $121,711 |
| Range | $75,363 | $72,164 |
| Mean | $92,505 | $77,294 |
| Median | $92,000 | $78,717 |
| Interquartile 25% (IQ1) | $86,239 | $66,192 |
| Interquartile 75% (IQ3) | $99,471 | $85,685 |
| Interquartile Range (IQR) | $13,232 | $19,492 |
| Standard Deviation (Sample) | $12,293 | $14,692 |
| Standard Deviation (Population) | $12,235 | $14,641 |
Similar Demographics by Median Family Income
Demographics Similar to Dutch by Median Family Income
In terms of median family income, the demographic groups most similar to Dutch are Celtic ($101,139, a difference of 0.050%), Tlingit-Haida ($101,092, a difference of 0.10%), Guamanian/Chamorro ($101,061, a difference of 0.13%), Immigrants from Costa Rica ($101,354, a difference of 0.16%), and Immigrants from Portugal ($100,984, a difference of 0.21%).
| Demographics | Rating | Rank | Median Family Income |
| Welsh | 43.3 /100 | #178 | Average $102,151 |
| South Americans | 39.7 /100 | #179 | Fair $101,856 |
| French Canadians | 37.0 /100 | #180 | Fair $101,634 |
| Spaniards | 36.8 /100 | #181 | Fair $101,617 |
| Tsimshian | 35.9 /100 | #182 | Fair $101,543 |
| Kenyans | 34.5 /100 | #183 | Fair $101,417 |
| Immigrants | Costa Rica | 33.7 /100 | #184 | Fair $101,354 |
| Dutch | 31.9 /100 | #185 | Fair $101,192 |
| Celtics | 31.3 /100 | #186 | Fair $101,139 |
| Tlingit-Haida | 30.8 /100 | #187 | Fair $101,092 |
| Guamanians/Chamorros | 30.5 /100 | #188 | Fair $101,061 |
| Immigrants | Portugal | 29.6 /100 | #189 | Fair $100,984 |
| Immigrants | Immigrants | 29.4 /100 | #190 | Fair $100,962 |
| Colombians | 27.2 /100 | #191 | Fair $100,750 |
| Immigrants | Kenya | 26.5 /100 | #192 | Fair $100,679 |
Demographics Similar to Immigrants from Caribbean by Median Family Income
In terms of median family income, the demographic groups most similar to Immigrants from Caribbean are Seminole ($83,354, a difference of 0.040%), Immigrants from Honduras ($83,618, a difference of 0.36%), Immigrants from Mexico ($83,639, a difference of 0.38%), Dominican ($82,888, a difference of 0.52%), and Yakama ($83,932, a difference of 0.74%).
| Demographics | Rating | Rank | Median Family Income |
| Immigrants | Bahamas | 0.0 /100 | #314 | Tragic $84,732 |
| Apache | 0.0 /100 | #315 | Tragic $84,451 |
| Immigrants | Haiti | 0.0 /100 | #316 | Tragic $84,018 |
| Yakama | 0.0 /100 | #317 | Tragic $83,932 |
| Immigrants | Mexico | 0.0 /100 | #318 | Tragic $83,639 |
| Immigrants | Honduras | 0.0 /100 | #319 | Tragic $83,618 |
| Seminole | 0.0 /100 | #320 | Tragic $83,354 |
| Immigrants | Caribbean | 0.0 /100 | #321 | Tragic $83,319 |
| Dominicans | 0.0 /100 | #322 | Tragic $82,888 |
| Bahamians | 0.0 /100 | #323 | Tragic $82,631 |
| Creek | 0.0 /100 | #324 | Tragic $82,560 |
| Sioux | 0.0 /100 | #325 | Tragic $82,386 |
| Immigrants | Congo | 0.0 /100 | #326 | Tragic $82,216 |
| Arapaho | 0.0 /100 | #327 | Tragic $82,064 |
| Blacks/African Americans | 0.0 /100 | #328 | Tragic $81,912 |