Yugoslavian vs Korean Per Capita Income
COMPARE
Yugoslavian
Korean
Per Capita Income
Per Capita Income Comparison
Yugoslavians
Koreans
$42,792
PER CAPITA INCOME
27.4/ 100
METRIC RATING
191st/ 347
METRIC RANK
$44,522
PER CAPITA INCOME
72.5/ 100
METRIC RATING
149th/ 347
METRIC RANK
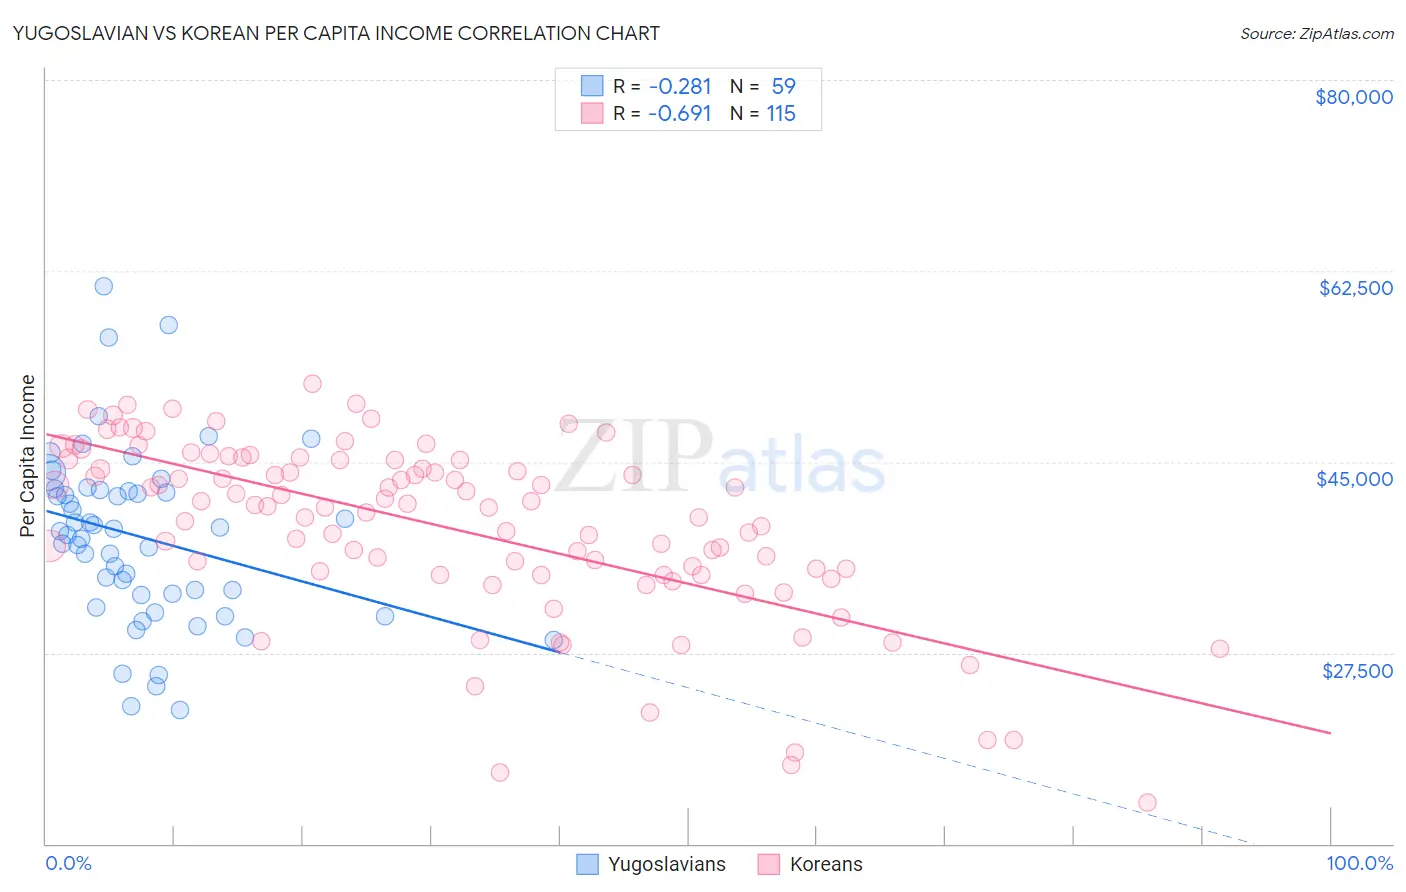
Yugoslavian vs Korean Per Capita Income Correlation Chart
The statistical analysis conducted on geographies consisting of 285,729,855 people shows a weak negative correlation between the proportion of Yugoslavians and per capita income in the United States with a correlation coefficient (R) of -0.281 and weighted average of $42,792. Similarly, the statistical analysis conducted on geographies consisting of 510,996,517 people shows a significant negative correlation between the proportion of Koreans and per capita income in the United States with a correlation coefficient (R) of -0.691 and weighted average of $44,522, a difference of 4.0%.
Per Capita Income Correlation Summary
| Measurement | Yugoslavian | Korean |
| Minimum | $22,217 | $13,802 |
| Maximum | $61,060 | $52,147 |
| Range | $38,843 | $38,345 |
| Mean | $38,123 | $38,981 |
| Median | $38,605 | $40,908 |
| Interquartile 25% (IQ1) | $32,828 | $34,687 |
| Interquartile 75% (IQ3) | $42,402 | $45,181 |
| Interquartile Range (IQR) | $9,574 | $10,494 |
| Standard Deviation (Sample) | $8,004 | $8,123 |
| Standard Deviation (Population) | $7,935 | $8,088 |
Similar Demographics by Per Capita Income
Demographics Similar to Yugoslavians by Per Capita Income
In terms of per capita income, the demographic groups most similar to Yugoslavians are Kenyan ($42,808, a difference of 0.040%), Iraqi ($42,760, a difference of 0.070%), Immigrants from Sierra Leone ($42,752, a difference of 0.090%), Immigrants from Fiji ($42,694, a difference of 0.23%), and Bermudan ($42,911, a difference of 0.28%).
| Demographics | Rating | Rank | Per Capita Income |
| Spaniards | 32.9 /100 | #184 | Fair $43,028 |
| Immigrants | Immigrants | 32.5 /100 | #185 | Fair $43,010 |
| French Canadians | 32.3 /100 | #186 | Fair $43,003 |
| Immigrants | Colombia | 31.5 /100 | #187 | Fair $42,971 |
| Immigrants | Africa | 31.0 /100 | #188 | Fair $42,950 |
| Bermudans | 30.1 /100 | #189 | Fair $42,911 |
| Kenyans | 27.7 /100 | #190 | Fair $42,808 |
| Yugoslavians | 27.4 /100 | #191 | Fair $42,792 |
| Iraqis | 26.7 /100 | #192 | Fair $42,760 |
| Immigrants | Sierra Leone | 26.5 /100 | #193 | Fair $42,752 |
| Immigrants | Fiji | 25.2 /100 | #194 | Fair $42,694 |
| Immigrants | Kenya | 24.5 /100 | #195 | Fair $42,661 |
| Dutch | 23.4 /100 | #196 | Fair $42,605 |
| Scotch-Irish | 22.6 /100 | #197 | Fair $42,563 |
| Immigrants | Portugal | 19.7 /100 | #198 | Poor $42,412 |
Demographics Similar to Koreans by Per Capita Income
In terms of per capita income, the demographic groups most similar to Koreans are Immigrants from Eritrea ($44,509, a difference of 0.030%), Immigrants from Armenia ($44,552, a difference of 0.070%), Norwegian ($44,480, a difference of 0.10%), Peruvian ($44,479, a difference of 0.10%), and Czech ($44,595, a difference of 0.16%).
| Demographics | Rating | Rank | Per Capita Income |
| Ugandans | 82.6 /100 | #142 | Excellent $45,047 |
| Immigrants | Uganda | 82.5 /100 | #143 | Excellent $45,043 |
| Icelanders | 81.6 /100 | #144 | Excellent $44,987 |
| Immigrants | Afghanistan | 78.0 /100 | #145 | Good $44,790 |
| Irish | 75.8 /100 | #146 | Good $44,679 |
| Czechs | 74.1 /100 | #147 | Good $44,595 |
| Immigrants | Armenia | 73.1 /100 | #148 | Good $44,552 |
| Koreans | 72.5 /100 | #149 | Good $44,522 |
| Immigrants | Eritrea | 72.1 /100 | #150 | Good $44,509 |
| Norwegians | 71.5 /100 | #151 | Good $44,480 |
| Peruvians | 71.5 /100 | #152 | Good $44,479 |
| Scottish | 70.6 /100 | #153 | Good $44,440 |
| Portuguese | 68.7 /100 | #154 | Good $44,362 |
| Uruguayans | 67.6 /100 | #155 | Good $44,318 |
| Slovaks | 65.4 /100 | #156 | Good $44,229 |