Guamanian/Chamorro vs Immigrants from Korea Per Capita Income
COMPARE
Guamanian/Chamorro
Immigrants from Korea
Per Capita Income
Per Capita Income Comparison
Guamanians/Chamorros
Immigrants from Korea
$41,678
PER CAPITA INCOME
9.7/ 100
METRIC RATING
217th/ 347
METRIC RANK
$51,671
PER CAPITA INCOME
100.0/ 100
METRIC RATING
40th/ 347
METRIC RANK
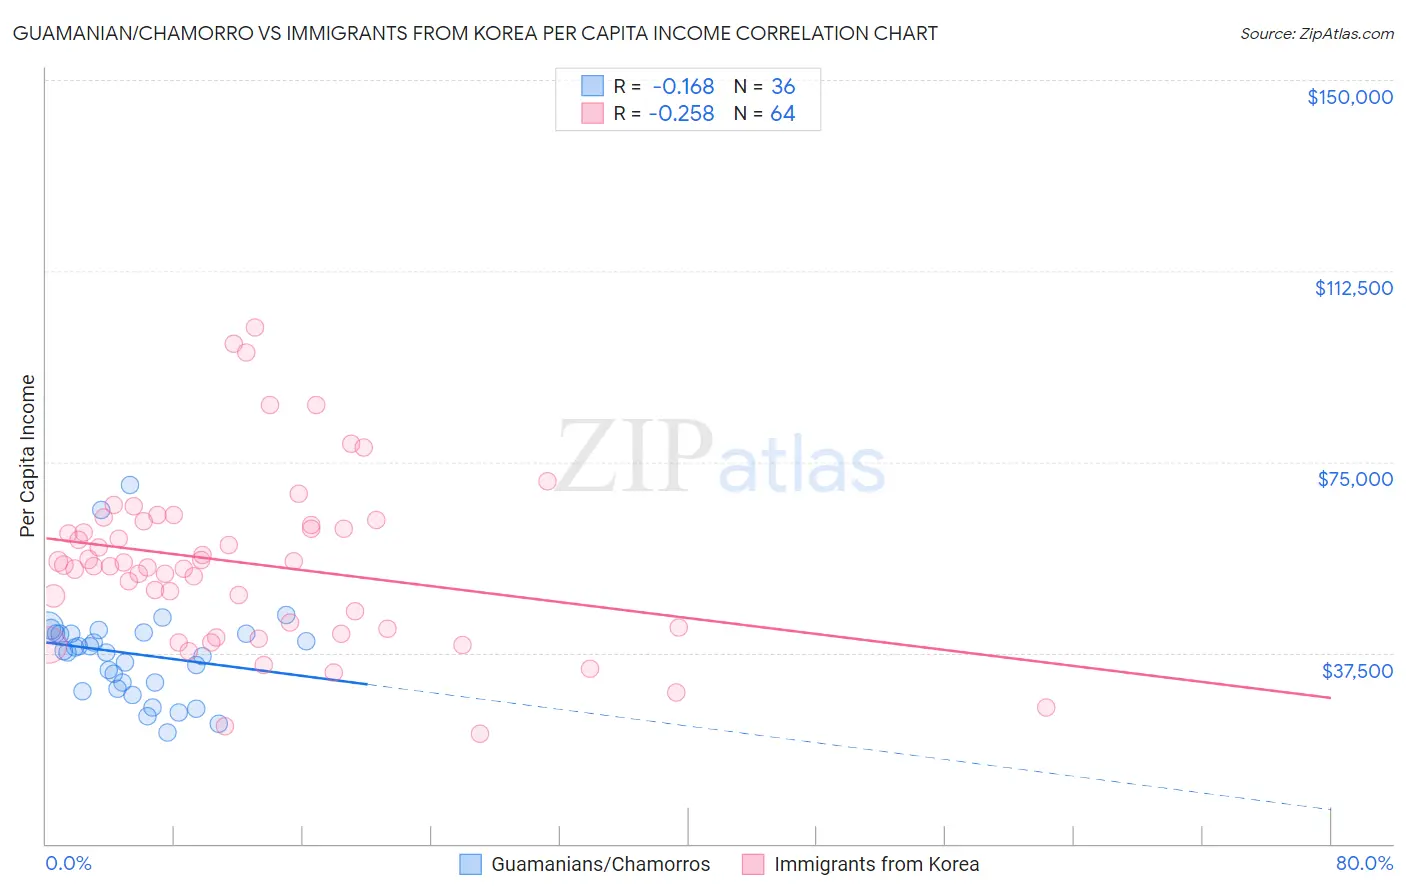
Guamanian/Chamorro vs Immigrants from Korea Per Capita Income Correlation Chart
The statistical analysis conducted on geographies consisting of 221,916,418 people shows a poor negative correlation between the proportion of Guamanians/Chamorros and per capita income in the United States with a correlation coefficient (R) of -0.168 and weighted average of $41,678. Similarly, the statistical analysis conducted on geographies consisting of 416,363,893 people shows a weak negative correlation between the proportion of Immigrants from Korea and per capita income in the United States with a correlation coefficient (R) of -0.258 and weighted average of $51,671, a difference of 24.0%.
Per Capita Income Correlation Summary
| Measurement | Guamanian/Chamorro | Immigrants from Korea |
| Minimum | $21,937 | $21,671 |
| Maximum | $70,391 | $101,406 |
| Range | $48,454 | $79,735 |
| Mean | $37,325 | $55,080 |
| Median | $37,776 | $54,636 |
| Interquartile 25% (IQ1) | $31,068 | $42,367 |
| Interquartile 75% (IQ3) | $41,275 | $62,916 |
| Interquartile Range (IQR) | $10,207 | $20,549 |
| Standard Deviation (Sample) | $9,827 | $16,727 |
| Standard Deviation (Population) | $9,689 | $16,596 |
Similar Demographics by Per Capita Income
Demographics Similar to Guamanians/Chamorros by Per Capita Income
In terms of per capita income, the demographic groups most similar to Guamanians/Chamorros are Tongan ($41,693, a difference of 0.030%), Sudanese ($41,695, a difference of 0.040%), Trinidadian and Tobagonian ($41,655, a difference of 0.060%), Immigrants from Bangladesh ($41,709, a difference of 0.070%), and Immigrants from Venezuela ($41,727, a difference of 0.12%).
| Demographics | Rating | Rank | Per Capita Income |
| Ecuadorians | 12.9 /100 | #210 | Poor $41,958 |
| Immigrants | Panama | 11.6 /100 | #211 | Poor $41,853 |
| Immigrants | Senegal | 11.3 /100 | #212 | Poor $41,830 |
| Immigrants | Venezuela | 10.2 /100 | #213 | Poor $41,727 |
| Immigrants | Bangladesh | 10.1 /100 | #214 | Poor $41,709 |
| Sudanese | 9.9 /100 | #215 | Tragic $41,695 |
| Tongans | 9.9 /100 | #216 | Tragic $41,693 |
| Guamanians/Chamorros | 9.7 /100 | #217 | Tragic $41,678 |
| Trinidadians and Tobagonians | 9.5 /100 | #218 | Tragic $41,655 |
| Puget Sound Salish | 8.1 /100 | #219 | Tragic $41,495 |
| Immigrants | Barbados | 7.9 /100 | #220 | Tragic $41,478 |
| Immigrants | Trinidad and Tobago | 7.9 /100 | #221 | Tragic $41,476 |
| Immigrants | Iraq | 7.1 /100 | #222 | Tragic $41,365 |
| Immigrants | Cameroon | 6.8 /100 | #223 | Tragic $41,334 |
| Immigrants | St. Vincent and the Grenadines | 6.4 /100 | #224 | Tragic $41,270 |
Demographics Similar to Immigrants from Korea by Per Capita Income
In terms of per capita income, the demographic groups most similar to Immigrants from Korea are Cambodian ($51,731, a difference of 0.12%), Immigrants from Czechoslovakia ($51,770, a difference of 0.19%), Estonian ($51,875, a difference of 0.39%), Immigrants from South Africa ($51,465, a difference of 0.40%), and Immigrants from Greece ($51,891, a difference of 0.43%).
| Demographics | Rating | Rank | Per Capita Income |
| Australians | 100.0 /100 | #33 | Exceptional $52,074 |
| Immigrants | Russia | 100.0 /100 | #34 | Exceptional $52,044 |
| Burmese | 100.0 /100 | #35 | Exceptional $52,005 |
| Immigrants | Greece | 100.0 /100 | #36 | Exceptional $51,891 |
| Estonians | 100.0 /100 | #37 | Exceptional $51,875 |
| Immigrants | Czechoslovakia | 100.0 /100 | #38 | Exceptional $51,770 |
| Cambodians | 100.0 /100 | #39 | Exceptional $51,731 |
| Immigrants | Korea | 100.0 /100 | #40 | Exceptional $51,671 |
| Immigrants | South Africa | 100.0 /100 | #41 | Exceptional $51,465 |
| Immigrants | Turkey | 100.0 /100 | #42 | Exceptional $51,368 |
| Immigrants | Lithuania | 100.0 /100 | #43 | Exceptional $51,361 |
| Immigrants | Europe | 100.0 /100 | #44 | Exceptional $50,950 |
| Immigrants | Spain | 100.0 /100 | #45 | Exceptional $50,933 |
| Immigrants | Latvia | 100.0 /100 | #46 | Exceptional $50,914 |
| Bulgarians | 100.0 /100 | #47 | Exceptional $50,906 |