Zip Codes with the Highest Percentage of Households with Income Above $100,000 in Bloomington, IN
RELATED REPORTS & OPTIONS
Household Income | $100k+
Bloomington
Compare Zip Codes
Map of Zip Codes with the Highest Percentage of Households with Income Above $100,000 in Bloomington
13.3%
33.7%
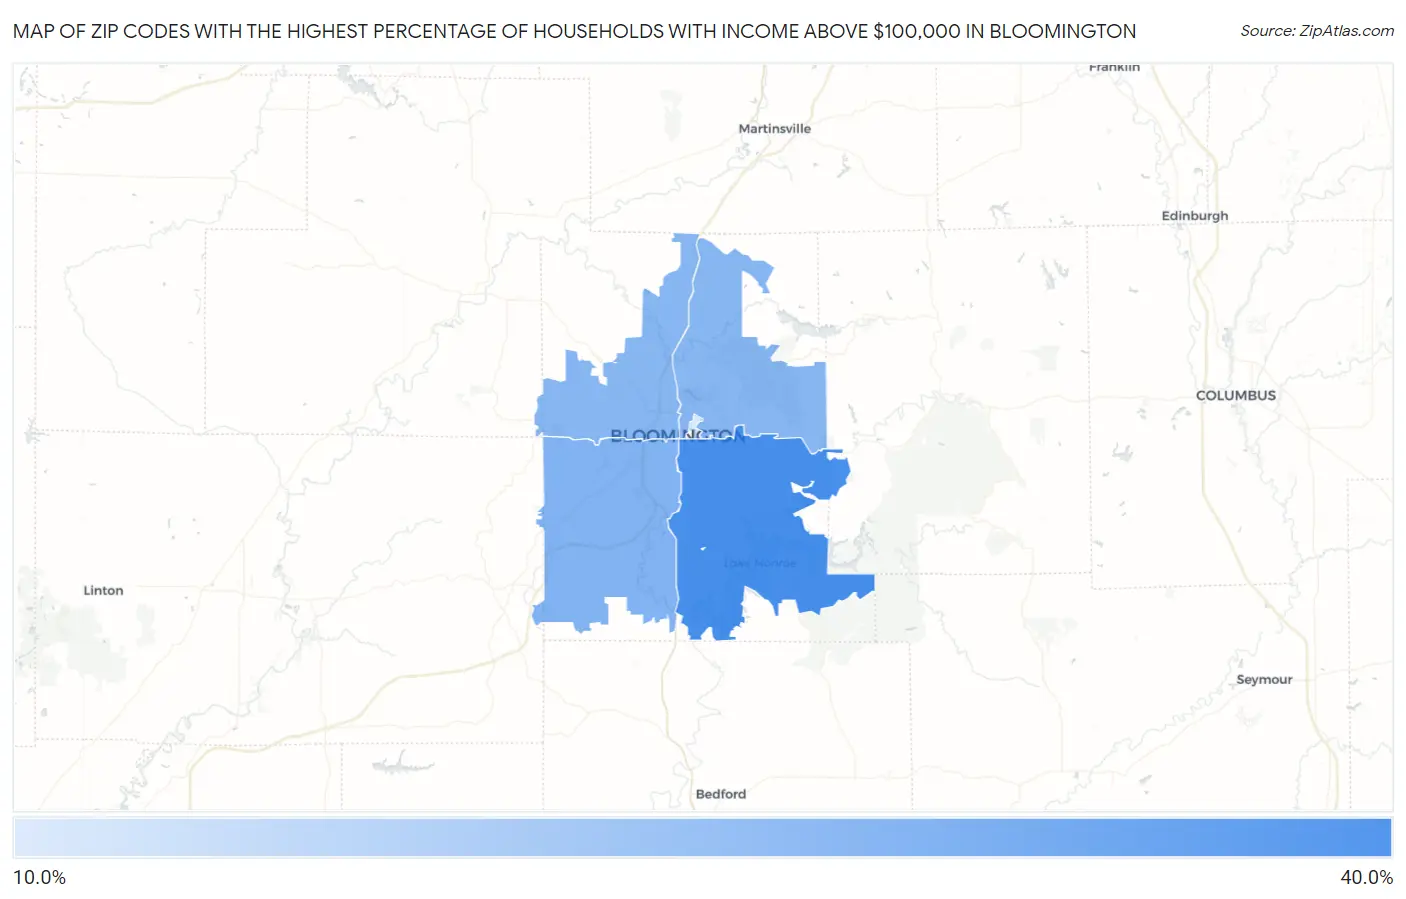
Zip Codes with the Highest Percentage of Households with Income Above $100,000 in Bloomington, IN
| Zip Code | Households with Income > $100k | vs State | vs National | |
| 1. | 47401 | 33.7% | 30.7%(+3.00)#229 | 37.3%(-3.60)#12,634 |
| 2. | 47403 | 25.4% | 30.7%(-5.30)#439 | 37.3%(-11.9)#19,383 |
| 3. | 47404 | 24.4% | 30.7%(-6.30)#476 | 37.3%(-12.9)#20,286 |
| 4. | 47408 | 24.4% | 30.7%(-6.30)#477 | 37.3%(-12.9)#20,288 |
| 5. | 47406 | 13.3% | 30.7%(-17.4)#691 | 37.3%(-24.0)#28,442 |
1
Common Questions
What are the Top 3 Zip Codes with the Highest Percentage of Households with Income Above $100,000 in Bloomington, IN?
Top 3 Zip Codes with the Highest Percentage of Households with Income Above $100,000 in Bloomington, IN are:
What zip code has the Highest Percentage of Households with Income Above $100,000 in Bloomington, IN?
47401 has the Highest Percentage of Households with Income Above $100,000 in Bloomington, IN with 33.7%.
What is the Percentage of Households with Income Above $100,000 in Bloomington, IN?
Percentage of Households with Income Above $100,000 in Bloomington is 22.1%.
What is the Percentage of Households with Income Above $100,000 in Indiana?
Percentage of Households with Income Above $100,000 in Indiana is 30.7%.
What is the Percentage of Households with Income Above $100,000 in the United States?
Percentage of Households with Income Above $100,000 in the United States is 37.3%.