Zip Codes with the Highest Percentage of Households with Income Above $100,000 in Fort Wayne, IN

RELATED REPORTS & OPTIONS

Household Income | $100k+
Population
Families and Households
Female Fertility
Female Fertility (Unmarried)
Race (Community Size)
Race (Percentage)
Ancestry (Community Size)
AfricanAlbanianAmericanApacheArabArgentineanArmenianAustralianAustrianBelgianBhutaneseBlackfeetBrazilianBritishBulgarianBurmeseCanadianCarpatho RusynCelticCentral AmericanCentral American IndianCherokeeChickasawChippewaChoctawColombianCroatianCubanCzechCzechoslovakianDanishDominicanDutchEastern EuropeanEcuadorianEnglishEthiopianEuropeanFilipinoFinnishFrenchFrench American IndianFrench CanadianGermanGerman RussianGhanaianGreekGuamanian / ChamorroGuatemalanHaitianHonduranHungarianIndian (Asian)IndonesianIranianIraqiIrishIroquoisIsraeliItalianJamaicanJordanianKenyanKoreanLatvianLebaneseLiberianLithuanianLuxembourgerMacedonianMalaysianMexicanMexican American IndianMongolianMoroccanNative HawaiianNavajoNicaraguanNigerianNorthern EuropeanNorwegianOttawaPakistaniPalestinianPanamanianPennsylvania GermanPeruvianPolishPortuguesePuerto RicanRomanianRussianSalvadoranScandinavianScotch-IrishScottishSerbianSiouxSlavicSlovakSloveneSouth AfricanSouth AmericanSouth American IndianSpaniardSpanishSri LankanSubsaharan AfricanSudaneseSwedishSwissSyrianThaiTrinidadian and TobagonianUkrainianVenezuelanVietnameseWelshWest IndianYugoslavian
Ancestry (Percentage)
AfricanAlbanianAmericanApacheArabArgentineanArmenianAustralianAustrianBelgianBhutaneseBlackfeetBrazilianBritishBulgarianBurmeseCanadianCarpatho RusynCelticCentral AmericanCentral American IndianCherokeeChickasawChippewaChoctawColombianCroatianCubanCzechCzechoslovakianDanishDominicanDutchEastern EuropeanEcuadorianEnglishEthiopianEuropeanFilipinoFinnishFrenchFrench American IndianFrench CanadianGermanGerman RussianGhanaianGreekGuamanian / ChamorroGuatemalanHaitianHonduranHungarianIndian (Asian)IndonesianIranianIraqiIrishIroquoisIsraeliItalianJamaicanJordanianKenyanKoreanLatvianLebaneseLiberianLithuanianLuxembourgerMacedonianMalaysianMexicanMexican American IndianMongolianMoroccanNative HawaiianNavajoNicaraguanNigerianNorthern EuropeanNorwegianOttawaPakistaniPalestinianPanamanianPennsylvania GermanPeruvianPolishPortuguesePuerto RicanRomanianRussianSalvadoranScandinavianScotch-IrishScottishSerbianSiouxSlavicSlovakSloveneSouth AfricanSouth AmericanSouth American IndianSpaniardSpanishSri LankanSubsaharan AfricanSudaneseSwedishSwissSyrianThaiTrinidadian and TobagonianUkrainianVenezuelanVietnameseWelshWest IndianYugoslavian
Immigrant Origin (Total)
Immigrant Origin (Percentage)
Income
Income (Families)
Income (Households)
Poverty
Poverty (Families)
Unemployment
Employment Occupations
Employment Industries
Employer Class
Commute Time
Commute Means
School Enrollment
Education by Degree Field
Occupancy
Finances
Physical Characteristics
Fort Wayne
Compare Zip Codes
Comparison Subject

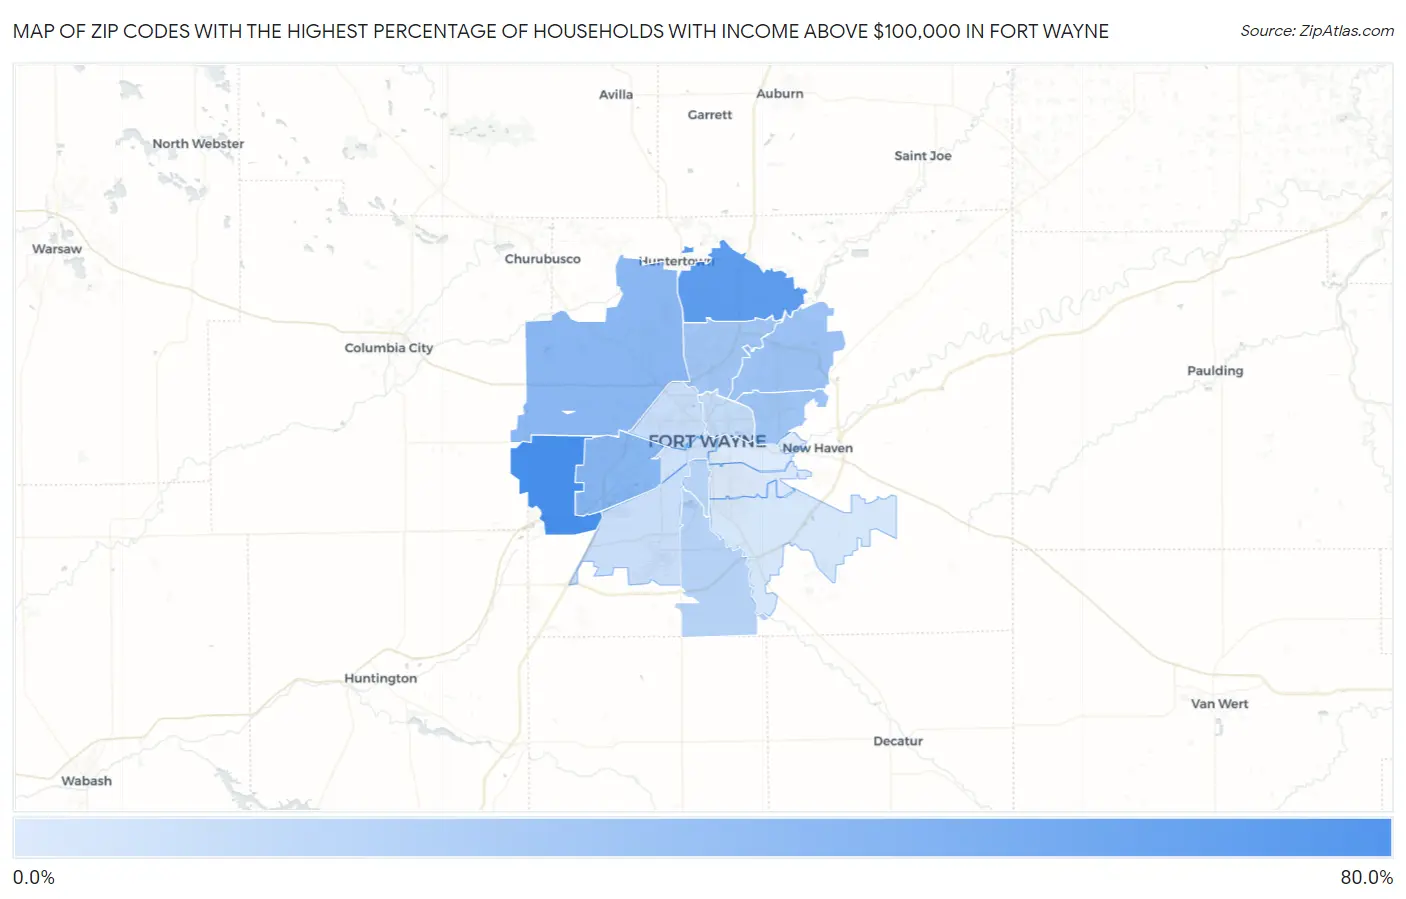
Map of Zip Codes with the Highest Percentage of Households with Income Above $100,000 in Fort Wayne

0.0%
80.0%
Zip Codes with the Highest Percentage of Households with Income Above $100,000 in Fort Wayne Map

Zip Codes with the Highest Percentage of Households with Income Above $100,000 in Fort Wayne, IN

Zip Code Households with Income > $100k vs State vs National
1.4681465.1%30.7%(+34.4)#1037.3%(+27.8)#1,525
2.4684554.9%30.7%(+24.2)#2837.3%(+17.6)#3,474
3.4680437.8%30.7%(+7.10)#16537.3%(+0.500)#10,097
4.4681837.1%30.7%(+6.40)#17637.3%(-0.200)#10,486
5.4683530.6%30.7%(-0.100)#30937.3%(-6.70)#14,956
6.4681529.2%30.7%(-1.50)#34637.3%(-8.10)#16,064
7.4682529.0%30.7%(-1.70)#35137.3%(-8.30)#16,227
8.4681921.5%30.7%(-9.20)#55037.3%(-15.8)#22,817
9.4680720.0%30.7%(-10.7)#58337.3%(-17.3)#24,021
10.4680516.7%30.7%(-14.0)#64537.3%(-20.6)#26,434
11.4680915.6%30.7%(-15.1)#66037.3%(-21.7)#27,183
12.4680815.4%30.7%(-15.3)#66137.3%(-21.9)#27,303
13.4680213.7%30.7%(-17.0)#68237.3%(-23.6)#28,253
14.4681611.1%30.7%(-19.6)#70737.3%(-26.2)#29,394
15.4680610.0%30.7%(-20.7)#71637.3%(-27.3)#29,820
16.468039.1%30.7%(-21.6)#72537.3%(-28.2)#30,116

Common Questions

What are the Top 10 Zip Codes with the Highest Percentage of Households with Income Above $100,000 in Fort Wayne, IN?
Top 10 Zip Codes with the Highest Percentage of Households with Income Above $100,000 in Fort Wayne, IN are:
#1
65.1%
#2
54.9%
#3
37.8%
#4
37.1%
#5
30.6%
#6
29.2%
#7
29.0%
#8
21.5%
#9
20.0%
#10
16.7%
What zip code has the Highest Percentage of Households with Income Above $100,000 in Fort Wayne, IN?
46814 has the Highest Percentage of Households with Income Above $100,000 in Fort Wayne, IN with 65.1%.
What is the Percentage of Households with Income Above $100,000 in Fort Wayne, IN?
Percentage of Households with Income Above $100,000 in Fort Wayne is 23.5%.
What is the Percentage of Households with Income Above $100,000 in Indiana?
Percentage of Households with Income Above $100,000 in Indiana is 30.7%.
What is the Percentage of Households with Income Above $100,000 in the United States?
Percentage of Households with Income Above $100,000 in the United States is 37.3%.