Zip Codes with the Highest Percentage of Households with Income Above $100,000 in Marion, IN
RELATED REPORTS & OPTIONS
Household Income | $100k+
Marion
Compare Zip Codes
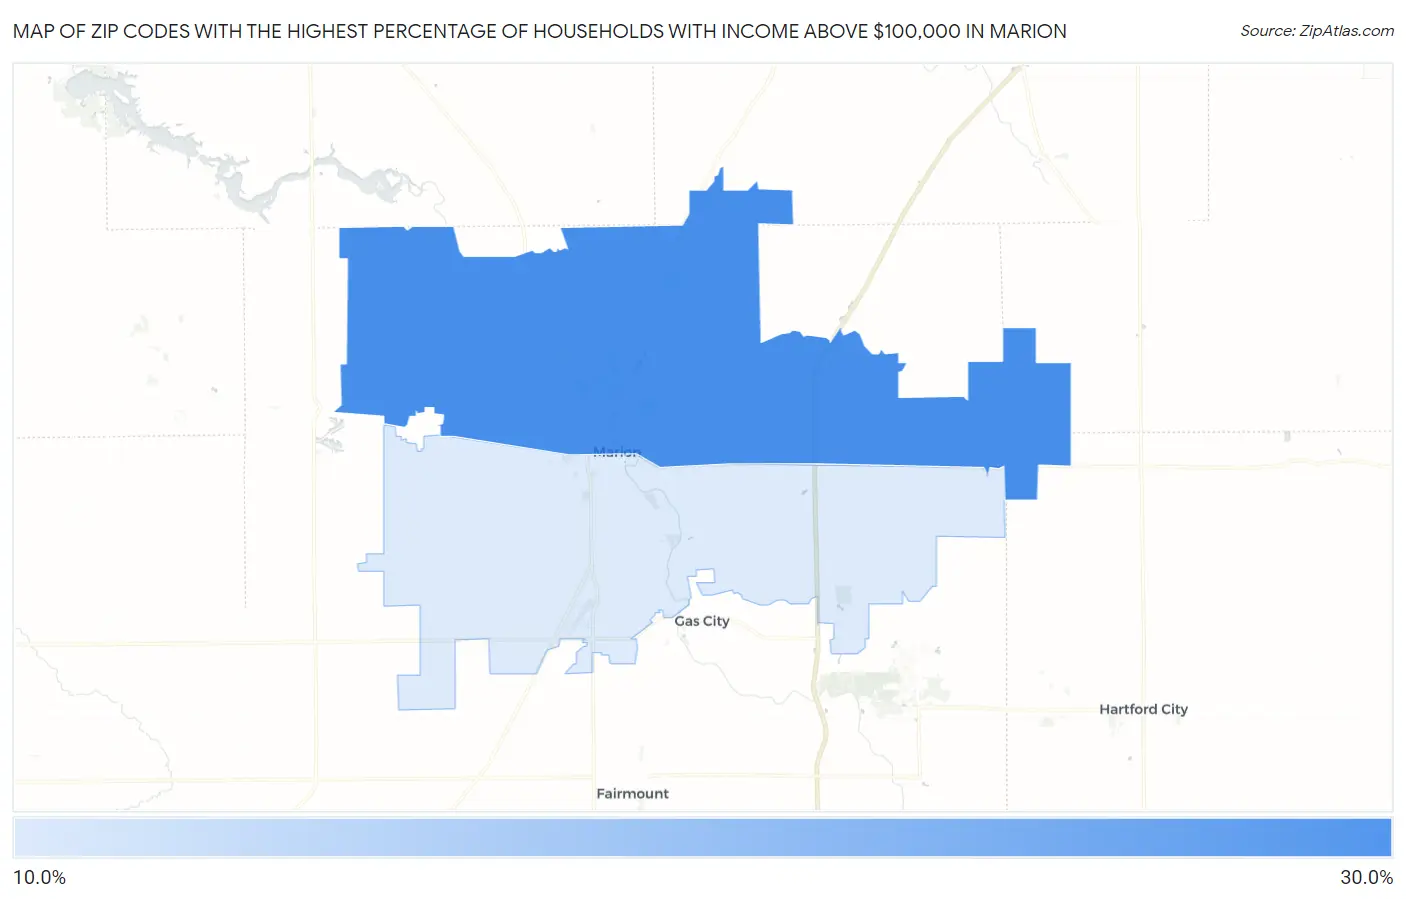
Map of Zip Codes with the Highest Percentage of Households with Income Above $100,000 in Marion
17.2%
25.4%
Zip Codes with the Highest Percentage of Households with Income Above $100,000 in Marion, IN
| Zip Code | Households with Income > $100k | vs State | vs National | |
| 1. | 46952 | 25.4% | 30.7%(-5.30)#441 | 37.3%(-11.9)#19,395 |
| 2. | 46953 | 17.2% | 30.7%(-13.5)#638 | 37.3%(-20.1)#26,086 |
1
Common Questions
What are the Top Zip Codes with the Highest Percentage of Households with Income Above $100,000 in Marion, IN?
Top Zip Codes with the Highest Percentage of Households with Income Above $100,000 in Marion, IN are:
What zip code has the Highest Percentage of Households with Income Above $100,000 in Marion, IN?
46952 has the Highest Percentage of Households with Income Above $100,000 in Marion, IN with 25.4%.
What is the Percentage of Households with Income Above $100,000 in Marion, IN?
Percentage of Households with Income Above $100,000 in Marion is 18.0%.
What is the Percentage of Households with Income Above $100,000 in Indiana?
Percentage of Households with Income Above $100,000 in Indiana is 30.7%.
What is the Percentage of Households with Income Above $100,000 in the United States?
Percentage of Households with Income Above $100,000 in the United States is 37.3%.