Zip Codes with the Highest Percentage of Population Employed in Arts, Media & Entertainment in Waukegan, IL
RELATED REPORTS & OPTIONS
Arts, Media & Entertainment
Waukegan
Compare Zip Codes
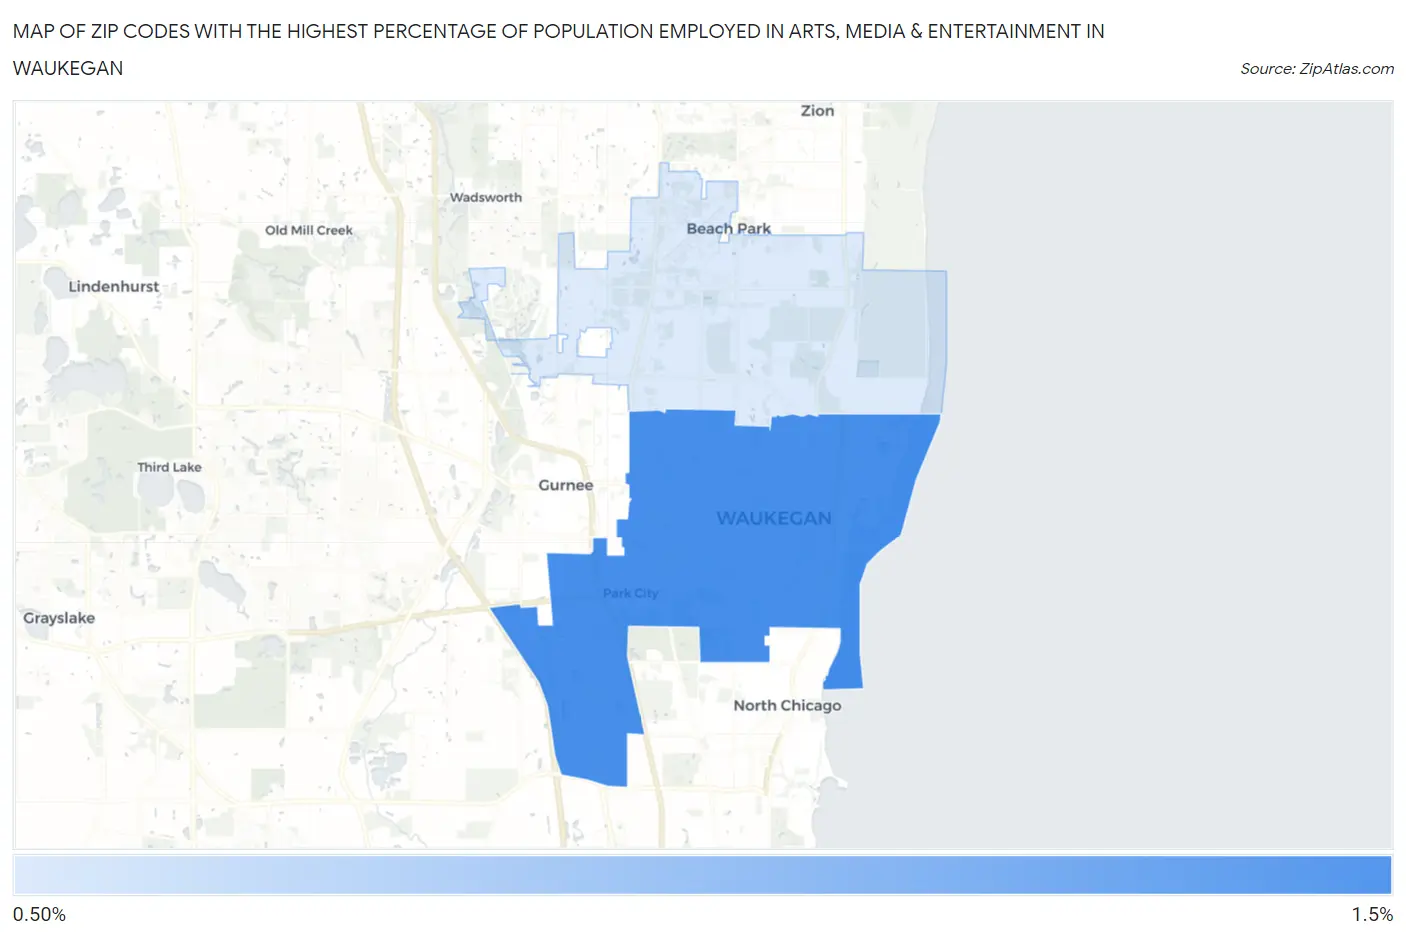
Map of Zip Codes with the Highest Percentage of Population Employed in Arts, Media & Entertainment in Waukegan
0.63%
1.1%
Zip Codes with the Highest Percentage of Population Employed in Arts, Media & Entertainment in Waukegan, IL
| Zip Code | % Employed | vs State | vs National | |
| 1. | 60085 | 1.1% | 1.9%(-0.864)#552 | 2.1%(-1.01)#14,367 |
| 2. | 60087 | 0.63% | 1.9%(-1.28)#717 | 2.1%(-1.43)#17,784 |
1
Common Questions
What are the Top Zip Codes with the Highest Percentage of Population Employed in Arts, Media & Entertainment in Waukegan, IL?
Top Zip Codes with the Highest Percentage of Population Employed in Arts, Media & Entertainment in Waukegan, IL are:
What zip code has the Highest Percentage of Population Employed in Arts, Media & Entertainment in Waukegan, IL?
60085 has the Highest Percentage of Population Employed in Arts, Media & Entertainment in Waukegan, IL with 1.1%.
What is the Percentage of Population Employed in Arts, Media & Entertainment in Waukegan, IL?
Percentage of Population Employed in Arts, Media & Entertainment in Waukegan is 0.96%.
What is the Percentage of Population Employed in Arts, Media & Entertainment in Illinois?
Percentage of Population Employed in Arts, Media & Entertainment in Illinois is 1.9%.
What is the Percentage of Population Employed in Arts, Media & Entertainment in the United States?
Percentage of Population Employed in Arts, Media & Entertainment in the United States is 2.1%.