Zip Codes with the Highest Percentage of Population Employed in Community & Social Service in Waukegan, IL
RELATED REPORTS & OPTIONS
Community & Social Service
Waukegan
Compare Zip Codes
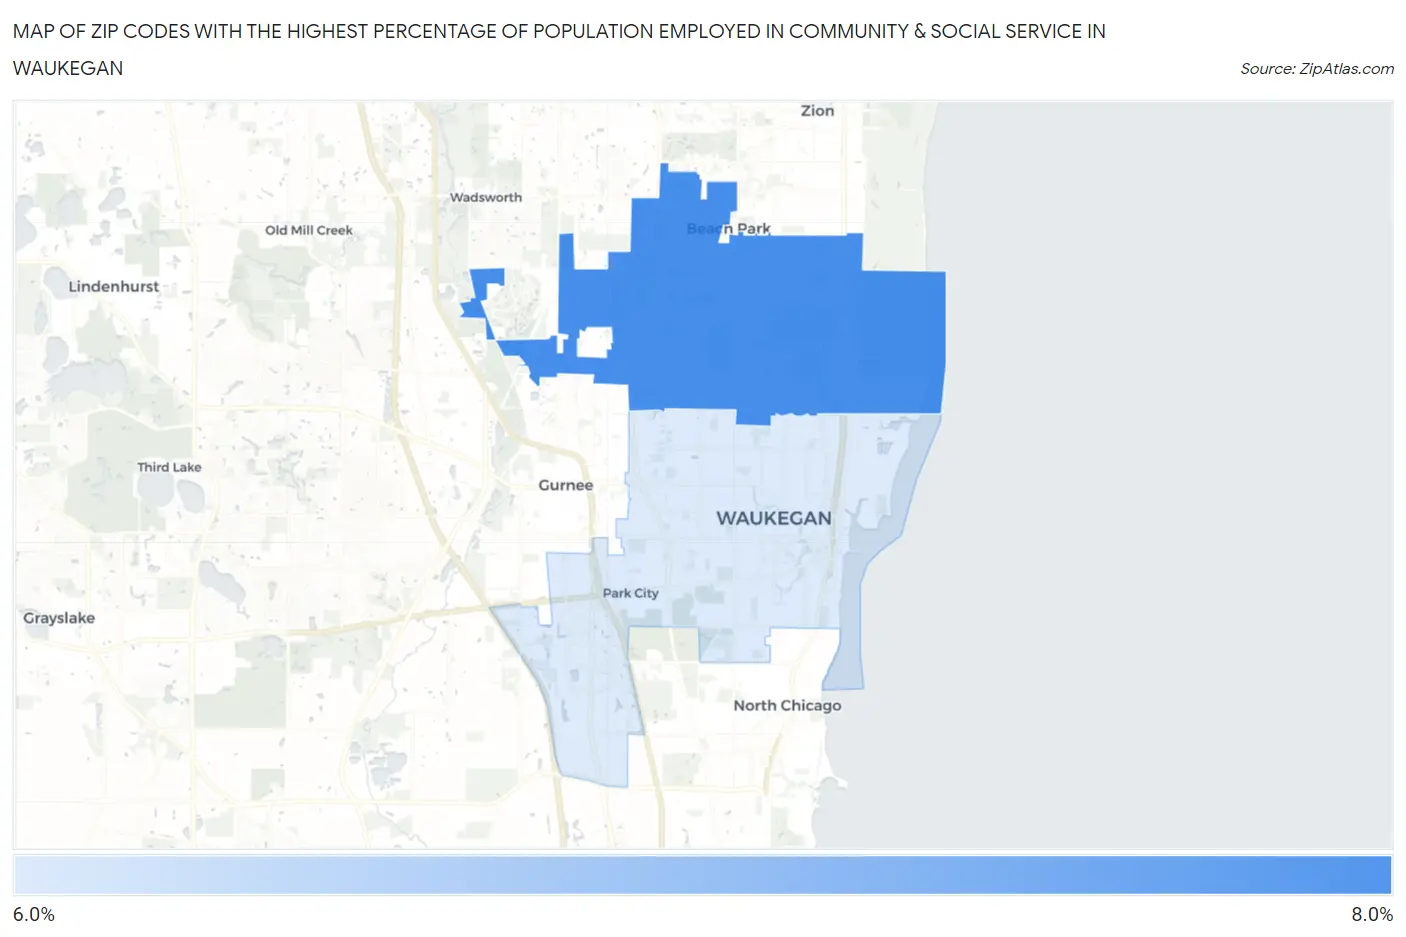
Map of Zip Codes with the Highest Percentage of Population Employed in Community & Social Service in Waukegan
6.9%
7.8%
Zip Codes with the Highest Percentage of Population Employed in Community & Social Service in Waukegan, IL
| Zip Code | % Employed | vs State | vs National | |
| 1. | 60087 | 7.8% | 11.3%(-3.48)#774 | 11.2%(-3.42)#20,151 |
| 2. | 60085 | 6.9% | 11.3%(-4.37)#864 | 11.2%(-4.31)#22,357 |
1
Common Questions
What are the Top Zip Codes with the Highest Percentage of Population Employed in Community & Social Service in Waukegan, IL?
Top Zip Codes with the Highest Percentage of Population Employed in Community & Social Service in Waukegan, IL are:
What zip code has the Highest Percentage of Population Employed in Community & Social Service in Waukegan, IL?
60087 has the Highest Percentage of Population Employed in Community & Social Service in Waukegan, IL with 7.8%.
What is the Percentage of Population Employed in Community & Social Service in Waukegan, IL?
Percentage of Population Employed in Community & Social Service in Waukegan is 7.6%.
What is the Percentage of Population Employed in Community & Social Service in Illinois?
Percentage of Population Employed in Community & Social Service in Illinois is 11.3%.
What is the Percentage of Population Employed in Community & Social Service in the United States?
Percentage of Population Employed in Community & Social Service in the United States is 11.2%.