Zip Codes with the Highest Percentage of Population Employed in Administrative & Support Services in Waukegan, IL
RELATED REPORTS & OPTIONS
Administrative & Support Services
Waukegan
Compare Zip Codes
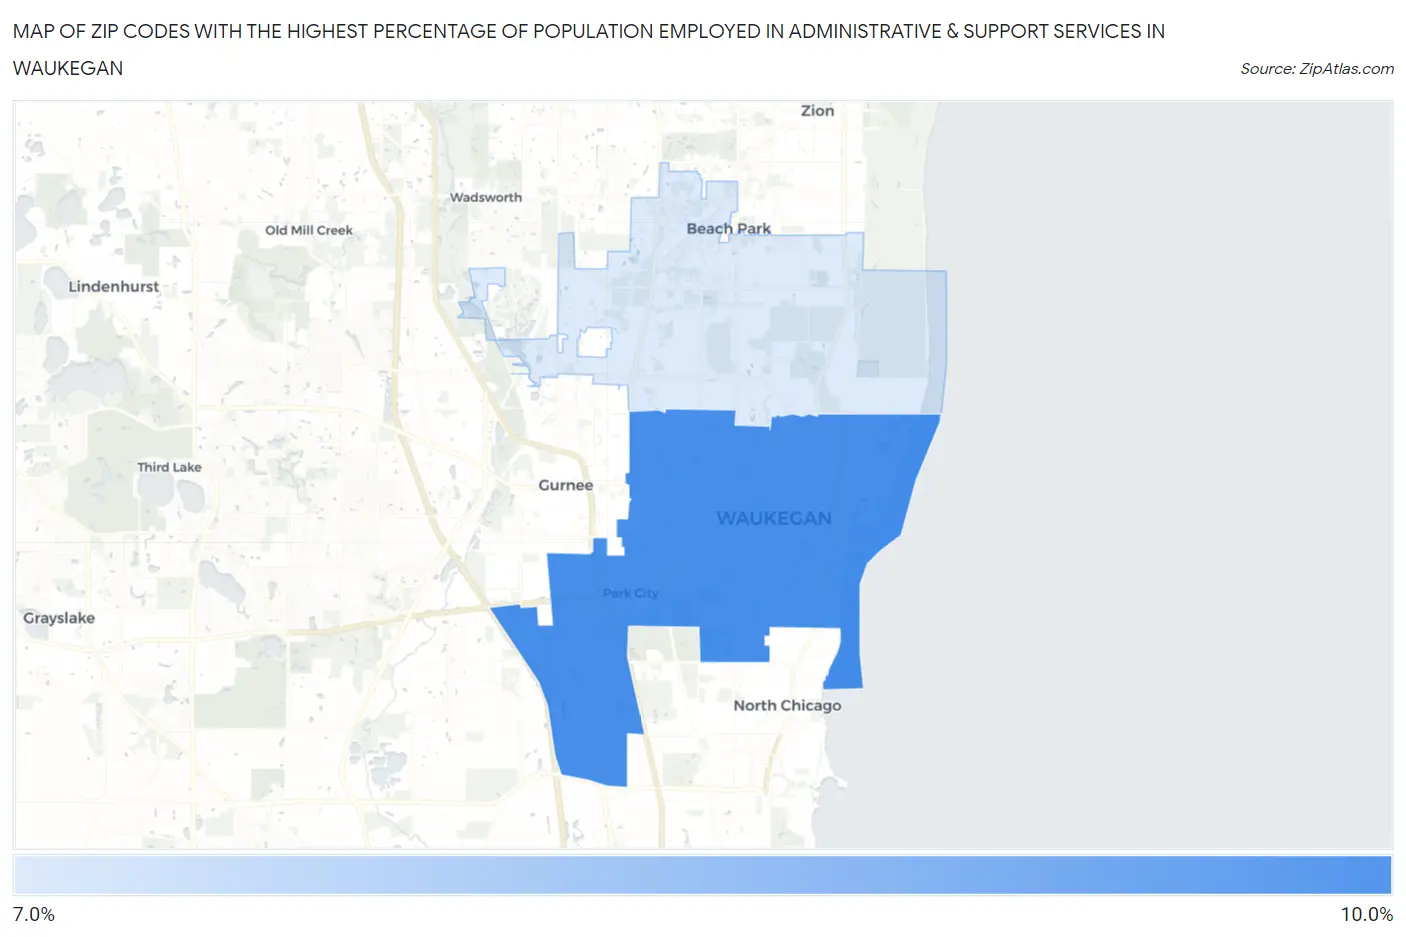
Map of Zip Codes with the Highest Percentage of Population Employed in Administrative & Support Services in Waukegan
7.6%
10.0%
Zip Codes with the Highest Percentage of Population Employed in Administrative & Support Services in Waukegan, IL
| Zip Code | % Employed | vs State | vs National | |
| 1. | 60085 | 10.0% | 4.0%(+5.96)#43 | 4.1%(+5.83)#1,295 |
| 2. | 60087 | 7.6% | 4.0%(+3.59)#97 | 4.1%(+3.46)#2,588 |
1
Common Questions
What are the Top Zip Codes with the Highest Percentage of Population Employed in Administrative & Support Services in Waukegan, IL?
Top Zip Codes with the Highest Percentage of Population Employed in Administrative & Support Services in Waukegan, IL are:
What zip code has the Highest Percentage of Population Employed in Administrative & Support Services in Waukegan, IL?
60085 has the Highest Percentage of Population Employed in Administrative & Support Services in Waukegan, IL with 10.0%.
What is the Percentage of Population Employed in Administrative & Support Services in Waukegan, IL?
Percentage of Population Employed in Administrative & Support Services in Waukegan is 9.2%.
What is the Percentage of Population Employed in Administrative & Support Services in Illinois?
Percentage of Population Employed in Administrative & Support Services in Illinois is 4.0%.
What is the Percentage of Population Employed in Administrative & Support Services in the United States?
Percentage of Population Employed in Administrative & Support Services in the United States is 4.1%.