Zip Codes with the Highest Percentage of Population Employed in Food Preparation & Serving in Iowa City, IA
RELATED REPORTS & OPTIONS
Food Preparation & Serving
Iowa City
Compare Zip Codes
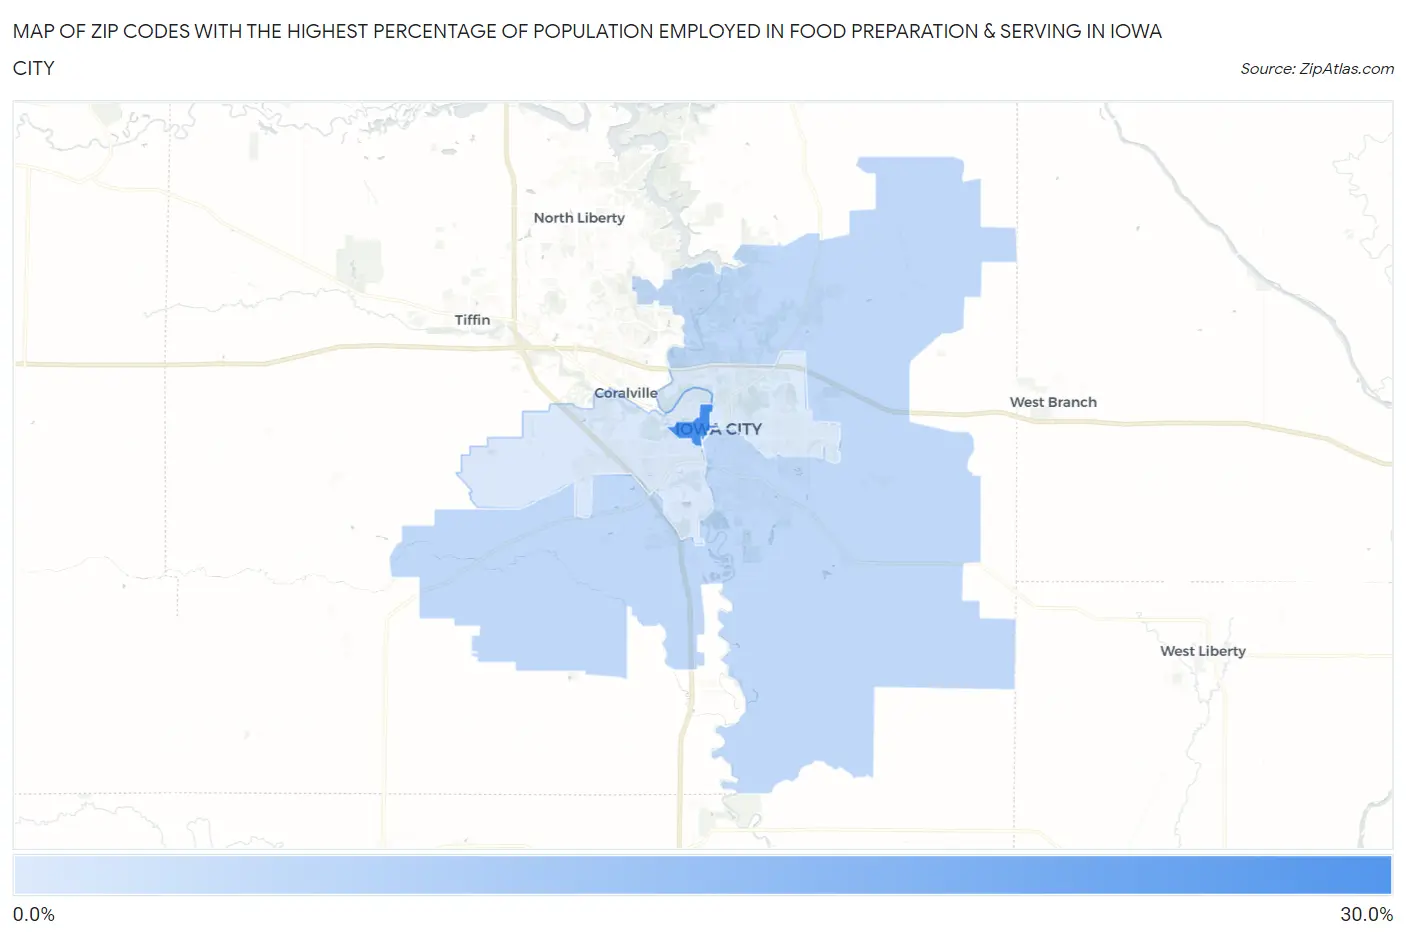
Map of Zip Codes with the Highest Percentage of Population Employed in Food Preparation & Serving in Iowa City
6.4%
27.4%
Zip Codes with the Highest Percentage of Population Employed in Food Preparation & Serving in Iowa City, IA
| Zip Code | % Employed | vs State | vs National | |
| 1. | 52242 | 27.4% | 5.1%(+22.3)#3 | 5.3%(+22.1)#254 |
| 2. | 52240 | 10.3% | 5.1%(+5.23)#52 | 5.3%(+5.05)#2,401 |
| 3. | 52246 | 6.6% | 5.1%(+1.49)#157 | 5.3%(+1.32)#7,590 |
| 4. | 52245 | 6.4% | 5.1%(+1.32)#167 | 5.3%(+1.15)#8,050 |
1
Common Questions
What are the Top 3 Zip Codes with the Highest Percentage of Population Employed in Food Preparation & Serving in Iowa City, IA?
Top 3 Zip Codes with the Highest Percentage of Population Employed in Food Preparation & Serving in Iowa City, IA are:
What zip code has the Highest Percentage of Population Employed in Food Preparation & Serving in Iowa City, IA?
52242 has the Highest Percentage of Population Employed in Food Preparation & Serving in Iowa City, IA with 27.4%.
What is the Percentage of Population Employed in Food Preparation & Serving in Iowa City, IA?
Percentage of Population Employed in Food Preparation & Serving in Iowa City is 9.4%.
What is the Percentage of Population Employed in Food Preparation & Serving in Iowa?
Percentage of Population Employed in Food Preparation & Serving in Iowa is 5.1%.
What is the Percentage of Population Employed in Food Preparation & Serving in the United States?
Percentage of Population Employed in Food Preparation & Serving in the United States is 5.3%.