Zip Codes with the Highest Percentage of Population Employed in Health Diagnosing & Treating in Iowa City, IA
RELATED REPORTS & OPTIONS
Health Diagnosing & Treating
Iowa City
Compare Zip Codes
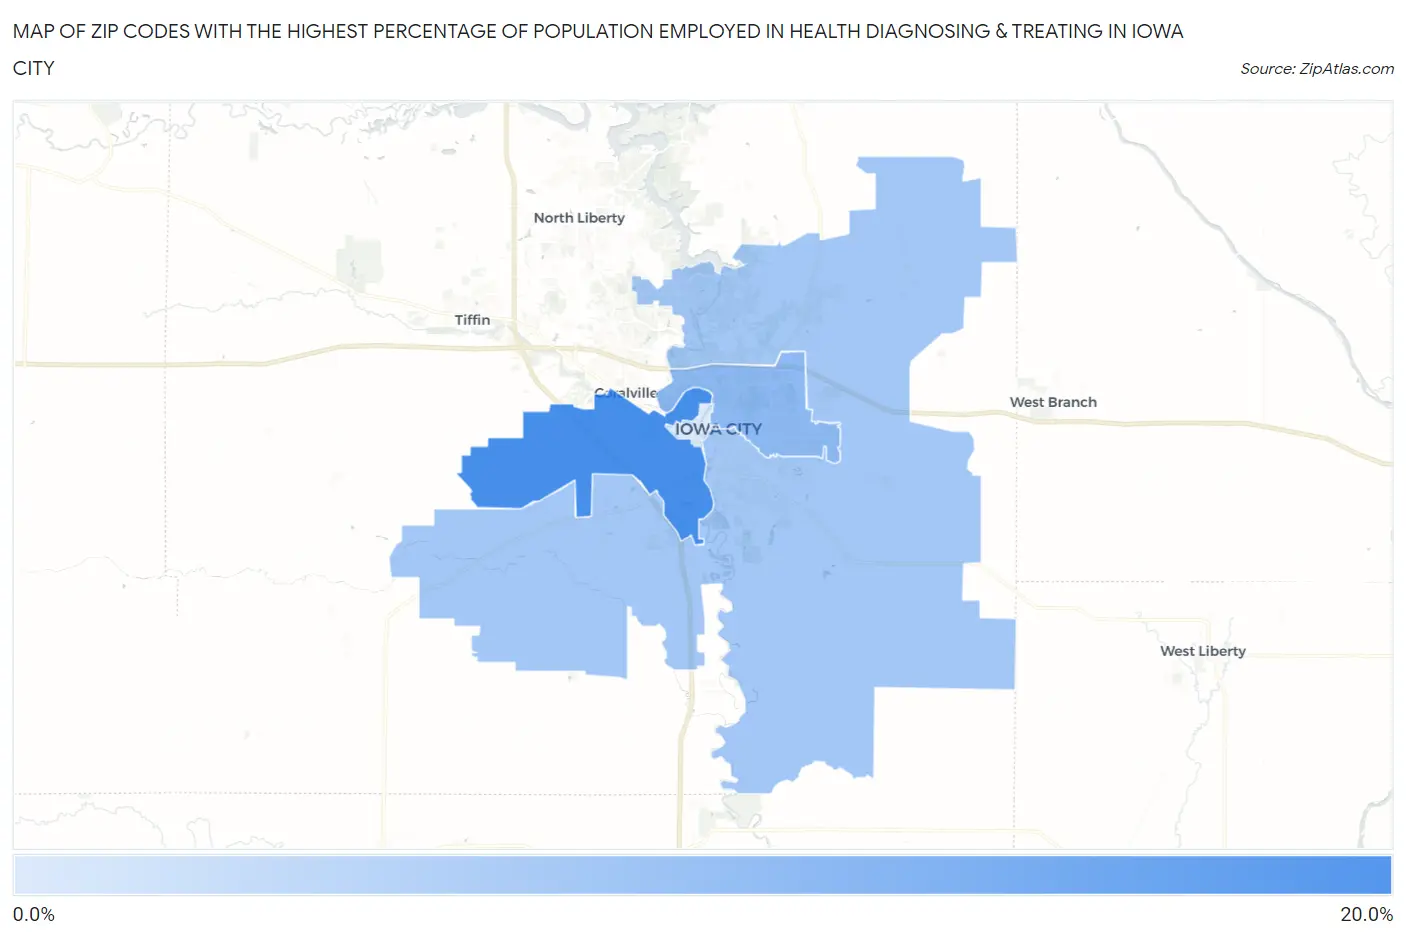
Map of Zip Codes with the Highest Percentage of Population Employed in Health Diagnosing & Treating in Iowa City
2.5%
16.9%
Zip Codes with the Highest Percentage of Population Employed in Health Diagnosing & Treating in Iowa City, IA
| Zip Code | % Employed | vs State | vs National | |
| 1. | 52246 | 16.9% | 6.2%(+10.7)#21 | 6.2%(+10.6)#829 |
| 2. | 52245 | 9.8% | 6.2%(+3.61)#111 | 6.2%(+3.53)#4,148 |
| 3. | 52240 | 7.7% | 6.2%(+1.54)#232 | 6.2%(+1.46)#8,234 |
| 4. | 52242 | 2.5% | 6.2%(-3.69)#742 | 6.2%(-3.77)#25,582 |
1
Common Questions
What are the Top 3 Zip Codes with the Highest Percentage of Population Employed in Health Diagnosing & Treating in Iowa City, IA?
Top 3 Zip Codes with the Highest Percentage of Population Employed in Health Diagnosing & Treating in Iowa City, IA are:
What zip code has the Highest Percentage of Population Employed in Health Diagnosing & Treating in Iowa City, IA?
52246 has the Highest Percentage of Population Employed in Health Diagnosing & Treating in Iowa City, IA with 16.9%.
What is the Percentage of Population Employed in Health Diagnosing & Treating in Iowa City, IA?
Percentage of Population Employed in Health Diagnosing & Treating in Iowa City is 10.2%.
What is the Percentage of Population Employed in Health Diagnosing & Treating in Iowa?
Percentage of Population Employed in Health Diagnosing & Treating in Iowa is 6.2%.
What is the Percentage of Population Employed in Health Diagnosing & Treating in the United States?
Percentage of Population Employed in Health Diagnosing & Treating in the United States is 6.2%.