Zip Codes with the Highest Percentage of Population Employed in Office & Administration in Iowa City, IA
RELATED REPORTS & OPTIONS
Office & Administration
Iowa City
Compare Zip Codes
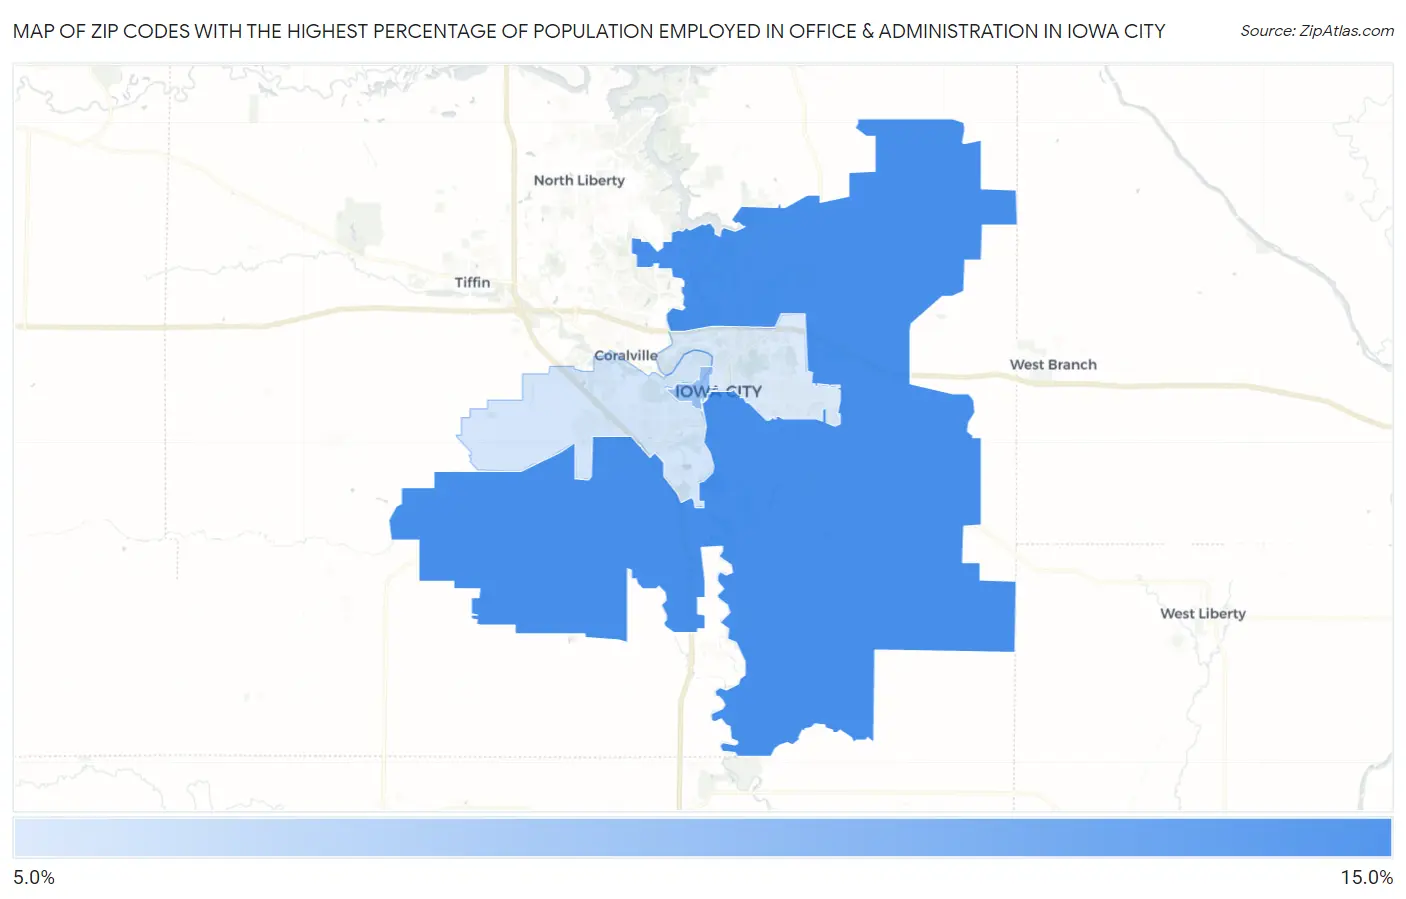
Map of Zip Codes with the Highest Percentage of Population Employed in Office & Administration in Iowa City
7.7%
10.0%
Zip Codes with the Highest Percentage of Population Employed in Office & Administration in Iowa City, IA
| Zip Code | % Employed | vs State | vs National | |
| 1. | 52240 | 10.0% | 10.6%(-0.628)#473 | 10.9%(-0.848)#17,098 |
| 2. | 52242 | 8.8% | 10.6%(-1.81)#575 | 10.9%(-2.03)#20,748 |
| 3. | 52246 | 7.9% | 10.6%(-2.77)#664 | 10.9%(-2.99)#23,330 |
| 4. | 52245 | 7.7% | 10.6%(-2.90)#672 | 10.9%(-3.12)#23,619 |
1
Common Questions
What are the Top 3 Zip Codes with the Highest Percentage of Population Employed in Office & Administration in Iowa City, IA?
Top 3 Zip Codes with the Highest Percentage of Population Employed in Office & Administration in Iowa City, IA are:
What zip code has the Highest Percentage of Population Employed in Office & Administration in Iowa City, IA?
52240 has the Highest Percentage of Population Employed in Office & Administration in Iowa City, IA with 10.0%.
What is the Percentage of Population Employed in Office & Administration in Iowa City, IA?
Percentage of Population Employed in Office & Administration in Iowa City is 8.9%.
What is the Percentage of Population Employed in Office & Administration in Iowa?
Percentage of Population Employed in Office & Administration in Iowa is 10.6%.
What is the Percentage of Population Employed in Office & Administration in the United States?
Percentage of Population Employed in Office & Administration in the United States is 10.9%.