Zip Codes with the Highest Percentage of Households With One or more Vehicles in Iowa City, IA
RELATED REPORTS & OPTIONS
Households with 1 or more Cars
Iowa City
Compare Zip Codes
Map of Zip Codes with the Highest Percentage of Households With One or more Vehicles in Iowa City
82.9%
93.1%
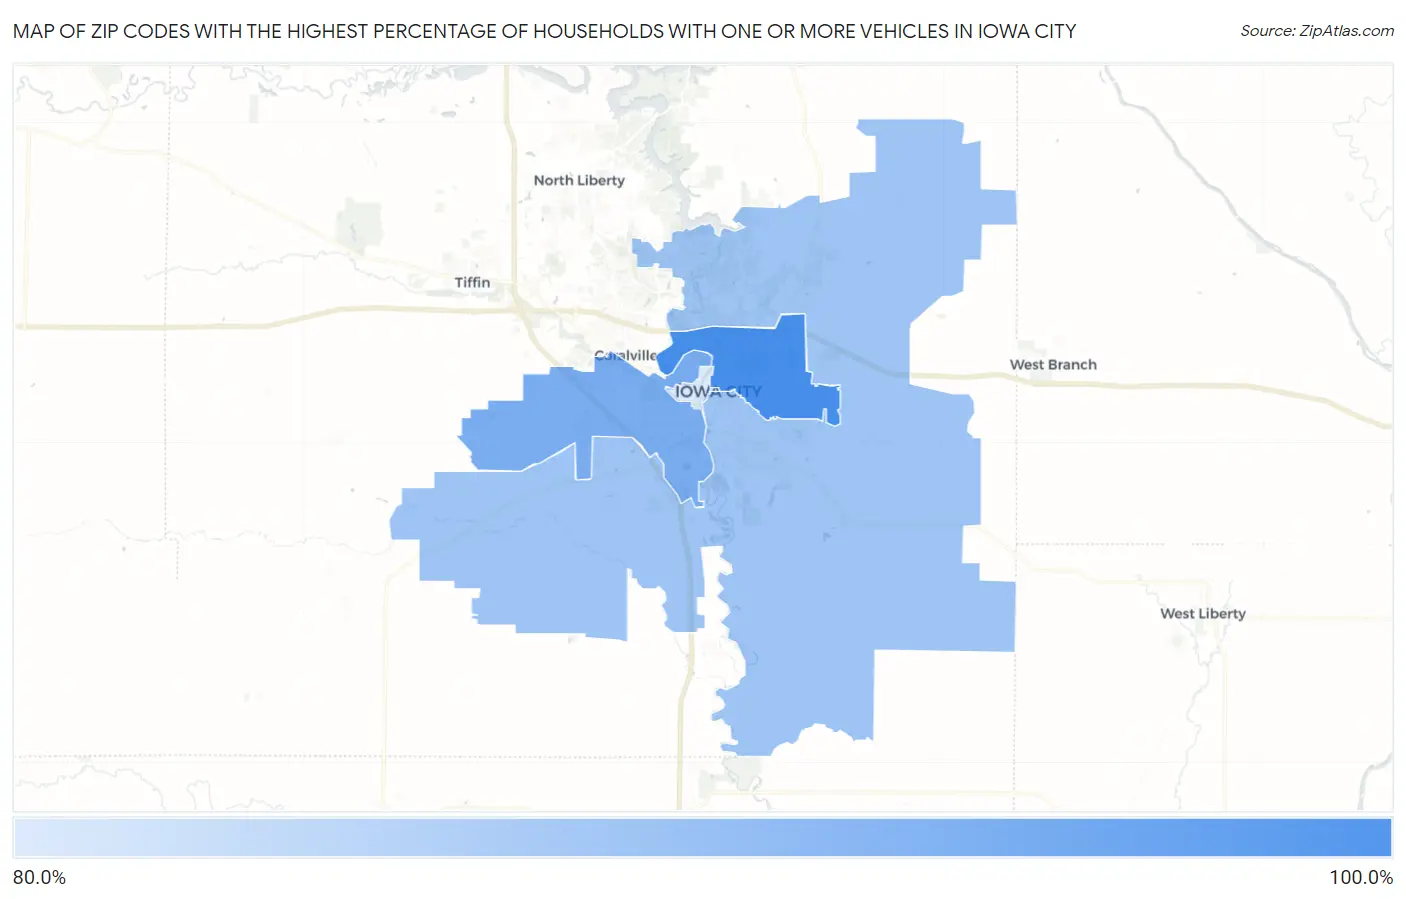
Zip Codes with the Highest Percentage of Households With One or more Vehicles in Iowa City, IA
| Zip Code | Housholds With 1+ Cars | vs State | vs National | |
| 1. | 52245 | 93.1% | 94.4%(-1.30)#821 | 91.7%(+1.40)#24,015 |
| 2. | 52246 | 89.6% | 94.4%(-4.80)#919 | 91.7%(-2.10)#28,228 |
| 3. | 52240 | 87.1% | 94.4%(-7.30)#940 | 91.7%(-4.60)#29,657 |
| 4. | 52242 | 82.9% | 94.4%(-11.5)#953 | 91.7%(-8.80)#30,879 |
1
Common Questions
What are the Top 3 Zip Codes with the Highest Percentage of Households With One or more Vehicles in Iowa City, IA?
Top 3 Zip Codes with the Highest Percentage of Households With One or more Vehicles in Iowa City, IA are:
What zip code has the Highest Percentage of Households With One or more Vehicles in Iowa City, IA?
52245 has the Highest Percentage of Households With One or more Vehicles in Iowa City, IA with 93.1%.
What is the Percentage of Households With One or more Vehicles in Iowa City, IA?
Percentage of Households With One or more Vehicles in Iowa City is 88.5%.
What is the Percentage of Households With One or more Vehicles in Iowa?
Percentage of Households With One or more Vehicles in Iowa is 94.4%.
What is the Percentage of Households With One or more Vehicles in the United States?
Percentage of Households With One or more Vehicles in the United States is 91.7%.