Zip Codes with the Highest Percentage of Population Employed in Security & Protection in Iowa City, IA
RELATED REPORTS & OPTIONS
Security & Protection
Iowa City
Compare Zip Codes
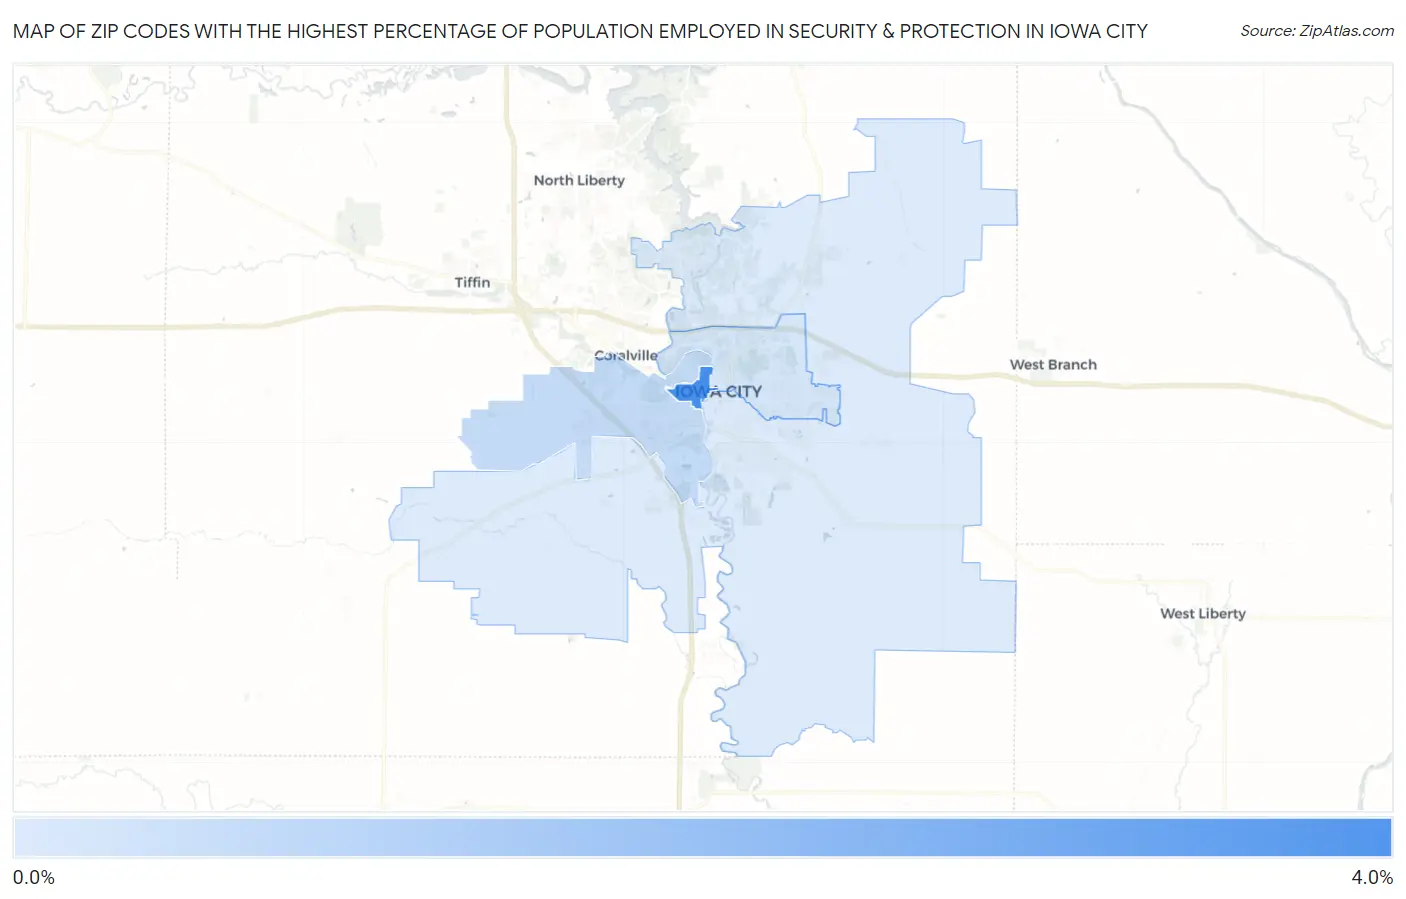
Map of Zip Codes with the Highest Percentage of Population Employed in Security & Protection in Iowa City
0.45%
4.0%
Zip Codes with the Highest Percentage of Population Employed in Security & Protection in Iowa City, IA
| Zip Code | % Employed | vs State | vs National | |
| 1. | 52242 | 4.0% | 1.4%(+2.58)#44 | 2.1%(+1.81)#4,580 |
| 2. | 52246 | 1.0% | 1.4%(-0.361)#382 | 2.1%(-1.14)#19,950 |
| 3. | 52245 | 0.59% | 1.4%(-0.779)#487 | 2.1%(-1.55)#22,698 |
| 4. | 52240 | 0.45% | 1.4%(-0.925)#526 | 2.1%(-1.70)#23,507 |
1
Common Questions
What are the Top 3 Zip Codes with the Highest Percentage of Population Employed in Security & Protection in Iowa City, IA?
Top 3 Zip Codes with the Highest Percentage of Population Employed in Security & Protection in Iowa City, IA are:
What zip code has the Highest Percentage of Population Employed in Security & Protection in Iowa City, IA?
52242 has the Highest Percentage of Population Employed in Security & Protection in Iowa City, IA with 4.0%.
What is the Percentage of Population Employed in Security & Protection in Iowa City, IA?
Percentage of Population Employed in Security & Protection in Iowa City is 0.73%.
What is the Percentage of Population Employed in Security & Protection in Iowa?
Percentage of Population Employed in Security & Protection in Iowa is 1.4%.
What is the Percentage of Population Employed in Security & Protection in the United States?
Percentage of Population Employed in Security & Protection in the United States is 2.1%.