Zip Codes with the Highest Percentage of Population Employed in Community & Social Service in Savannah, GA

RELATED REPORTS & OPTIONS

Community & Social Service
Population
Families and Households
Female Fertility
Female Fertility (Unmarried)
Race (Community Size)
Race (Percentage)
Ancestry (Community Size)
AfricanAlsatianAmericanApacheArabArgentineanArmenianAustralianAustrianBahamianBarbadianBasqueBelgianBhutaneseBlackfeetBolivianBrazilianBritishBritish West IndianBurmeseCajunCanadianCentral AmericanCentral American IndianCherokeeChickasawChileanChoctawColombianCosta RicanCreekCroatianCubanCzechCzechoslovakianDanishDominicanDutchEastern EuropeanEcuadorianEgyptianEnglishEstonianEthiopianEuropeanFilipinoFinnishFrenchFrench CanadianGermanGhanaianGreekGuamanian / ChamorroGuatemalanGuyaneseHaitianHonduranHungarianIndian (Asian)IranianIrishIroquoisIsraeliItalianJamaicanJapaneseKenyanKoreanLaotianLatvianLebaneseLithuanianMalaysianMexicanMexican American IndianMoroccanNative HawaiianNavajoNicaraguanNigerianNorthern EuropeanNorwegianPakistaniPalestinianPanamanianPennsylvania GermanPeruvianPolishPortuguesePuerto RicanRomanianRussianSalvadoranScandinavianScotch-IrishScottishSerbianSlavicSlovakSouth AfricanSouth AmericanSouth American IndianSpaniardSpanishSri LankanSubsaharan AfricanSwedishSwissSyrianThaiTrinidadian and TobagonianUkrainianVenezuelanWelshWest IndianYugoslavianZimbabwean
Ancestry (Percentage)
AfricanAlsatianAmericanApacheArabArgentineanArmenianAustralianAustrianBahamianBarbadianBasqueBelgianBhutaneseBlackfeetBolivianBrazilianBritishBritish West IndianBurmeseCajunCanadianCentral AmericanCentral American IndianCherokeeChickasawChileanChoctawColombianCosta RicanCreekCroatianCubanCzechCzechoslovakianDanishDominicanDutchEastern EuropeanEcuadorianEgyptianEnglishEstonianEthiopianEuropeanFilipinoFinnishFrenchFrench CanadianGermanGhanaianGreekGuamanian / ChamorroGuatemalanGuyaneseHaitianHonduranHungarianIndian (Asian)IranianIrishIroquoisIsraeliItalianJamaicanJapaneseKenyanKoreanLaotianLatvianLebaneseLithuanianMalaysianMexicanMexican American IndianMoroccanNative HawaiianNavajoNicaraguanNigerianNorthern EuropeanNorwegianPakistaniPalestinianPanamanianPennsylvania GermanPeruvianPolishPortuguesePuerto RicanRomanianRussianSalvadoranScandinavianScotch-IrishScottishSerbianSlavicSlovakSouth AfricanSouth AmericanSouth American IndianSpaniardSpanishSri LankanSubsaharan AfricanSwedishSwissSyrianThaiTrinidadian and TobagonianUkrainianVenezuelanWelshWest IndianYugoslavianZimbabwean
Immigrant Origin (Total)
Immigrant Origin (Percentage)
Income
Income (Families)
Income (Households)
Poverty
Poverty (Families)
Unemployment
Employment Occupations
Employment Industries
Employer Class
Commute Time
Commute Means
School Enrollment
Education by Degree Field
Occupancy
Finances
Physical Characteristics
Savannah
Compare Zip Codes
Comparison Subject

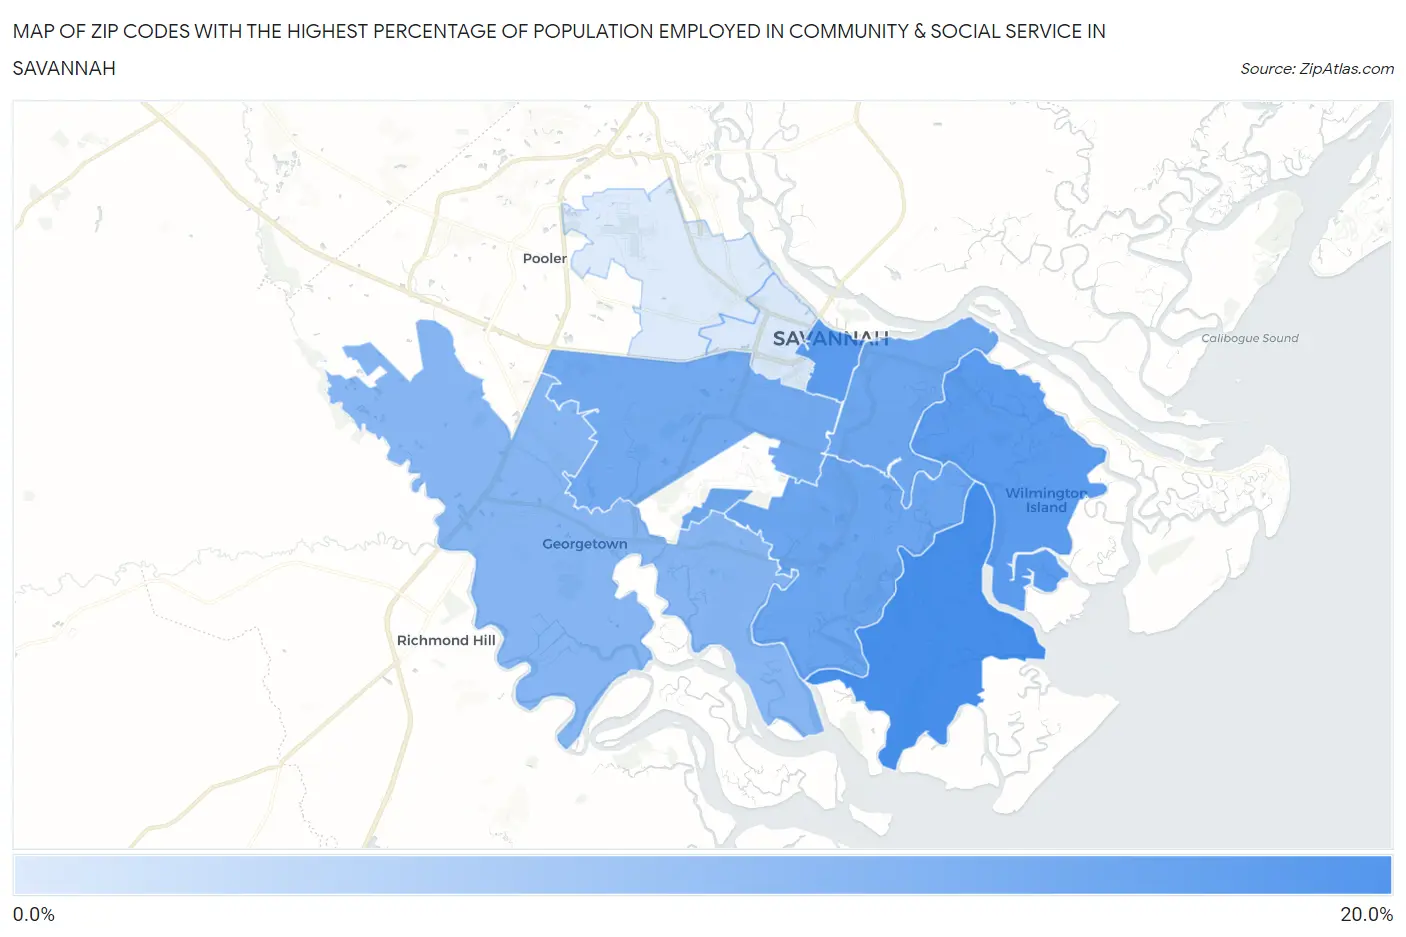
Map of Zip Codes with the Highest Percentage of Population Employed in Community & Social Service in Savannah

0.0%
20.0%
Zip Codes with the Highest Percentage of Population Employed in Community & Social Service  in Savannah Map

Zip Codes with the Highest Percentage of Population Employed in Community & Social Service in Savannah, GA

Zip Code % Employed vs State vs National
1.3141115.5%11.0%(+4.50)#8011.2%(+4.24)#4,553
2.3141014.2%11.0%(+3.25)#10111.2%(+2.99)#5,830
3.3140114.1%11.0%(+3.19)#10311.2%(+2.93)#5,901
4.3140613.2%11.0%(+2.22)#13511.2%(+1.96)#7,285
5.3140412.9%11.0%(+1.98)#14811.2%(+1.72)#7,664
6.3140512.7%11.0%(+1.75)#15511.2%(+1.49)#8,066
7.3141911.5%11.0%(+0.534)#23311.2%(+0.273)#10,483
8.314156.5%11.0%(-4.49)#55111.2%(-4.76)#23,364
9.314086.2%11.0%(-4.75)#56111.2%(-5.01)#23,938

Common Questions

What are the Top 5 Zip Codes with the Highest Percentage of Population Employed in Community & Social Service in Savannah, GA?
Top 5 Zip Codes with the Highest Percentage of Population Employed in Community & Social Service in Savannah, GA are:
#1
15.5%
#2
14.2%
#3
14.1%
#4
13.2%
#5
12.9%
What zip code has the Highest Percentage of Population Employed in Community & Social Service in Savannah, GA?
31411 has the Highest Percentage of Population Employed in Community & Social Service in Savannah, GA with 15.5%.
What is the Percentage of Population Employed in Community & Social Service in Savannah, GA?
Percentage of Population Employed in Community & Social Service in Savannah is 11.6%.
What is the Percentage of Population Employed in Community & Social Service in Georgia?
Percentage of Population Employed in Community & Social Service in Georgia is 11.0%.
What is the Percentage of Population Employed in Community & Social Service in the United States?
Percentage of Population Employed in Community & Social Service in the United States is 11.2%.