Bradenton Beach, FL Map & Demographics
Bradenton Beach Map
Bradenton Beach Overview
$64,896
PER CAPITA INCOME
$72,019
AVG FAMILY INCOME
$66,667
AVG HOUSEHOLD INCOME
40.2%
WAGE / INCOME GAP [ % ]
59.8¢/ $1
WAGE / INCOME GAP [ $ ]
0.50
INEQUALITY / GINI INDEX
737
TOTAL POPULATION
319
MALE POPULATION
418
FEMALE POPULATION
76.32
MALES / 100 FEMALES
131.03
FEMALES / 100 MALES
70.0
MEDIAN AGE
2.1
AVG FAMILY SIZE
1.7
AVG HOUSEHOLD SIZE
275
LABOR FORCE [ PEOPLE ]
39.0%
PERCENT IN LABOR FORCE
2.5%
UNEMPLOYMENT RATE
Bradenton Beach Zip Codes
Bradenton Beach Area Codes
Income in Bradenton Beach
Income Overview in Bradenton Beach
Per Capita Income in Bradenton Beach is $64,896, while median incomes of families and households are $72,019 and $66,667 respectively.
| Characteristic | Number | Measure |
| Per Capita Income | 737 | $64,896 |
| Median Family Income | 221 | $72,019 |
| Mean Family Income | 221 | $113,312 |
| Median Household Income | 444 | $66,667 |
| Mean Household Income | 444 | $107,403 |
| Income Deficit | 221 | $0 |
| Wage / Income Gap (%) | 737 | 40.16% |
| Wage / Income Gap ($) | 737 | 59.84¢ per $1 |
| Gini / Inequality Index | 737 | 0.50 |
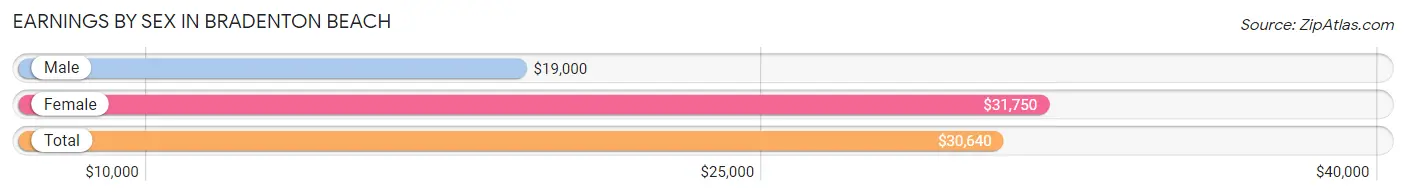
Earnings by Sex in Bradenton Beach
Average Earnings in Bradenton Beach are $30,640, $19,000 for men and $31,750 for women, a difference of 40.2%.
| Sex | Number | Average Earnings |
| Male | 136 (47.2%) | $19,000 |
| Female | 152 (52.8%) | $31,750 |
| Total | 288 (100.0%) | $30,640 |
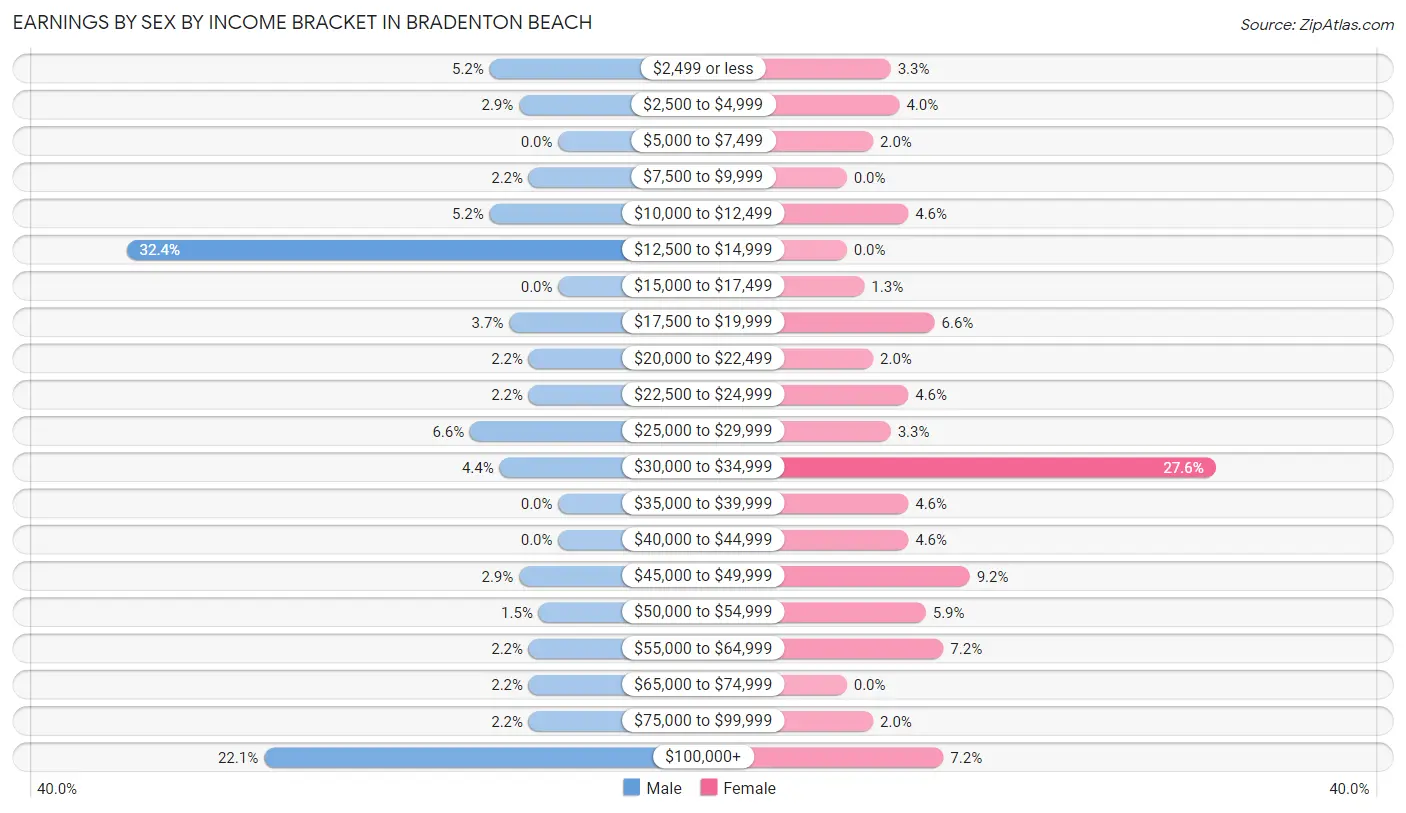
Earnings by Sex by Income Bracket in Bradenton Beach
The most common earnings brackets in Bradenton Beach are $12,500 to $14,999 for men (44 | 32.4%) and $30,000 to $34,999 for women (42 | 27.6%).
| Income | Male | Female |
| $2,499 or less | 7 (5.1%) | 5 (3.3%) |
| $2,500 to $4,999 | 4 (2.9%) | 6 (4.0%) |
| $5,000 to $7,499 | 0 (0.0%) | 3 (2.0%) |
| $7,500 to $9,999 | 3 (2.2%) | 0 (0.0%) |
| $10,000 to $12,499 | 7 (5.1%) | 7 (4.6%) |
| $12,500 to $14,999 | 44 (32.4%) | 0 (0.0%) |
| $15,000 to $17,499 | 0 (0.0%) | 2 (1.3%) |
| $17,500 to $19,999 | 5 (3.7%) | 10 (6.6%) |
| $20,000 to $22,499 | 3 (2.2%) | 3 (2.0%) |
| $22,500 to $24,999 | 3 (2.2%) | 7 (4.6%) |
| $25,000 to $29,999 | 9 (6.6%) | 5 (3.3%) |
| $30,000 to $34,999 | 6 (4.4%) | 42 (27.6%) |
| $35,000 to $39,999 | 0 (0.0%) | 7 (4.6%) |
| $40,000 to $44,999 | 0 (0.0%) | 7 (4.6%) |
| $45,000 to $49,999 | 4 (2.9%) | 14 (9.2%) |
| $50,000 to $54,999 | 2 (1.5%) | 9 (5.9%) |
| $55,000 to $64,999 | 3 (2.2%) | 11 (7.2%) |
| $65,000 to $74,999 | 3 (2.2%) | 0 (0.0%) |
| $75,000 to $99,999 | 3 (2.2%) | 3 (2.0%) |
| $100,000+ | 30 (22.1%) | 11 (7.2%) |
| Total | 136 (100.0%) | 152 (100.0%) |
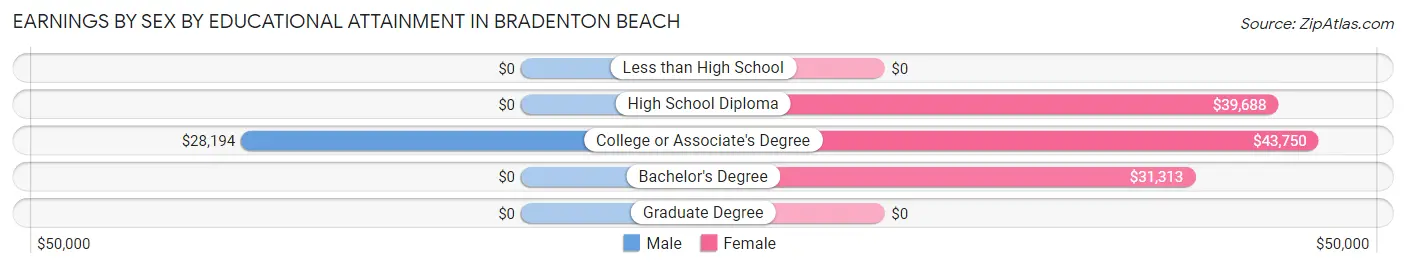
Earnings by Sex by Educational Attainment in Bradenton Beach
| Educational Attainment | Male Income | Female Income |
| Less than High School | - | - |
| High School Diploma | - | - |
| College or Associate's Degree | $28,194 | $43,750 |
| Bachelor's Degree | - | - |
| Graduate Degree | - | - |
| Total | - | - |
Family Income in Bradenton Beach
Family Income Brackets in Bradenton Beach
According to the Bradenton Beach family income data, there are 59 families falling into the $35,000 to $49,999 income range, which is the most common income bracket and makes up 26.7% of all families. Conversely, the $10,000 to $14,999 income bracket is the least frequent group with only 4 families (1.8%) belonging to this category.
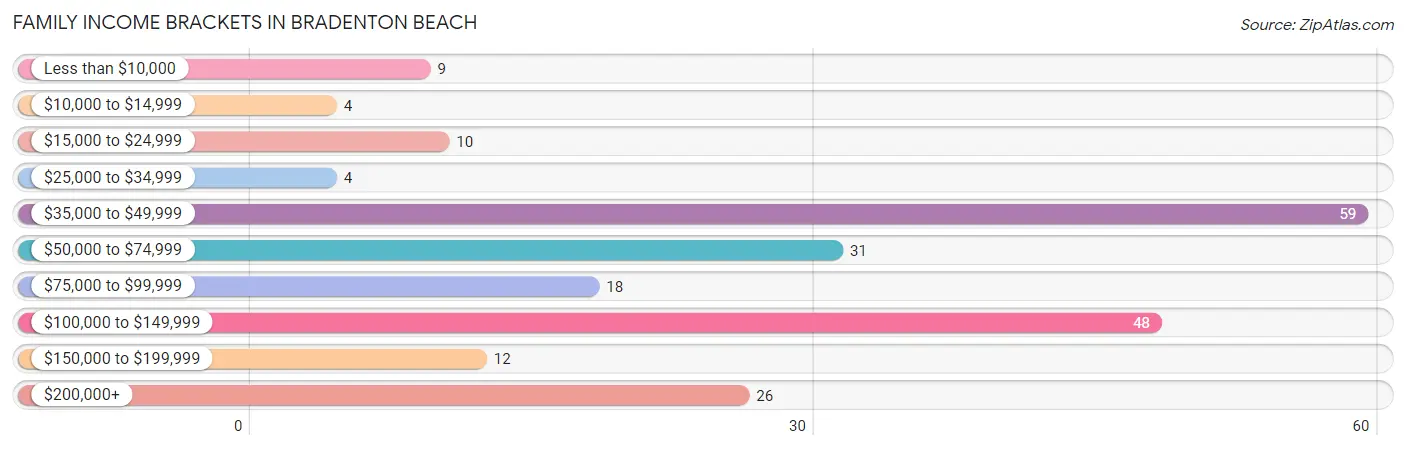
| Income Bracket | # Families | % Families |
| Less than $10,000 | 9 | 4.1% |
| $10,000 to $14,999 | 4 | 1.8% |
| $15,000 to $24,999 | 10 | 4.5% |
| $25,000 to $34,999 | 4 | 1.8% |
| $35,000 to $49,999 | 59 | 26.7% |
| $50,000 to $74,999 | 31 | 14.0% |
| $75,000 to $99,999 | 18 | 8.1% |
| $100,000 to $149,999 | 48 | 21.7% |
| $150,000 to $199,999 | 12 | 5.4% |
| $200,000+ | 26 | 11.8% |
Family Income by Famaliy Size in Bradenton Beach
3-person families (26 | 11.8%) account for the highest median family income in Bradenton Beach with $75,833 per family, while 2-person families (195 | 88.2%) have the highest median income of $35,852 per family member.
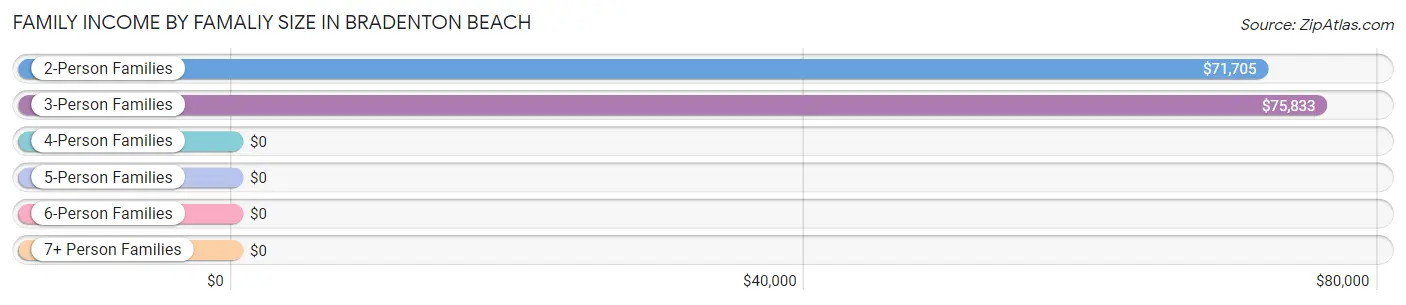
| Income Bracket | # Families | Median Income |
| 2-Person Families | 195 (88.2%) | $71,705 |
| 3-Person Families | 26 (11.8%) | $75,833 |
| 4-Person Families | 0 (0.0%) | $0 |
| 5-Person Families | 0 (0.0%) | $0 |
| 6-Person Families | 0 (0.0%) | $0 |
| 7+ Person Families | 0 (0.0%) | $0 |
| Total | 221 (100.0%) | $72,019 |
Family Income by Number of Earners in Bradenton Beach
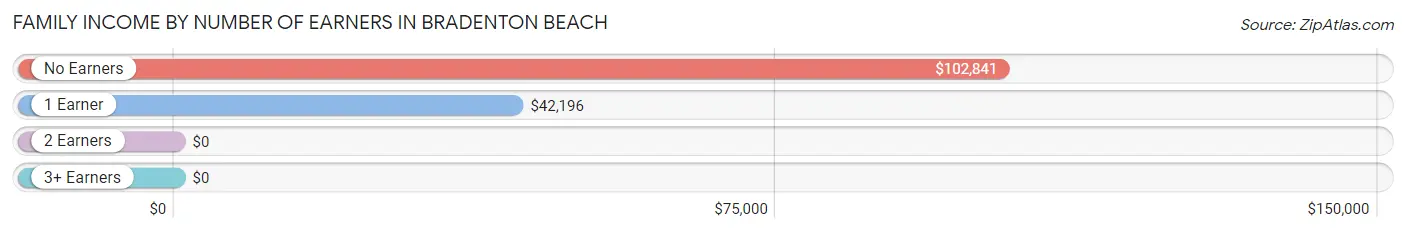
| Number of Earners | # Families | Median Income |
| No Earners | 99 (44.8%) | $102,841 |
| 1 Earner | 93 (42.1%) | $42,196 |
| 2 Earners | 27 (12.2%) | $0 |
| 3+ Earners | 2 (0.9%) | $0 |
| Total | 221 (100.0%) | $72,019 |
Household Income in Bradenton Beach
Household Income Brackets in Bradenton Beach
With 95 households falling in the category, the $35,000 to $49,999 income range is the most frequent in Bradenton Beach, accounting for 21.4% of all households. In contrast, only 4 households (0.9%) fall into the $10,000 to $14,999 income bracket, making it the least populous group.
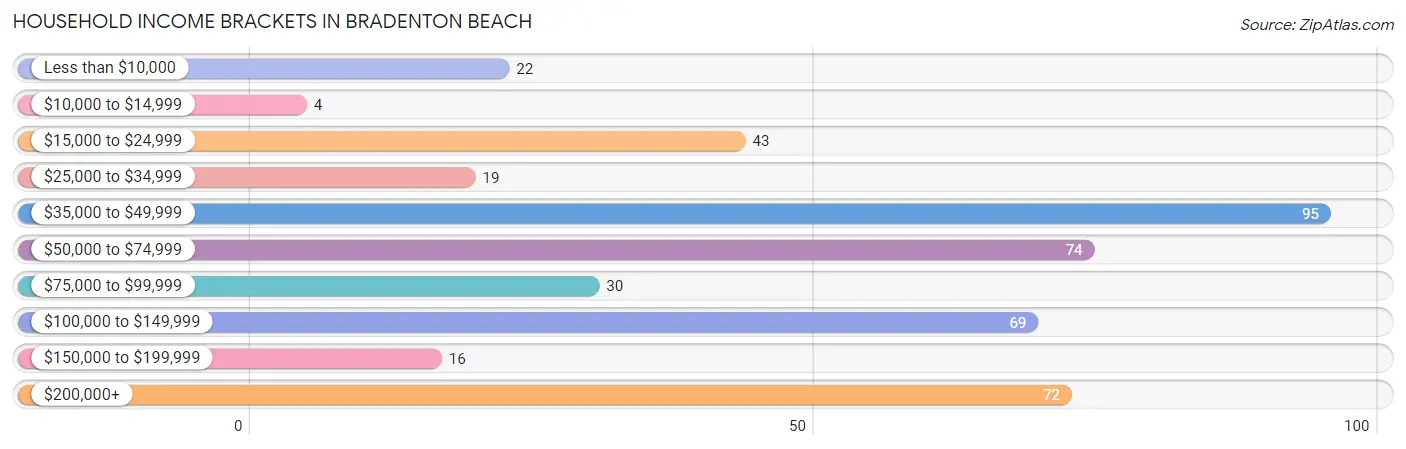
| Income Bracket | # Households | % Households |
| Less than $10,000 | 22 | 5.0% |
| $10,000 to $14,999 | 4 | 0.9% |
| $15,000 to $24,999 | 43 | 9.7% |
| $25,000 to $34,999 | 19 | 4.3% |
| $35,000 to $49,999 | 95 | 21.4% |
| $50,000 to $74,999 | 74 | 16.7% |
| $75,000 to $99,999 | 30 | 6.8% |
| $100,000 to $149,999 | 69 | 15.5% |
| $150,000 to $199,999 | 16 | 3.6% |
| $200,000+ | 72 | 16.2% |
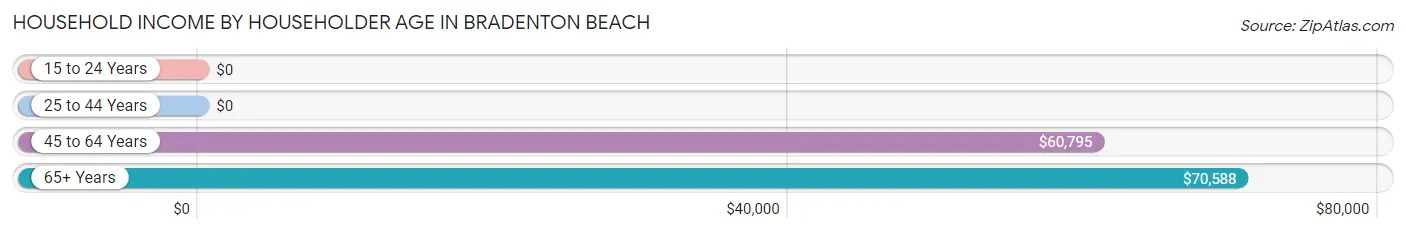
Household Income by Householder Age in Bradenton Beach
The median household income in Bradenton Beach is $66,667, with the highest median household income of $70,588 found in the 65+ years age bracket for the primary householder. A total of 312 households (70.3%) fall into this category.
| Income Bracket | # Households | Median Income |
| 15 to 24 Years | 0 (0.0%) | $0 |
| 25 to 44 Years | 29 (6.5%) | $0 |
| 45 to 64 Years | 103 (23.2%) | $60,795 |
| 65+ Years | 312 (70.3%) | $70,588 |
| Total | 444 (100.0%) | $66,667 |
Poverty in Bradenton Beach
Income Below Poverty by Sex and Age in Bradenton Beach
With 9.4% poverty level for males and 7.9% for females among the residents of Bradenton Beach, 35 to 44 year old males and 35 to 44 year old females are the most vulnerable to poverty, with 2 males (100.0%) and 3 females (17.6%) in their respective age groups living below the poverty level.
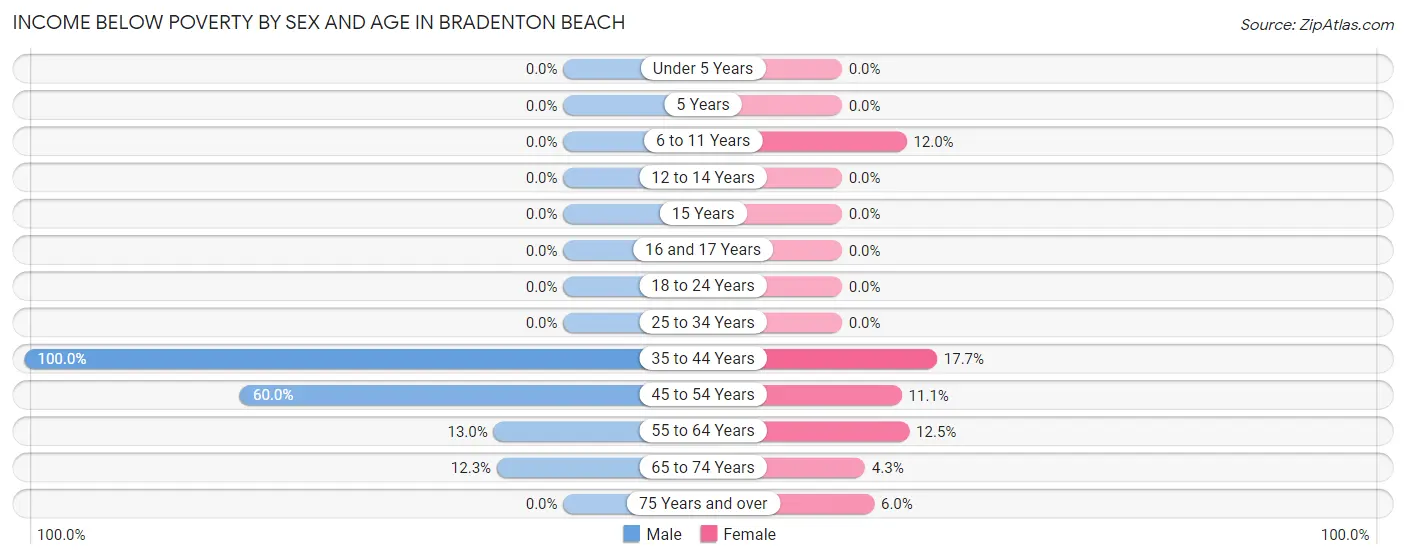
| Age Bracket | Male | Female |
| Under 5 Years | 0 (0.0%) | 0 (0.0%) |
| 5 Years | 0 (0.0%) | 0 (0.0%) |
| 6 to 11 Years | 0 (0.0%) | 3 (12.0%) |
| 12 to 14 Years | 0 (0.0%) | 0 (0.0%) |
| 15 Years | 0 (0.0%) | 0 (0.0%) |
| 16 and 17 Years | 0 (0.0%) | 0 (0.0%) |
| 18 to 24 Years | 0 (0.0%) | 0 (0.0%) |
| 25 to 34 Years | 0 (0.0%) | 0 (0.0%) |
| 35 to 44 Years | 2 (100.0%) | 3 (17.6%) |
| 45 to 54 Years | 3 (60.0%) | 3 (11.1%) |
| 55 to 64 Years | 7 (13.0%) | 11 (12.5%) |
| 65 to 74 Years | 18 (12.3%) | 6 (4.3%) |
| 75 Years and over | 0 (0.0%) | 7 (6.0%) |
| Total | 30 (9.4%) | 33 (7.9%) |
Income Above Poverty by Sex and Age in Bradenton Beach
According to the poverty statistics in Bradenton Beach, males aged 5 years and females aged 25 to 34 years are the age groups that are most secure financially, with 100.0% of males and 100.0% of females in these age groups living above the poverty line.
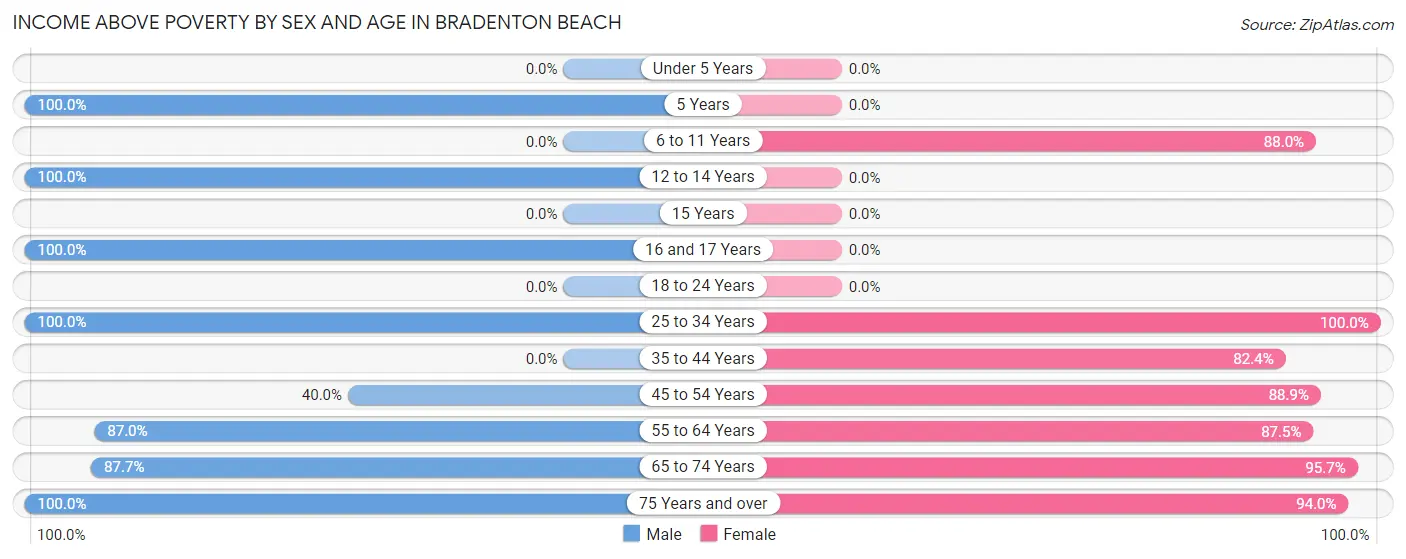
| Age Bracket | Male | Female |
| Under 5 Years | 0 (0.0%) | 0 (0.0%) |
| 5 Years | 4 (100.0%) | 0 (0.0%) |
| 6 to 11 Years | 0 (0.0%) | 22 (88.0%) |
| 12 to 14 Years | 3 (100.0%) | 0 (0.0%) |
| 15 Years | 0 (0.0%) | 0 (0.0%) |
| 16 and 17 Years | 2 (100.0%) | 0 (0.0%) |
| 18 to 24 Years | 0 (0.0%) | 0 (0.0%) |
| 25 to 34 Years | 26 (100.0%) | 4 (100.0%) |
| 35 to 44 Years | 0 (0.0%) | 14 (82.4%) |
| 45 to 54 Years | 2 (40.0%) | 24 (88.9%) |
| 55 to 64 Years | 47 (87.0%) | 77 (87.5%) |
| 65 to 74 Years | 128 (87.7%) | 134 (95.7%) |
| 75 Years and over | 77 (100.0%) | 110 (94.0%) |
| Total | 289 (90.6%) | 385 (92.1%) |
Income Below Poverty Among Married-Couple Families in Bradenton Beach
The poverty statistics for married-couple families in Bradenton Beach show that 3.6% or 7 of the total 193 families live below the poverty line. Families with no children have the highest poverty rate of 3.7%, comprising of 7 families. On the other hand, families with 1 or 2 children have the lowest poverty rate of 0.0%, which includes 0 families.
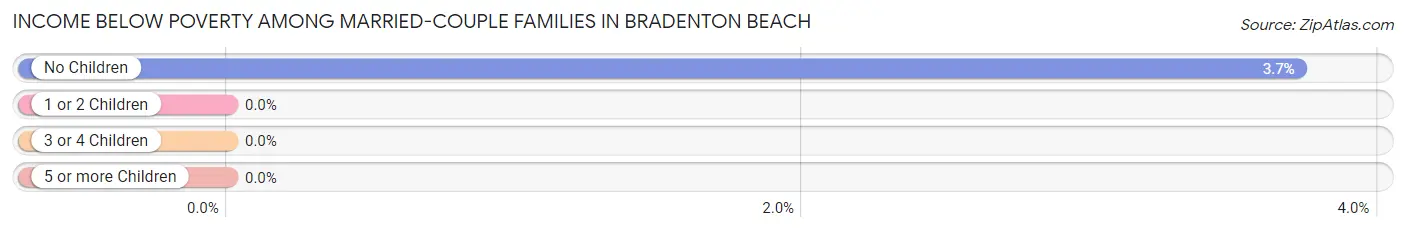
| Children | Above Poverty | Below Poverty |
| No Children | 181 (96.3%) | 7 (3.7%) |
| 1 or 2 Children | 5 (100.0%) | 0 (0.0%) |
| 3 or 4 Children | 0 (0.0%) | 0 (0.0%) |
| 5 or more Children | 0 (0.0%) | 0 (0.0%) |
| Total | 186 (96.4%) | 7 (3.6%) |
Income Below Poverty Among Single-Parent Households in Bradenton Beach
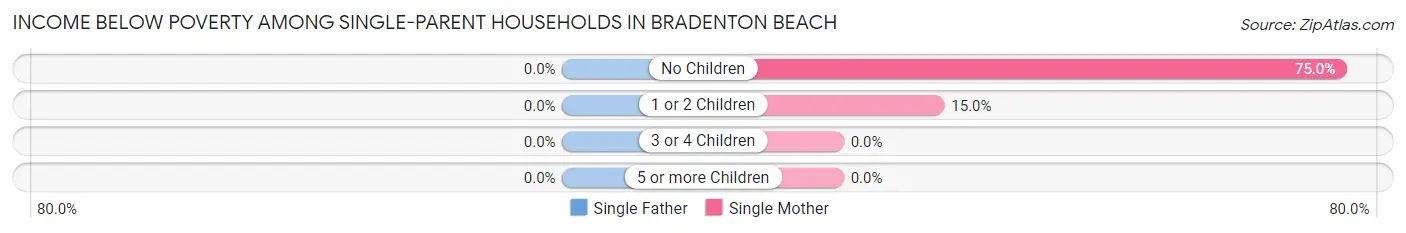
| Children | Single Father | Single Mother |
| No Children | 0 (0.0%) | 6 (75.0%) |
| 1 or 2 Children | 0 (0.0%) | 3 (15.0%) |
| 3 or 4 Children | 0 (0.0%) | 0 (0.0%) |
| 5 or more Children | 0 (0.0%) | 0 (0.0%) |
| Total | 0 (0.0%) | 9 (32.1%) |
Income Below Poverty Among Married-Couple vs Single-Parent Households in Bradenton Beach
The poverty data for Bradenton Beach shows that 7 of the married-couple family households (3.6%) and 9 of the single-parent households (32.1%) are living below the poverty level. Within the married-couple family households, those with no children have the highest poverty rate, with 7 households (3.7%) falling below the poverty line. Among the single-parent households, those with no children have the highest poverty rate, with 6 household (75.0%) living below poverty.
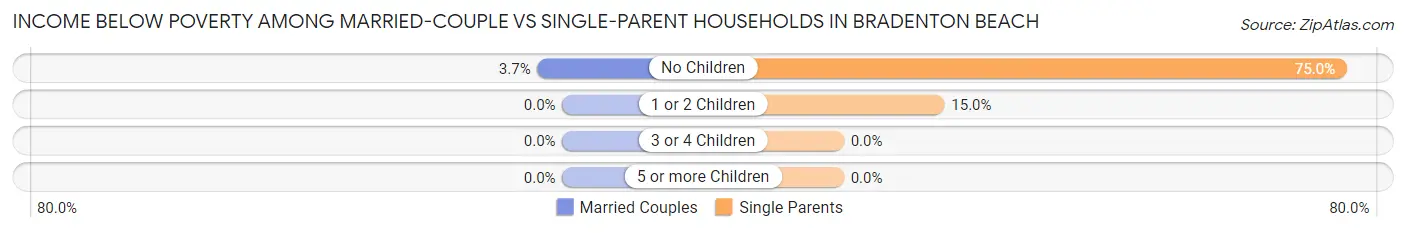
| Children | Married-Couple Families | Single-Parent Households |
| No Children | 7 (3.7%) | 6 (75.0%) |
| 1 or 2 Children | 0 (0.0%) | 3 (15.0%) |
| 3 or 4 Children | 0 (0.0%) | 0 (0.0%) |
| 5 or more Children | 0 (0.0%) | 0 (0.0%) |
| Total | 7 (3.6%) | 9 (32.1%) |
Race in Bradenton Beach
The most populous races in Bradenton Beach are White / Caucasian (704 | 95.5%), Two or more Races (20 | 2.7%), and Hispanic or Latino (15 | 2.0%).
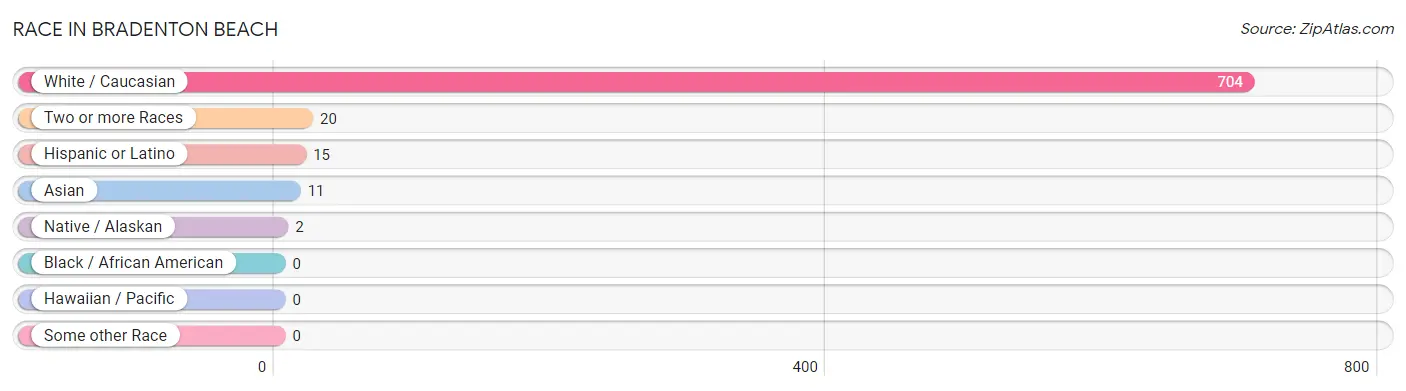
| Race | # Population | % Population |
| Asian | 11 | 1.5% |
| Black / African American | 0 | 0.0% |
| Hawaiian / Pacific | 0 | 0.0% |
| Hispanic or Latino | 15 | 2.0% |
| Native / Alaskan | 2 | 0.3% |
| White / Caucasian | 704 | 95.5% |
| Two or more Races | 20 | 2.7% |
| Some other Race | 0 | 0.0% |
| Total | 737 | 100.0% |
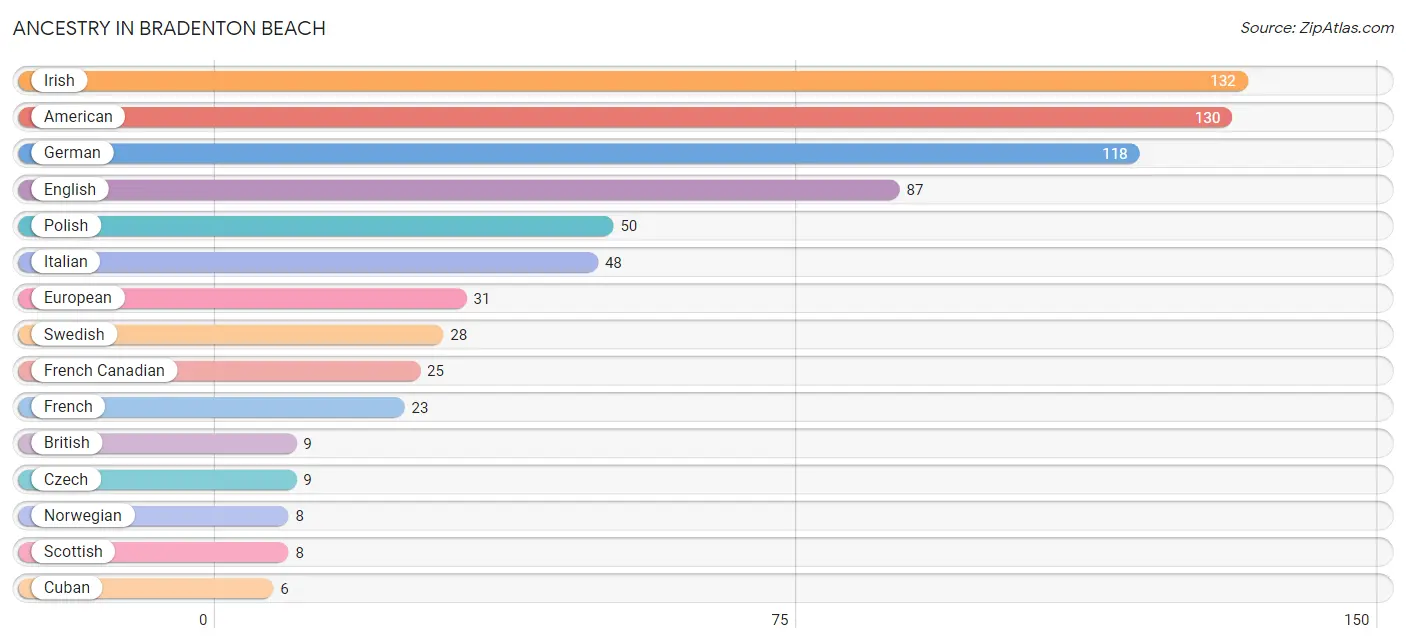
Ancestry in Bradenton Beach
The most populous ancestries reported in Bradenton Beach are Irish (132 | 17.9%), American (130 | 17.6%), German (118 | 16.0%), English (87 | 11.8%), and Polish (50 | 6.8%), together accounting for 70.1% of all Bradenton Beach residents.
| Ancestry | # Population | % Population |
| American | 130 | 17.6% |
| Arab | 4 | 0.5% |
| Armenian | 2 | 0.3% |
| Austrian | 4 | 0.5% |
| Brazilian | 4 | 0.5% |
| British | 9 | 1.2% |
| Cherokee | 2 | 0.3% |
| Croatian | 3 | 0.4% |
| Cuban | 6 | 0.8% |
| Czech | 9 | 1.2% |
| Dutch | 4 | 0.5% |
| Eastern European | 3 | 0.4% |
| English | 87 | 11.8% |
| European | 31 | 4.2% |
| Finnish | 5 | 0.7% |
| French | 23 | 3.1% |
| French Canadian | 25 | 3.4% |
| German | 118 | 16.0% |
| Irish | 132 | 17.9% |
| Italian | 48 | 6.5% |
| Korean | 4 | 0.5% |
| Lebanese | 4 | 0.5% |
| Lithuanian | 2 | 0.3% |
| Mexican | 2 | 0.3% |
| Norwegian | 8 | 1.1% |
| Pakistani | 2 | 0.3% |
| Polish | 50 | 6.8% |
| Portuguese | 4 | 0.5% |
| Puerto Rican | 3 | 0.4% |
| Romanian | 4 | 0.5% |
| Scotch-Irish | 2 | 0.3% |
| Scottish | 8 | 1.1% |
| Slovak | 4 | 0.5% |
| Sri Lankan | 5 | 0.7% |
| Swedish | 28 | 3.8% |
| Swiss | 3 | 0.4% |
| Yugoslavian | 4 | 0.5% | View All 37 Rows |
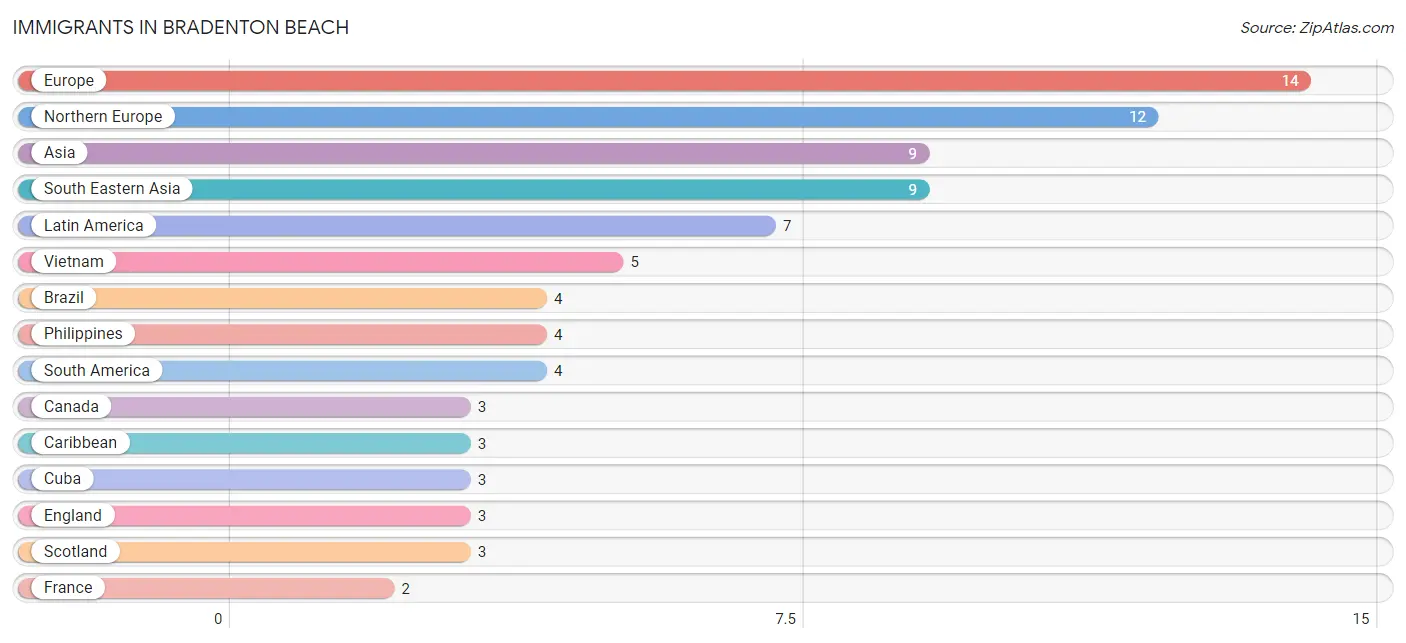
Immigrants in Bradenton Beach
The most numerous immigrant groups reported in Bradenton Beach came from Europe (14 | 1.9%), Northern Europe (12 | 1.6%), Asia (9 | 1.2%), South Eastern Asia (9 | 1.2%), and Latin America (7 | 0.9%), together accounting for 6.9% of all Bradenton Beach residents.
| Immigration Origin | # Population | % Population |
| Asia | 9 | 1.2% |
| Brazil | 4 | 0.5% |
| Canada | 3 | 0.4% |
| Caribbean | 3 | 0.4% |
| Cuba | 3 | 0.4% |
| England | 3 | 0.4% |
| Europe | 14 | 1.9% |
| France | 2 | 0.3% |
| Latin America | 7 | 0.9% |
| Northern Europe | 12 | 1.6% |
| Philippines | 4 | 0.5% |
| Scotland | 3 | 0.4% |
| South America | 4 | 0.5% |
| South Eastern Asia | 9 | 1.2% |
| Vietnam | 5 | 0.7% |
| Western Europe | 2 | 0.3% | View All 16 Rows |
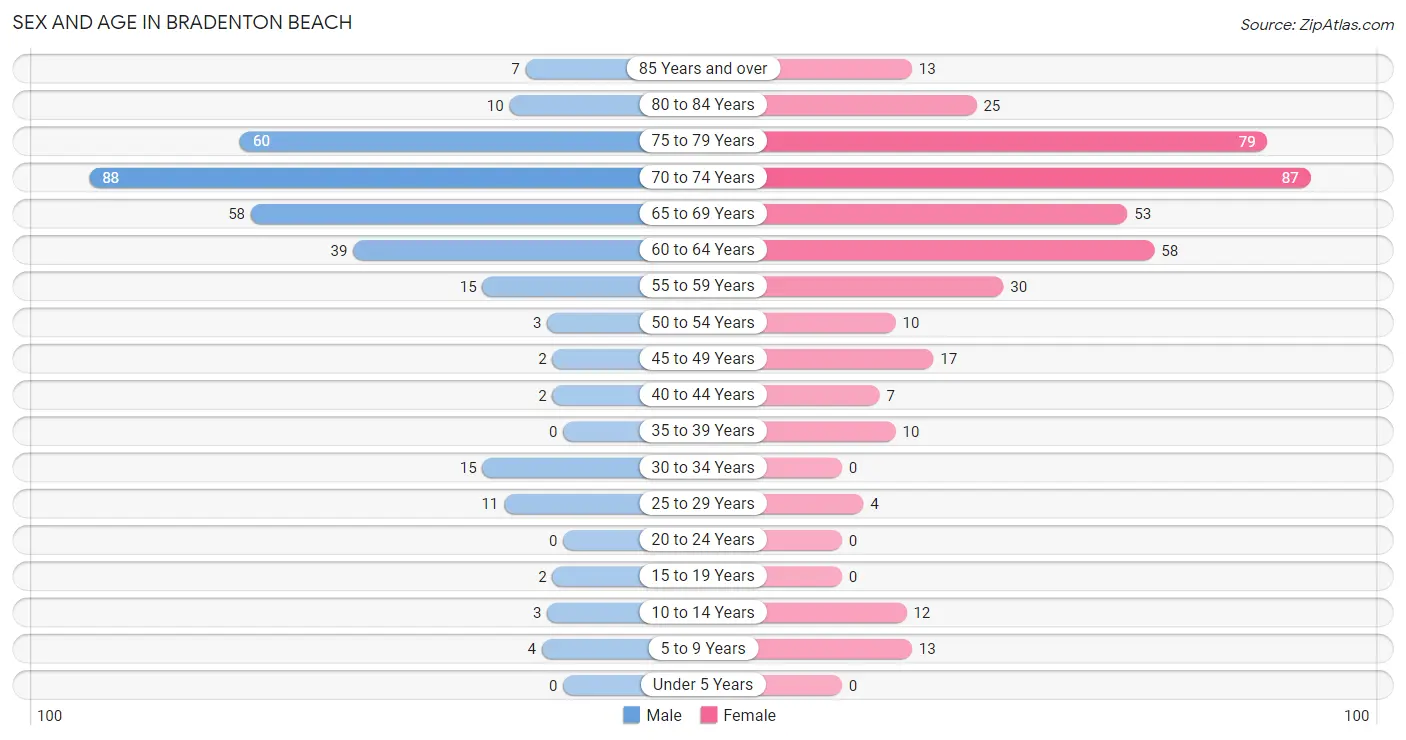
Sex and Age in Bradenton Beach
Sex and Age in Bradenton Beach
The most populous age groups in Bradenton Beach are 70 to 74 Years (88 | 27.6%) for men and 70 to 74 Years (87 | 20.8%) for women.
| Age Bracket | Male | Female |
| Under 5 Years | 0 (0.0%) | 0 (0.0%) |
| 5 to 9 Years | 4 (1.3%) | 13 (3.1%) |
| 10 to 14 Years | 3 (0.9%) | 12 (2.9%) |
| 15 to 19 Years | 2 (0.6%) | 0 (0.0%) |
| 20 to 24 Years | 0 (0.0%) | 0 (0.0%) |
| 25 to 29 Years | 11 (3.5%) | 4 (1.0%) |
| 30 to 34 Years | 15 (4.7%) | 0 (0.0%) |
| 35 to 39 Years | 0 (0.0%) | 10 (2.4%) |
| 40 to 44 Years | 2 (0.6%) | 7 (1.7%) |
| 45 to 49 Years | 2 (0.6%) | 17 (4.1%) |
| 50 to 54 Years | 3 (0.9%) | 10 (2.4%) |
| 55 to 59 Years | 15 (4.7%) | 30 (7.2%) |
| 60 to 64 Years | 39 (12.2%) | 58 (13.9%) |
| 65 to 69 Years | 58 (18.2%) | 53 (12.7%) |
| 70 to 74 Years | 88 (27.6%) | 87 (20.8%) |
| 75 to 79 Years | 60 (18.8%) | 79 (18.9%) |
| 80 to 84 Years | 10 (3.1%) | 25 (6.0%) |
| 85 Years and over | 7 (2.2%) | 13 (3.1%) |
| Total | 319 (100.0%) | 418 (100.0%) |
Families and Households in Bradenton Beach
Median Family Size in Bradenton Beach
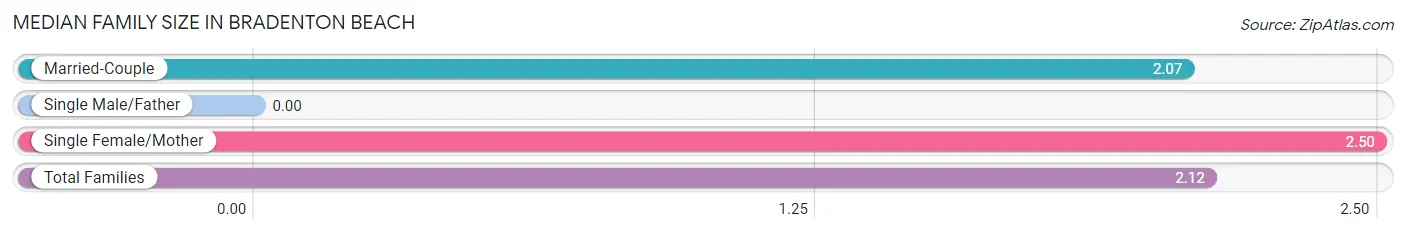
| Family Type | # Families | Family Size |
| Married-Couple | 193 (87.3%) | 2.07 |
| Single Male/Father | 0 (0.0%) | - |
| Single Female/Mother | 28 (12.7%) | 2.50 |
| Total Families | 221 (100.0%) | 2.12 |
Median Household Size in Bradenton Beach
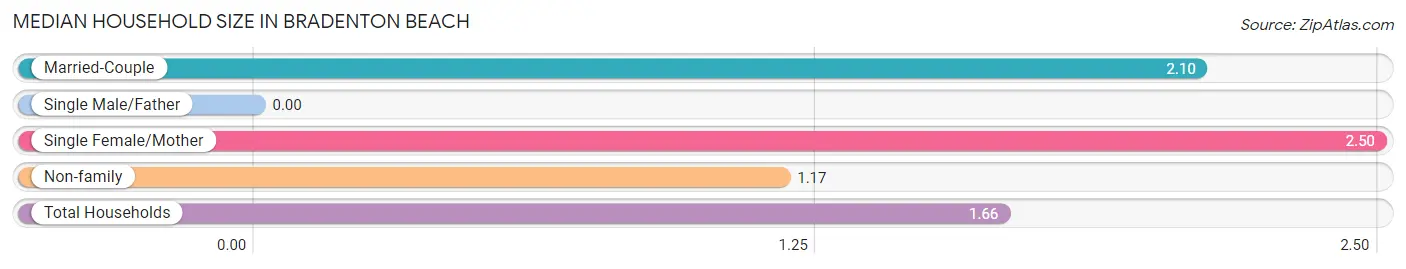
| Household Type | # Households | Household Size |
| Married-Couple | 193 (43.5%) | 2.10 |
| Single Male/Father | 0 (0.0%) | - |
| Single Female/Mother | 28 (6.3%) | 2.50 |
| Non-family | 223 (50.2%) | 1.17 |
| Total Households | 444 (100.0%) | 1.66 |
Household Size by Marriage Status in Bradenton Beach
Out of a total of 444 households in Bradenton Beach, 221 (49.8%) are family households, while 223 (50.2%) are nonfamily households. The most numerous type of family households are 2-person households, comprising 191, and the most common type of nonfamily households are 1-person households, comprising 195.
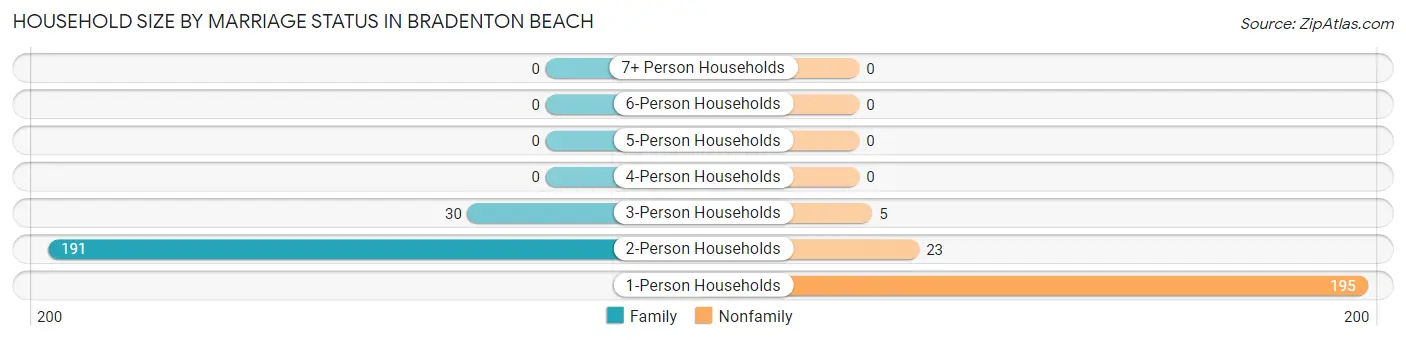
| Household Size | Family Households | Nonfamily Households |
| 1-Person Households | - | 195 (43.9%) |
| 2-Person Households | 191 (43.0%) | 23 (5.2%) |
| 3-Person Households | 30 (6.8%) | 5 (1.1%) |
| 4-Person Households | 0 (0.0%) | 0 (0.0%) |
| 5-Person Households | 0 (0.0%) | 0 (0.0%) |
| 6-Person Households | 0 (0.0%) | 0 (0.0%) |
| 7+ Person Households | 0 (0.0%) | 0 (0.0%) |
| Total | 221 (49.8%) | 223 (50.2%) |
Female Fertility in Bradenton Beach
Fertility by Age in Bradenton Beach
| Age Bracket | Women with Births | Births / 1,000 Women |
| 15 to 19 years | 0 (0.0%) | 0.0 |
| 20 to 34 years | 0 (0.0%) | 0.0 |
| 35 to 50 years | 0 (0.0%) | 0.0 |
| Total | 0 (0.0%) | 0.0 |
Fertility by Age by Marriage Status in Bradenton Beach
| Age Bracket | Married | Unmarried |
| 15 to 19 years | 0 (0.0%) | 0 (0.0%) |
| 20 to 34 years | 0 (0.0%) | 0 (0.0%) |
| 35 to 50 years | 0 (0.0%) | 0 (0.0%) |
| Total | 0 (0.0%) | 0 (0.0%) |
Fertility by Education in Bradenton Beach
| Educational Attainment | Women with Births | Births / 1,000 Women |
| Less than High School | 0 (0.0%) | 0.0 |
| High School Diploma | 0 (0.0%) | 0.0 |
| College or Associate's Degree | 0 (0.0%) | 0.0 |
| Bachelor's Degree | 0 (0.0%) | 0.0 |
| Graduate Degree | 0 (0.0%) | 0.0 |
| Total | 0 (0.0%) | 0.0 |
Fertility by Education by Marriage Status in Bradenton Beach
| Educational Attainment | Married | Unmarried |
| Less than High School | 0 (0.0%) | 0 (0.0%) |
| High School Diploma | 0 (0.0%) | 0 (0.0%) |
| College or Associate's Degree | 0 (0.0%) | 0 (0.0%) |
| Bachelor's Degree | 0 (0.0%) | 0 (0.0%) |
| Graduate Degree | 0 (0.0%) | 0 (0.0%) |
| Total | 0 (0.0%) | 0 (0.0%) |
Employment Characteristics in Bradenton Beach
Employment by Class of Employer in Bradenton Beach
Among the 260 employed individuals in Bradenton Beach, private company employees (199 | 76.5%), local government employees (18 | 6.9%), and self-employed (incorporated) (12 | 4.6%) make up the most common classes of employment.
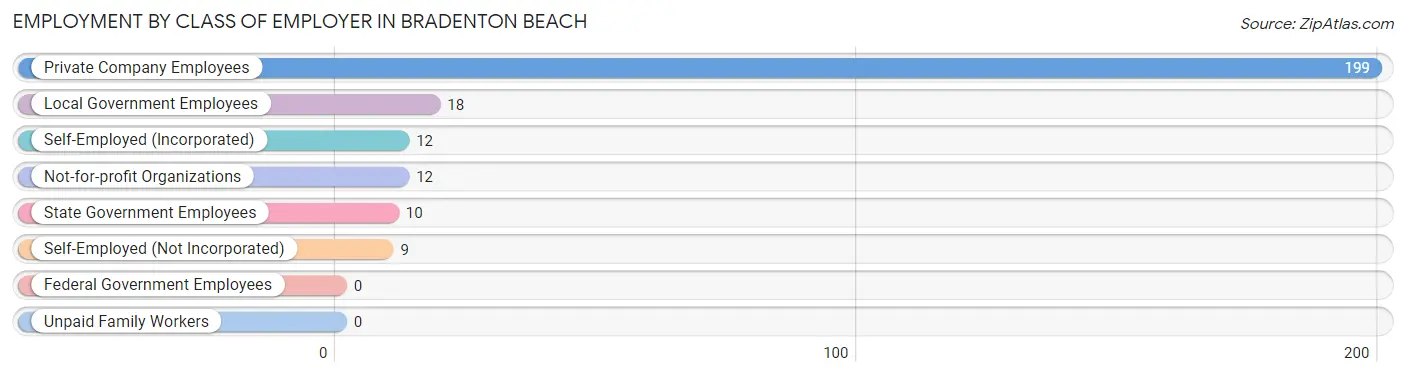
| Employer Class | # Employees | % Employees |
| Private Company Employees | 199 | 76.5% |
| Self-Employed (Incorporated) | 12 | 4.6% |
| Self-Employed (Not Incorporated) | 9 | 3.5% |
| Not-for-profit Organizations | 12 | 4.6% |
| Local Government Employees | 18 | 6.9% |
| State Government Employees | 10 | 3.8% |
| Federal Government Employees | 0 | 0.0% |
| Unpaid Family Workers | 0 | 0.0% |
| Total | 260 | 100.0% |
Employment Status by Age in Bradenton Beach
According to the labor force statistics for Bradenton Beach, out of the total population over 16 years of age (705), 39.0% or 275 individuals are in the labor force, with 2.5% or 7 of them unemployed. The age group with the highest labor force participation rate is 16 to 19 years, with 100.0% or 2 individuals in the labor force. Within the labor force, the 60 to 64 years age range has the highest percentage of unemployed individuals, with 12.1% or 7 of them being unemployed.
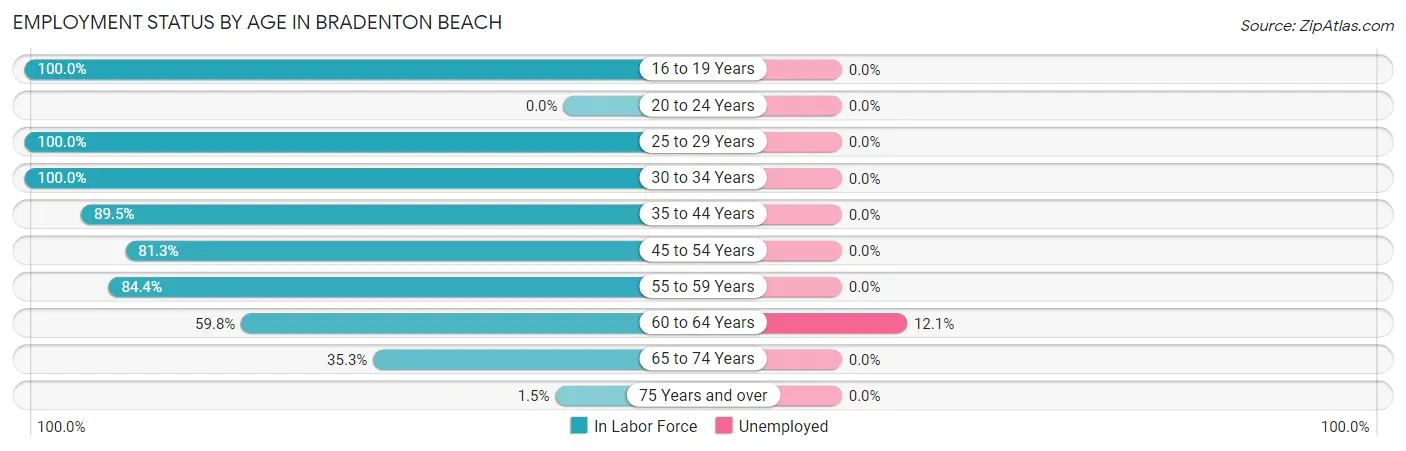
| Age Bracket | In Labor Force | Unemployed |
| 16 to 19 Years | 2 (100.0%) | 0 (0.0%) |
| 20 to 24 Years | 0 (0.0%) | 0 (0.0%) |
| 25 to 29 Years | 15 (100.0%) | 0 (0.0%) |
| 30 to 34 Years | 15 (100.0%) | 0 (0.0%) |
| 35 to 44 Years | 17 (89.5%) | 0 (0.0%) |
| 45 to 54 Years | 26 (81.3%) | 0 (0.0%) |
| 55 to 59 Years | 38 (84.4%) | 0 (0.0%) |
| 60 to 64 Years | 58 (59.8%) | 7 (12.1%) |
| 65 to 74 Years | 101 (35.3%) | 0 (0.0%) |
| 75 Years and over | 3 (1.5%) | 0 (0.0%) |
| Total | 275 (39.0%) | 7 (2.5%) |
Employment Status by Educational Attainment in Bradenton Beach
According to labor force statistics for Bradenton Beach, 75.8% of individuals (169) out of the total population between 25 and 64 years of age (223) are in the labor force, with 4.1% or 7 of them being unemployed. The group with the highest labor force participation rate are those with the educational attainment of less than high school, with 100.0% or 3 individuals in the labor force. Within the labor force, individuals with college / associate degree education have the highest percentage of unemployment, with 8.6% or 3 of them being unemployed.
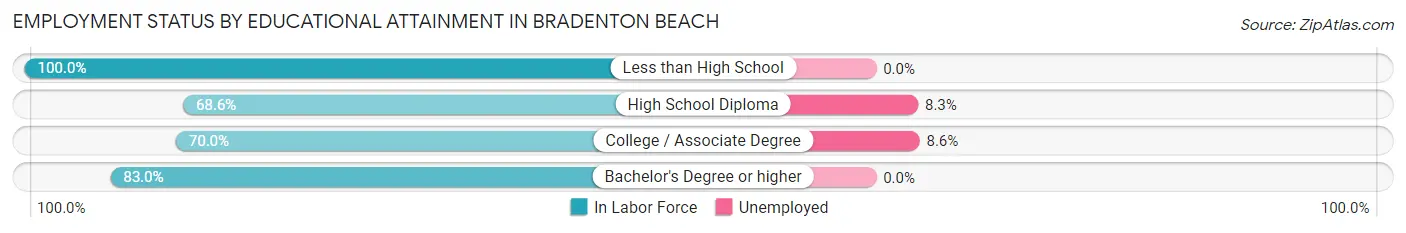
| Educational Attainment | In Labor Force | Unemployed |
| Less than High School | 3 (100.0%) | 0 (0.0%) |
| High School Diploma | 48 (68.6%) | 6 (8.3%) |
| College / Associate Degree | 35 (70.0%) | 4 (8.6%) |
| Bachelor's Degree or higher | 83 (83.0%) | 0 (0.0%) |
| Total | 169 (75.8%) | 9 (4.1%) |
Employment Occupations by Sex in Bradenton Beach
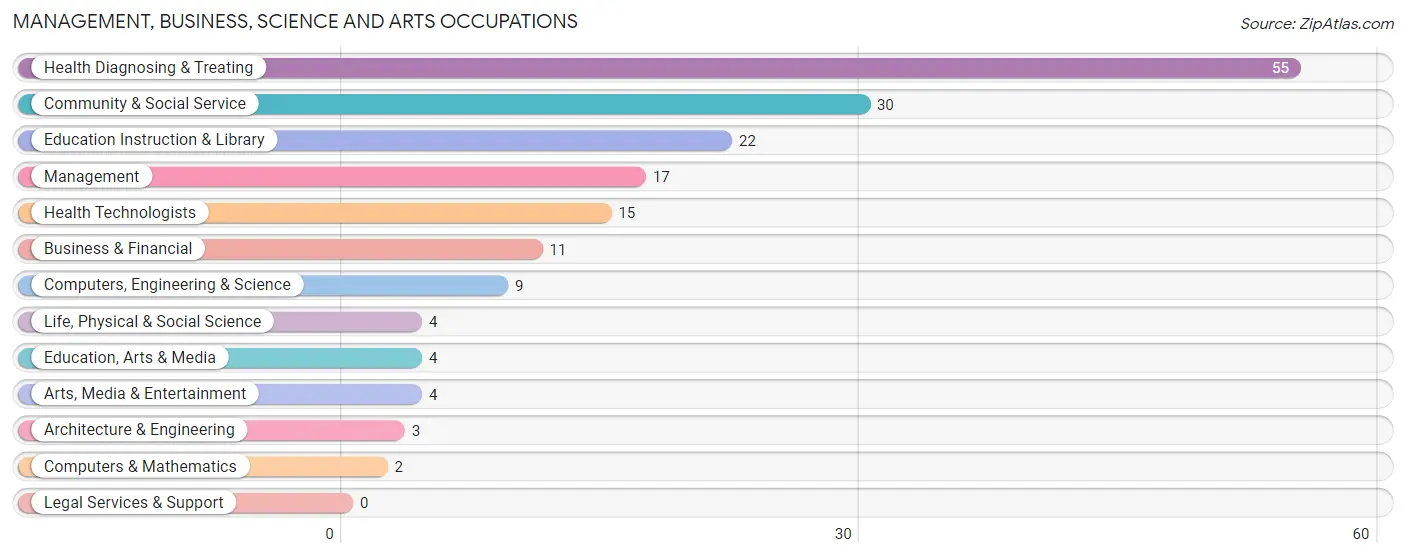
Management, Business, Science and Arts Occupations
The most common Management, Business, Science and Arts occupations in Bradenton Beach are Health Diagnosing & Treating (55 | 20.5%), Community & Social Service (30 | 11.2%), Education Instruction & Library (22 | 8.2%), Management (17 | 6.3%), and Health Technologists (15 | 5.6%).
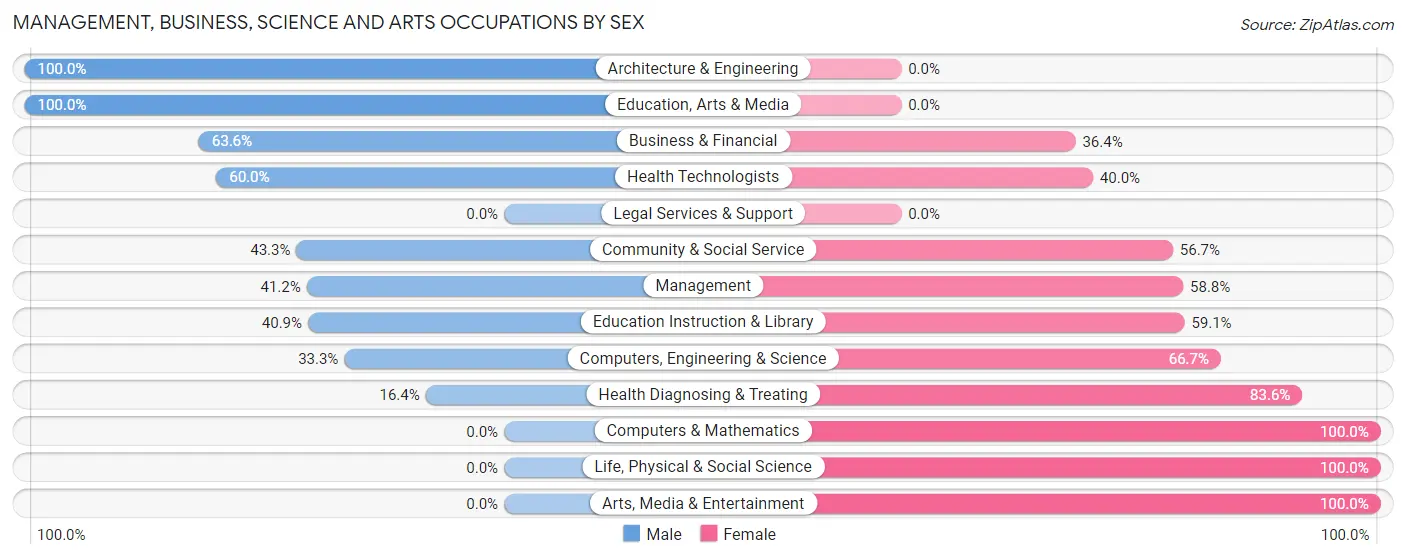
Management, Business, Science and Arts Occupations by Sex
Within the Management, Business, Science and Arts occupations in Bradenton Beach, the most male-oriented occupations are Architecture & Engineering (100.0%), Education, Arts & Media (100.0%), and Business & Financial (63.6%), while the most female-oriented occupations are Computers & Mathematics (100.0%), Life, Physical & Social Science (100.0%), and Arts, Media & Entertainment (100.0%).
| Occupation | Male | Female |
| Management | 7 (41.2%) | 10 (58.8%) |
| Business & Financial | 7 (63.6%) | 4 (36.4%) |
| Computers, Engineering & Science | 3 (33.3%) | 6 (66.7%) |
| Computers & Mathematics | 0 (0.0%) | 2 (100.0%) |
| Architecture & Engineering | 3 (100.0%) | 0 (0.0%) |
| Life, Physical & Social Science | 0 (0.0%) | 4 (100.0%) |
| Community & Social Service | 13 (43.3%) | 17 (56.7%) |
| Education, Arts & Media | 4 (100.0%) | 0 (0.0%) |
| Legal Services & Support | 0 (0.0%) | 0 (0.0%) |
| Education Instruction & Library | 9 (40.9%) | 13 (59.1%) |
| Arts, Media & Entertainment | 0 (0.0%) | 4 (100.0%) |
| Health Diagnosing & Treating | 9 (16.4%) | 46 (83.6%) |
| Health Technologists | 9 (60.0%) | 6 (40.0%) |
| Total (Category) | 39 (32.0%) | 83 (68.0%) |
| Total (Overall) | 123 (45.9%) | 145 (54.1%) |
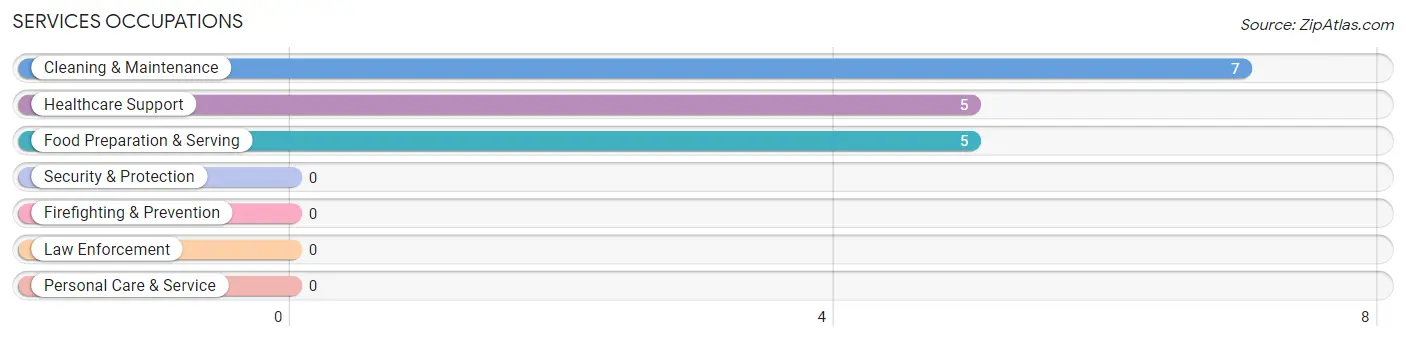
Services Occupations
The most common Services occupations in Bradenton Beach are Cleaning & Maintenance (7 | 2.6%), Healthcare Support (5 | 1.9%), and Food Preparation & Serving (5 | 1.9%).
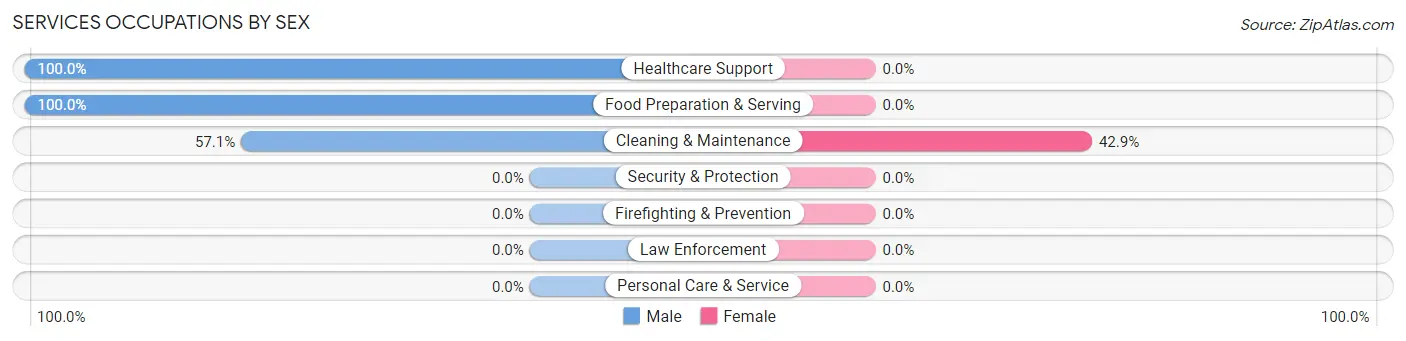
Services Occupations by Sex
| Occupation | Male | Female |
| Healthcare Support | 5 (100.0%) | 0 (0.0%) |
| Security & Protection | 0 (0.0%) | 0 (0.0%) |
| Firefighting & Prevention | 0 (0.0%) | 0 (0.0%) |
| Law Enforcement | 0 (0.0%) | 0 (0.0%) |
| Food Preparation & Serving | 5 (100.0%) | 0 (0.0%) |
| Cleaning & Maintenance | 4 (57.1%) | 3 (42.9%) |
| Personal Care & Service | 0 (0.0%) | 0 (0.0%) |
| Total (Category) | 14 (82.4%) | 3 (17.6%) |
| Total (Overall) | 123 (45.9%) | 145 (54.1%) |
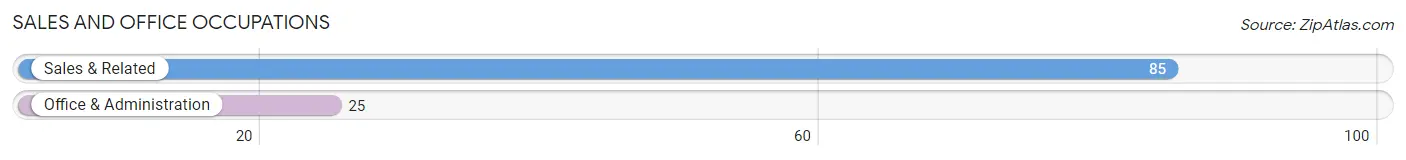
Sales and Office Occupations
The most common Sales and Office occupations in Bradenton Beach are Sales & Related (85 | 31.7%), and Office & Administration (25 | 9.3%).
Sales and Office Occupations by Sex
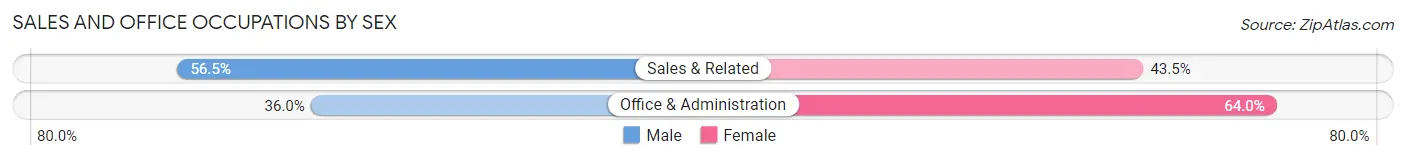
| Occupation | Male | Female |
| Sales & Related | 48 (56.5%) | 37 (43.5%) |
| Office & Administration | 9 (36.0%) | 16 (64.0%) |
| Total (Category) | 57 (51.8%) | 53 (48.2%) |
| Total (Overall) | 123 (45.9%) | 145 (54.1%) |
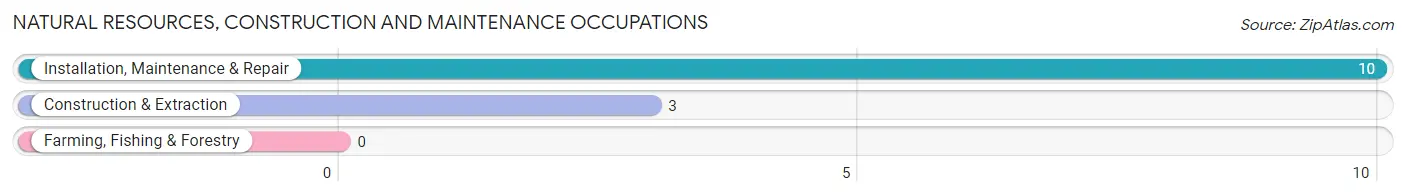
Natural Resources, Construction and Maintenance Occupations
The most common Natural Resources, Construction and Maintenance occupations in Bradenton Beach are Installation, Maintenance & Repair (10 | 3.7%), and Construction & Extraction (3 | 1.1%).
Natural Resources, Construction and Maintenance Occupations by Sex
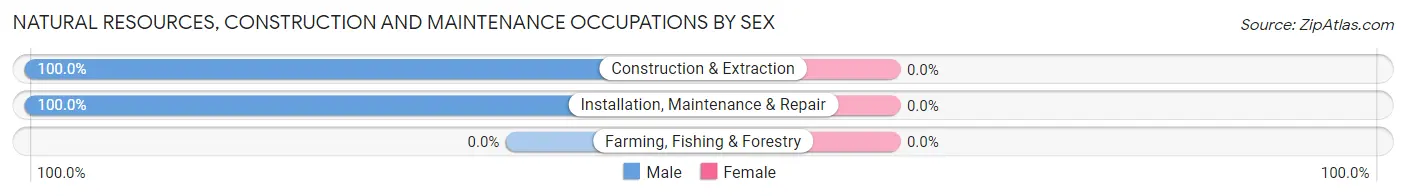
| Occupation | Male | Female |
| Farming, Fishing & Forestry | 0 (0.0%) | 0 (0.0%) |
| Construction & Extraction | 3 (100.0%) | 0 (0.0%) |
| Installation, Maintenance & Repair | 10 (100.0%) | 0 (0.0%) |
| Total (Category) | 13 (100.0%) | 0 (0.0%) |
| Total (Overall) | 123 (45.9%) | 145 (54.1%) |
Production, Transportation and Moving Occupations
The most common Production, Transportation and Moving occupations in Bradenton Beach are , and Transportation (6 | 2.2%).
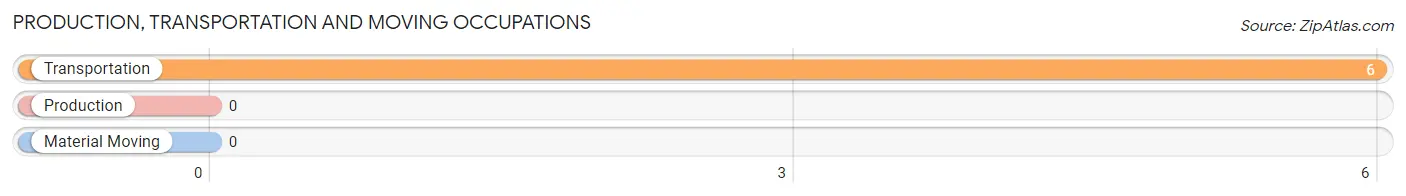
Production, Transportation and Moving Occupations by Sex
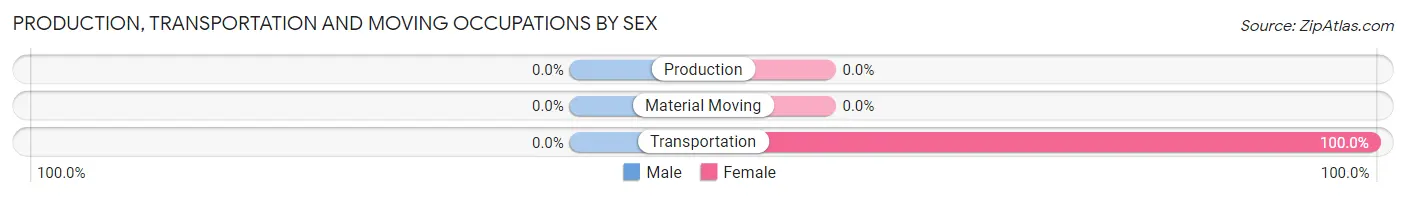
| Occupation | Male | Female |
| Production | 0 (0.0%) | 0 (0.0%) |
| Transportation | 0 (0.0%) | 6 (100.0%) |
| Material Moving | 0 (0.0%) | 0 (0.0%) |
| Total (Category) | 0 (0.0%) | 6 (100.0%) |
| Total (Overall) | 123 (45.9%) | 145 (54.1%) |
Employment Industries by Sex in Bradenton Beach
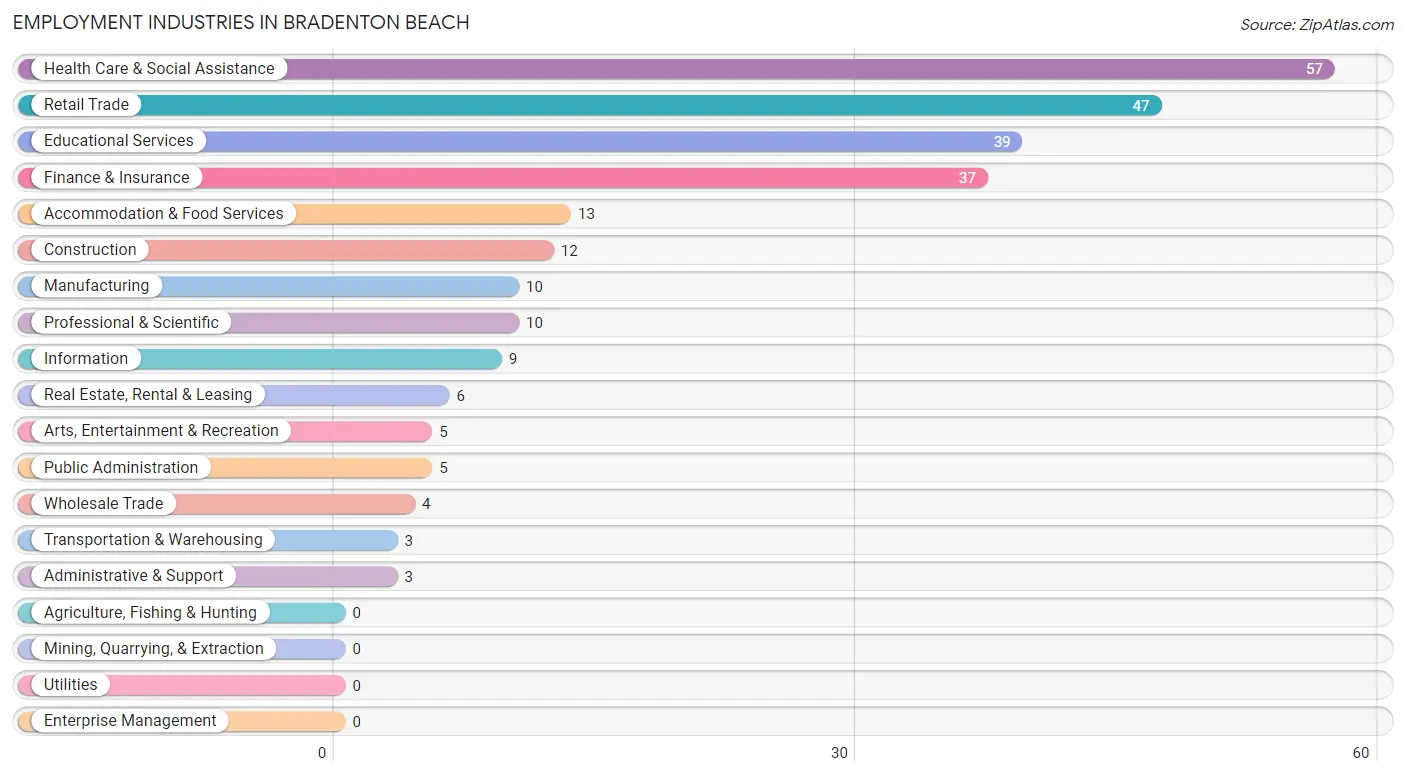
Employment Industries in Bradenton Beach
The major employment industries in Bradenton Beach include Health Care & Social Assistance (57 | 21.3%), Retail Trade (47 | 17.5%), Educational Services (39 | 14.5%), Finance & Insurance (37 | 13.8%), and Accommodation & Food Services (13 | 4.9%).
Employment Industries by Sex in Bradenton Beach
The Bradenton Beach industries that see more men than women are Manufacturing (100.0%), Wholesale Trade (100.0%), and Information (100.0%), whereas the industries that tend to have a higher number of women are Transportation & Warehousing (100.0%), Public Administration (100.0%), and Retail Trade (89.4%).
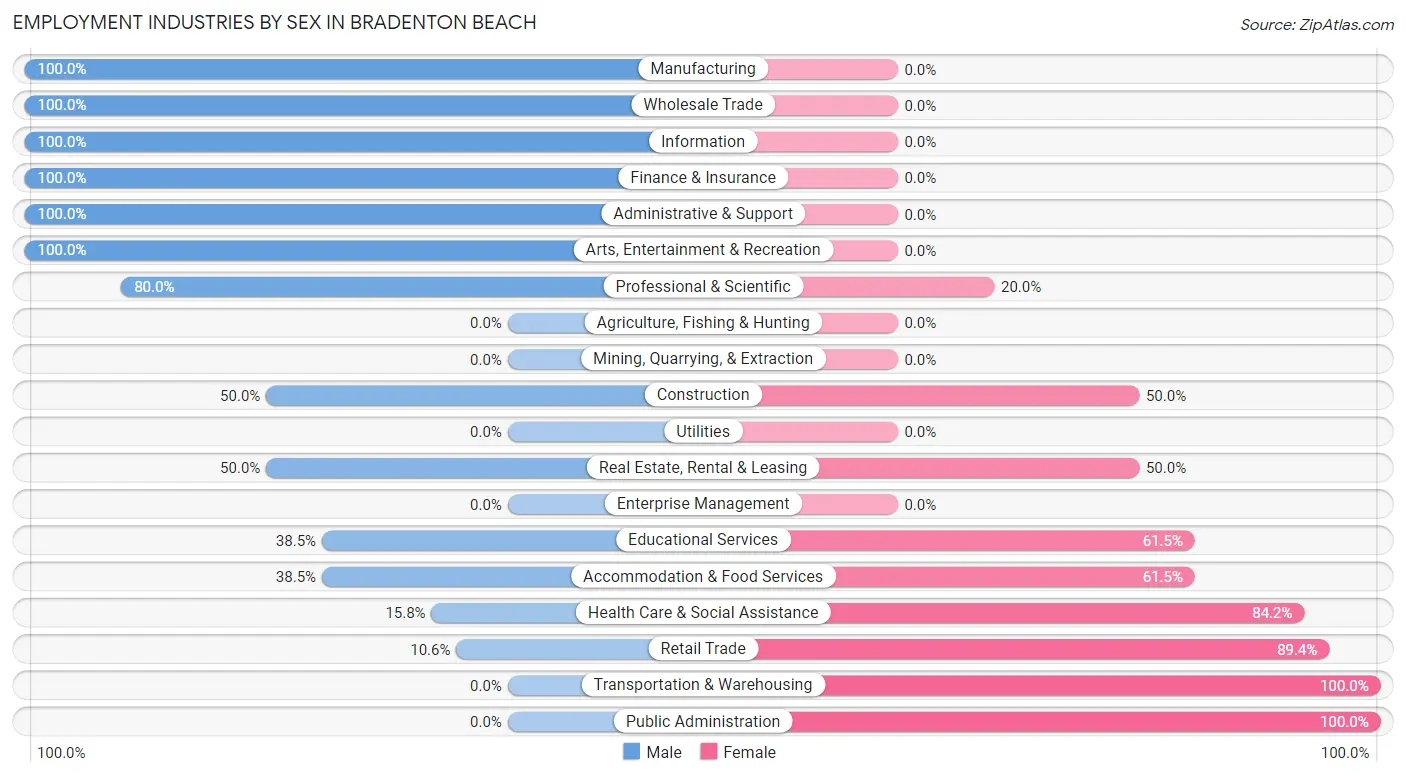
| Industry | Male | Female |
| Agriculture, Fishing & Hunting | 0 (0.0%) | 0 (0.0%) |
| Mining, Quarrying, & Extraction | 0 (0.0%) | 0 (0.0%) |
| Construction | 6 (50.0%) | 6 (50.0%) |
| Manufacturing | 10 (100.0%) | 0 (0.0%) |
| Wholesale Trade | 4 (100.0%) | 0 (0.0%) |
| Retail Trade | 5 (10.6%) | 42 (89.4%) |
| Transportation & Warehousing | 0 (0.0%) | 3 (100.0%) |
| Utilities | 0 (0.0%) | 0 (0.0%) |
| Information | 9 (100.0%) | 0 (0.0%) |
| Finance & Insurance | 37 (100.0%) | 0 (0.0%) |
| Real Estate, Rental & Leasing | 3 (50.0%) | 3 (50.0%) |
| Professional & Scientific | 8 (80.0%) | 2 (20.0%) |
| Enterprise Management | 0 (0.0%) | 0 (0.0%) |
| Administrative & Support | 3 (100.0%) | 0 (0.0%) |
| Educational Services | 15 (38.5%) | 24 (61.5%) |
| Health Care & Social Assistance | 9 (15.8%) | 48 (84.2%) |
| Arts, Entertainment & Recreation | 5 (100.0%) | 0 (0.0%) |
| Accommodation & Food Services | 5 (38.5%) | 8 (61.5%) |
| Public Administration | 0 (0.0%) | 5 (100.0%) |
| Total | 123 (45.9%) | 145 (54.1%) |
Education in Bradenton Beach
School Enrollment in Bradenton Beach
The most common levels of schooling among the 38 students in Bradenton Beach are elementary school (16 | 42.1%), middle school (12 | 31.6%), and kindergarten (4 | 10.5%).
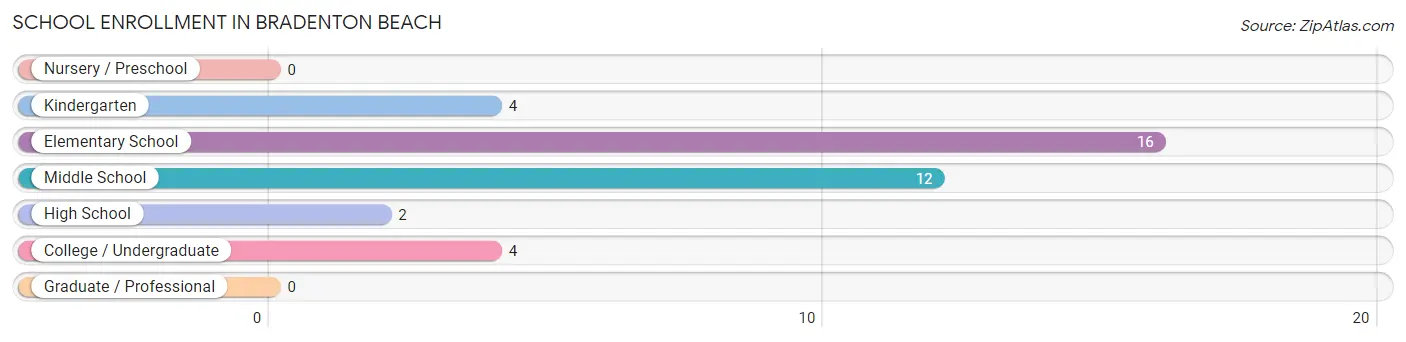
| School Level | # Students | % Students |
| Nursery / Preschool | 0 | 0.0% |
| Kindergarten | 4 | 10.5% |
| Elementary School | 16 | 42.1% |
| Middle School | 12 | 31.6% |
| High School | 2 | 5.3% |
| College / Undergraduate | 4 | 10.5% |
| Graduate / Professional | 0 | 0.0% |
| Total | 38 | 100.0% |
School Enrollment by Age by Funding Source in Bradenton Beach
Out of a total of 38 students who are enrolled in schools in Bradenton Beach, 6 (15.8%) attend a private institution, while the remaining 32 (84.2%) are enrolled in public schools. The age group of 15 to 17 year olds has the highest likelihood of being enrolled in private schools, with 2 (100.0% in the age bracket) enrolled. Conversely, the age group of 5 to 9 year old has the lowest likelihood of being enrolled in a private school, with 17 (100.0% in the age bracket) attending a public institution.
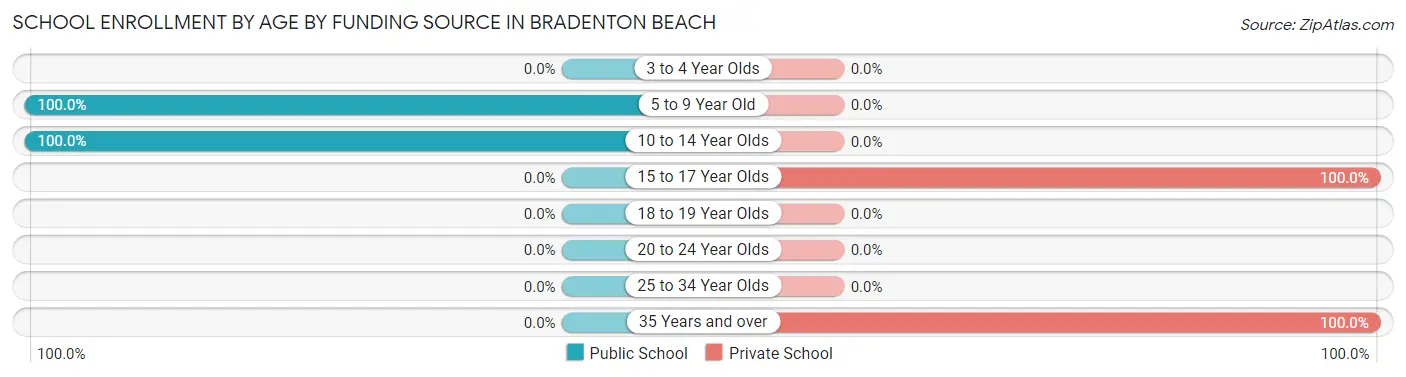
| Age Bracket | Public School | Private School |
| 3 to 4 Year Olds | 0 (0.0%) | 0 (0.0%) |
| 5 to 9 Year Old | 17 (100.0%) | 0 (0.0%) |
| 10 to 14 Year Olds | 15 (100.0%) | 0 (0.0%) |
| 15 to 17 Year Olds | 0 (0.0%) | 2 (100.0%) |
| 18 to 19 Year Olds | 0 (0.0%) | 0 (0.0%) |
| 20 to 24 Year Olds | 0 (0.0%) | 0 (0.0%) |
| 25 to 34 Year Olds | 0 (0.0%) | 0 (0.0%) |
| 35 Years and over | 0 (0.0%) | 4 (100.0%) |
| Total | 32 (84.2%) | 6 (15.8%) |
Educational Attainment by Field of Study in Bradenton Beach
Education (62 | 18.0%), science & technology (60 | 17.4%), liberal arts & history (57 | 16.5%), psychology (44 | 12.8%), and business (32 | 9.3%) are the most common fields of study among 345 individuals in Bradenton Beach who have obtained a bachelor's degree or higher.
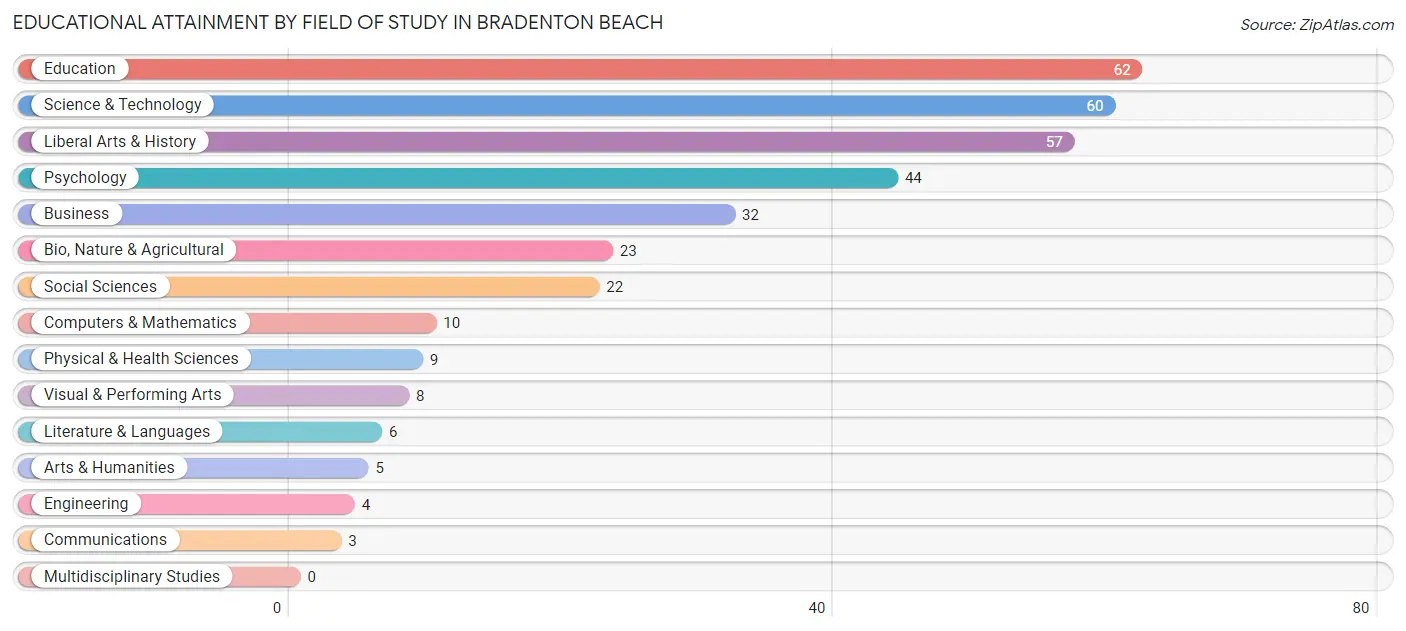
| Field of Study | # Graduates | % Graduates |
| Computers & Mathematics | 10 | 2.9% |
| Bio, Nature & Agricultural | 23 | 6.7% |
| Physical & Health Sciences | 9 | 2.6% |
| Psychology | 44 | 12.8% |
| Social Sciences | 22 | 6.4% |
| Engineering | 4 | 1.2% |
| Multidisciplinary Studies | 0 | 0.0% |
| Science & Technology | 60 | 17.4% |
| Business | 32 | 9.3% |
| Education | 62 | 18.0% |
| Literature & Languages | 6 | 1.7% |
| Liberal Arts & History | 57 | 16.5% |
| Visual & Performing Arts | 8 | 2.3% |
| Communications | 3 | 0.9% |
| Arts & Humanities | 5 | 1.5% |
| Total | 345 | 100.0% |
Transportation & Commute in Bradenton Beach
Vehicle Availability by Sex in Bradenton Beach
The most prevalent vehicle ownership categories in Bradenton Beach are males with 2 vehicles (58, accounting for 50.4%) and females with 2 vehicles (64, making up 40.0%).
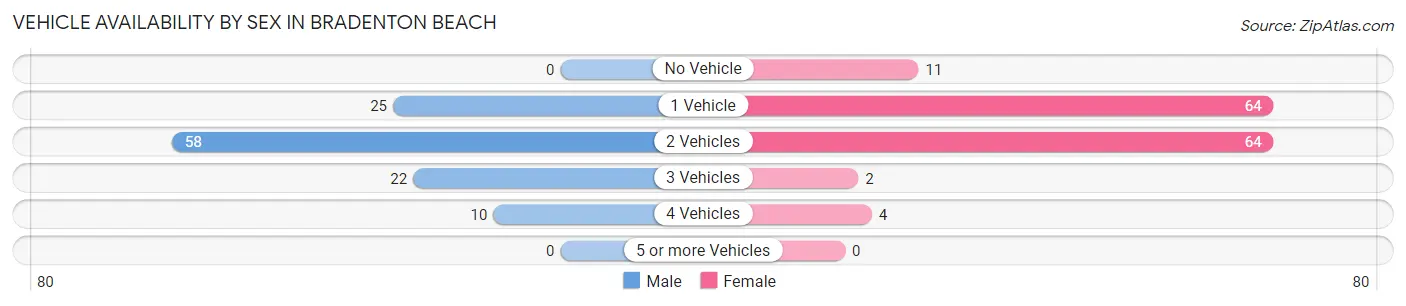
| Vehicles Available | Male | Female |
| No Vehicle | 0 (0.0%) | 11 (7.6%) |
| 1 Vehicle | 25 (21.7%) | 64 (44.1%) |
| 2 Vehicles | 58 (50.4%) | 64 (44.1%) |
| 3 Vehicles | 22 (19.1%) | 2 (1.4%) |
| 4 Vehicles | 10 (8.7%) | 4 (2.8%) |
| 5 or more Vehicles | 0 (0.0%) | 0 (0.0%) |
| Total | 115 (100.0%) | 145 (100.0%) |
Commute Time in Bradenton Beach
The most frequently occuring commute durations in Bradenton Beach are 90 or more minutes (47 commuters, 26.0%), 30 to 34 minutes (35 commuters, 19.3%), and 10 to 14 minutes (24 commuters, 13.3%).
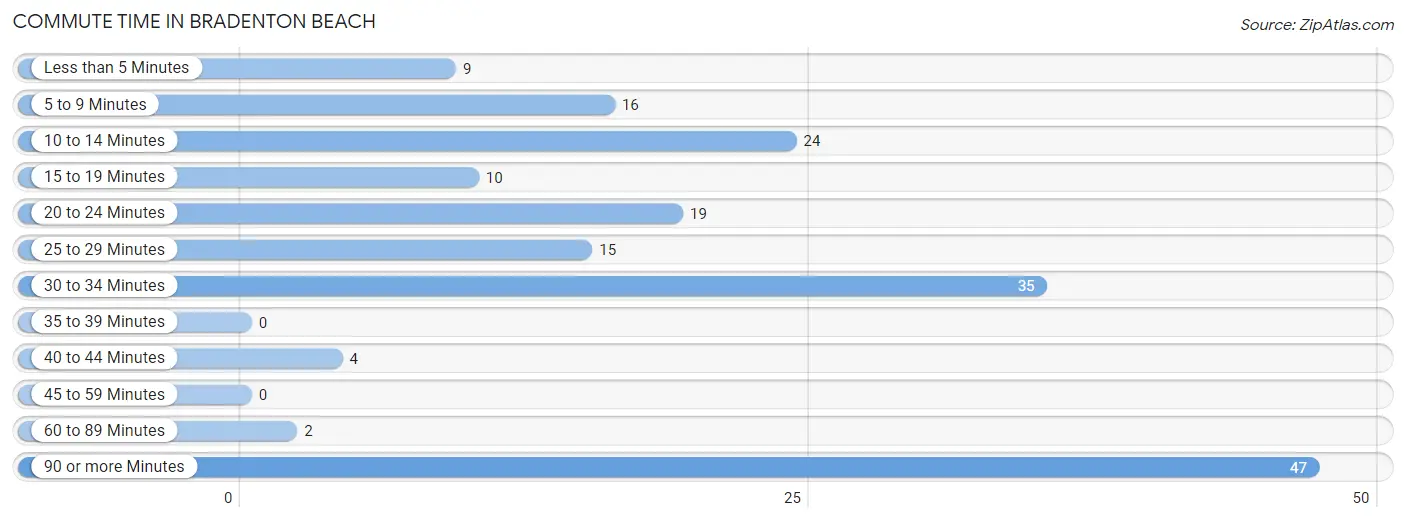
| Commute Time | # Commuters | % Commuters |
| Less than 5 Minutes | 9 | 5.0% |
| 5 to 9 Minutes | 16 | 8.8% |
| 10 to 14 Minutes | 24 | 13.3% |
| 15 to 19 Minutes | 10 | 5.5% |
| 20 to 24 Minutes | 19 | 10.5% |
| 25 to 29 Minutes | 15 | 8.3% |
| 30 to 34 Minutes | 35 | 19.3% |
| 35 to 39 Minutes | 0 | 0.0% |
| 40 to 44 Minutes | 4 | 2.2% |
| 45 to 59 Minutes | 0 | 0.0% |
| 60 to 89 Minutes | 2 | 1.1% |
| 90 or more Minutes | 47 | 26.0% |
Commute Time by Sex in Bradenton Beach
The most common commute times in Bradenton Beach are 30 to 34 minutes (15 commuters, 24.2%) for males and 90 or more minutes (40 commuters, 33.6%) for females.
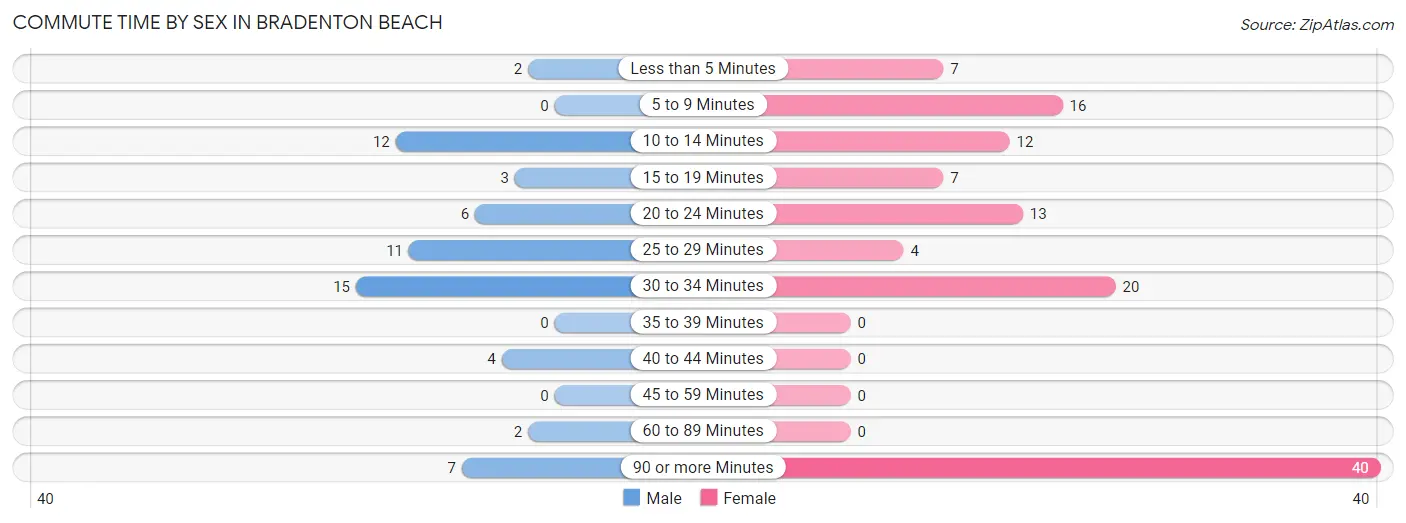
| Commute Time | Male | Female |
| Less than 5 Minutes | 2 (3.2%) | 7 (5.9%) |
| 5 to 9 Minutes | 0 (0.0%) | 16 (13.5%) |
| 10 to 14 Minutes | 12 (19.4%) | 12 (10.1%) |
| 15 to 19 Minutes | 3 (4.8%) | 7 (5.9%) |
| 20 to 24 Minutes | 6 (9.7%) | 13 (10.9%) |
| 25 to 29 Minutes | 11 (17.7%) | 4 (3.4%) |
| 30 to 34 Minutes | 15 (24.2%) | 20 (16.8%) |
| 35 to 39 Minutes | 0 (0.0%) | 0 (0.0%) |
| 40 to 44 Minutes | 4 (6.5%) | 0 (0.0%) |
| 45 to 59 Minutes | 0 (0.0%) | 0 (0.0%) |
| 60 to 89 Minutes | 2 (3.2%) | 0 (0.0%) |
| 90 or more Minutes | 7 (11.3%) | 40 (33.6%) |
Time of Departure to Work by Sex in Bradenton Beach
The most frequent times of departure to work in Bradenton Beach are 7:30 AM to 7:59 AM (24, 38.7%) for males and 7:30 AM to 7:59 AM (40, 33.6%) for females.
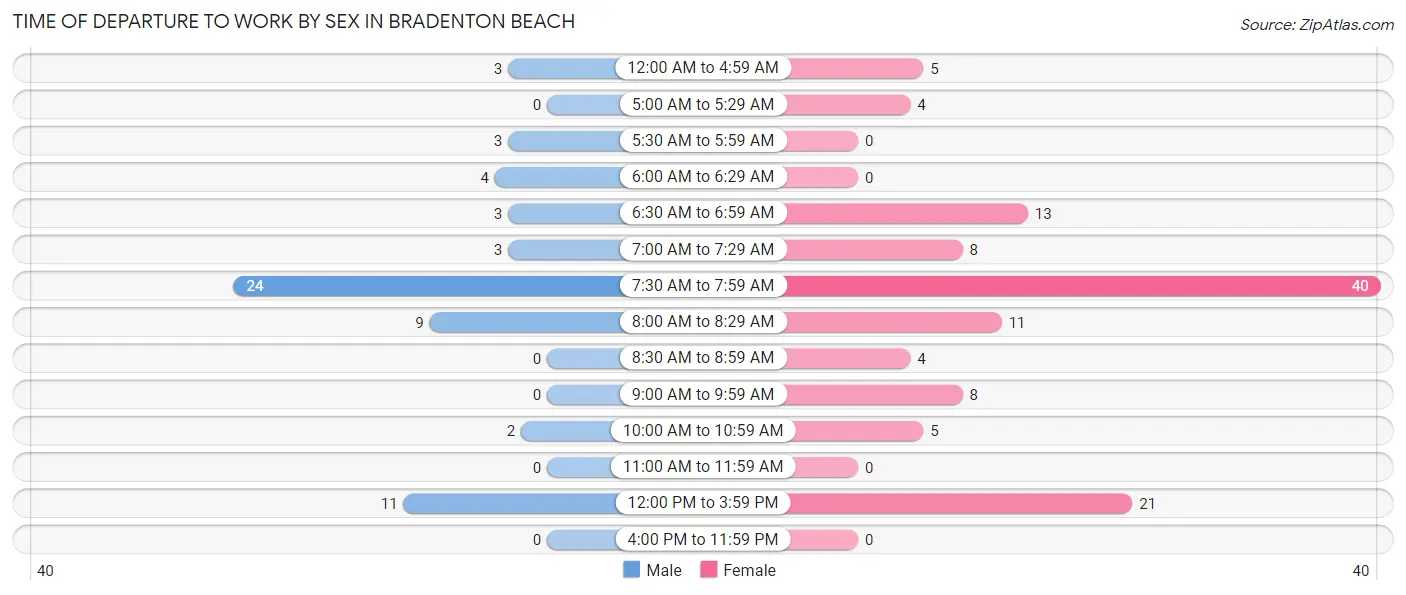
| Time of Departure | Male | Female |
| 12:00 AM to 4:59 AM | 3 (4.8%) | 5 (4.2%) |
| 5:00 AM to 5:29 AM | 0 (0.0%) | 4 (3.4%) |
| 5:30 AM to 5:59 AM | 3 (4.8%) | 0 (0.0%) |
| 6:00 AM to 6:29 AM | 4 (6.5%) | 0 (0.0%) |
| 6:30 AM to 6:59 AM | 3 (4.8%) | 13 (10.9%) |
| 7:00 AM to 7:29 AM | 3 (4.8%) | 8 (6.7%) |
| 7:30 AM to 7:59 AM | 24 (38.7%) | 40 (33.6%) |
| 8:00 AM to 8:29 AM | 9 (14.5%) | 11 (9.2%) |
| 8:30 AM to 8:59 AM | 0 (0.0%) | 4 (3.4%) |
| 9:00 AM to 9:59 AM | 0 (0.0%) | 8 (6.7%) |
| 10:00 AM to 10:59 AM | 2 (3.2%) | 5 (4.2%) |
| 11:00 AM to 11:59 AM | 0 (0.0%) | 0 (0.0%) |
| 12:00 PM to 3:59 PM | 11 (17.7%) | 21 (17.6%) |
| 4:00 PM to 11:59 PM | 0 (0.0%) | 0 (0.0%) |
| Total | 62 (100.0%) | 119 (100.0%) |
Housing Occupancy in Bradenton Beach
Occupancy by Ownership in Bradenton Beach
Of the total 444 dwellings in Bradenton Beach, owner-occupied units account for 360 (81.1%), while renter-occupied units make up 84 (18.9%).
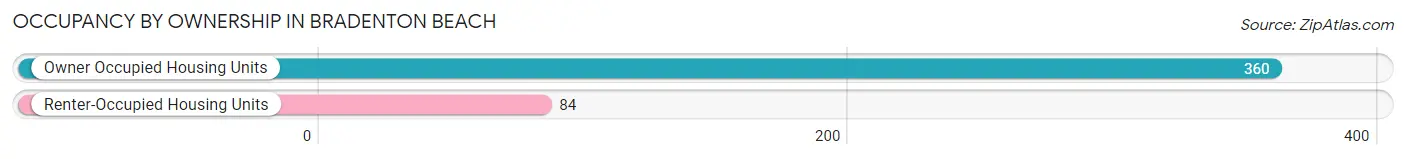
| Occupancy | # Housing Units | % Housing Units |
| Owner Occupied Housing Units | 360 | 81.1% |
| Renter-Occupied Housing Units | 84 | 18.9% |
| Total Occupied Housing Units | 444 | 100.0% |
Occupancy by Household Size in Bradenton Beach
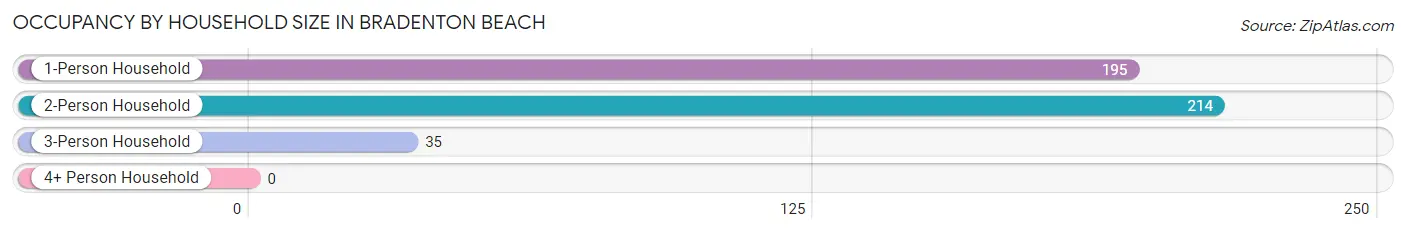
| Household Size | # Housing Units | % Housing Units |
| 1-Person Household | 195 | 43.9% |
| 2-Person Household | 214 | 48.2% |
| 3-Person Household | 35 | 7.9% |
| 4+ Person Household | 0 | 0.0% |
| Total Housing Units | 444 | 100.0% |
Occupancy by Ownership by Household Size in Bradenton Beach
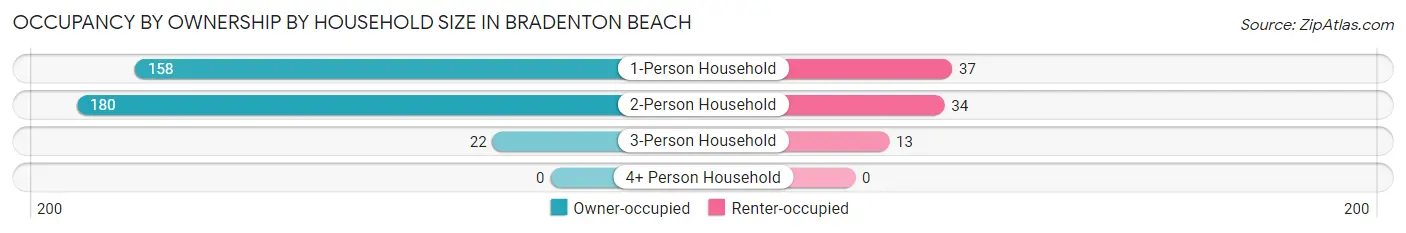
| Household Size | Owner-occupied | Renter-occupied |
| 1-Person Household | 158 (81.0%) | 37 (19.0%) |
| 2-Person Household | 180 (84.1%) | 34 (15.9%) |
| 3-Person Household | 22 (62.9%) | 13 (37.1%) |
| 4+ Person Household | 0 (0.0%) | 0 (0.0%) |
| Total Housing Units | 360 (81.1%) | 84 (18.9%) |
Occupancy by Educational Attainment in Bradenton Beach
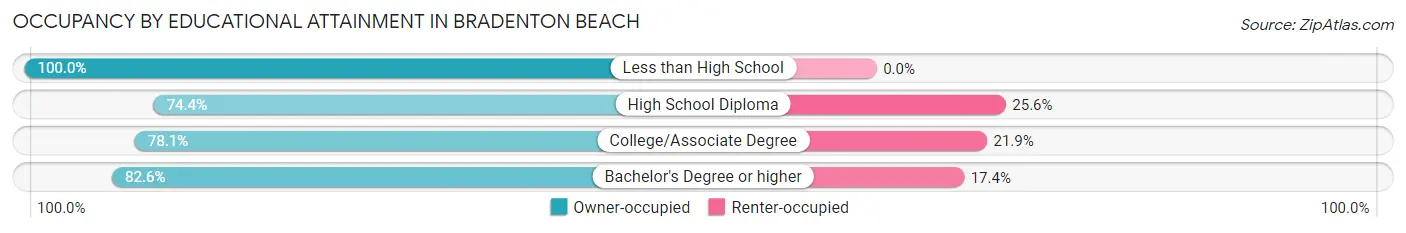
| Household Size | Owner-occupied | Renter-occupied |
| Less than High School | 24 (100.0%) | 0 (0.0%) |
| High School Diploma | 61 (74.4%) | 21 (25.6%) |
| College/Associate Degree | 75 (78.1%) | 21 (21.9%) |
| Bachelor's Degree or higher | 200 (82.6%) | 42 (17.4%) |
Occupancy by Age of Householder in Bradenton Beach
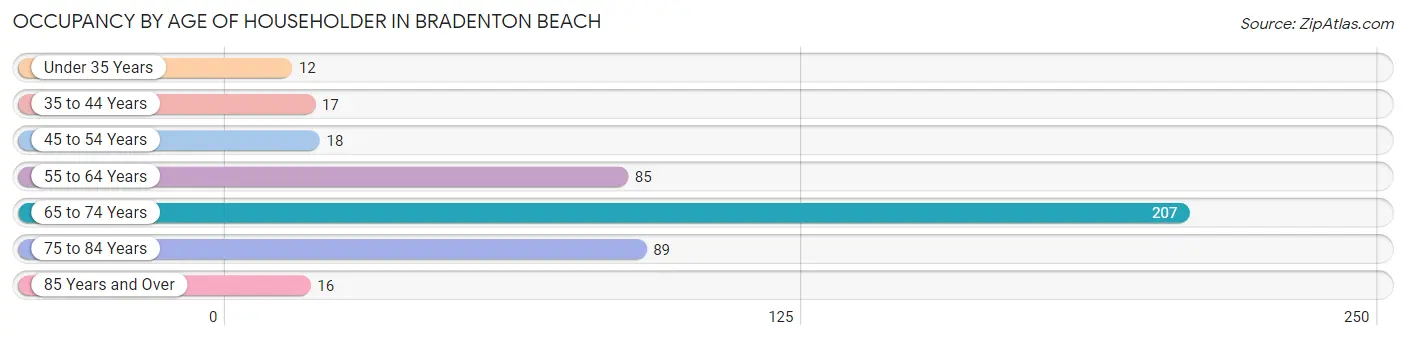
| Age Bracket | # Households | % Households |
| Under 35 Years | 12 | 2.7% |
| 35 to 44 Years | 17 | 3.8% |
| 45 to 54 Years | 18 | 4.1% |
| 55 to 64 Years | 85 | 19.1% |
| 65 to 74 Years | 207 | 46.6% |
| 75 to 84 Years | 89 | 20.1% |
| 85 Years and Over | 16 | 3.6% |
| Total | 444 | 100.0% |
Housing Finances in Bradenton Beach
Median Income by Occupancy in Bradenton Beach
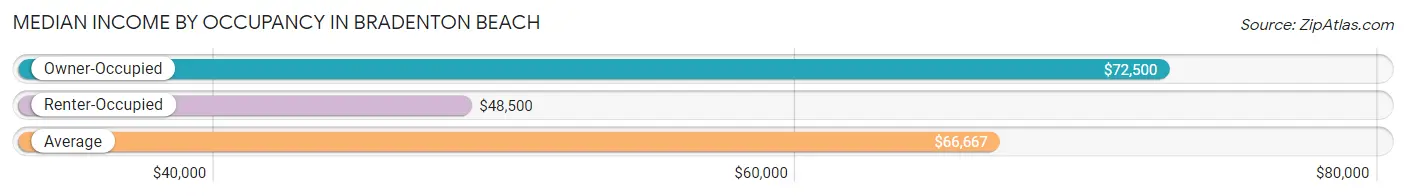
| Occupancy Type | # Households | Median Income |
| Owner-Occupied | 360 (81.1%) | $72,500 |
| Renter-Occupied | 84 (18.9%) | $48,500 |
| Average | 444 (100.0%) | $66,667 |
Occupancy by Householder Income Bracket in Bradenton Beach
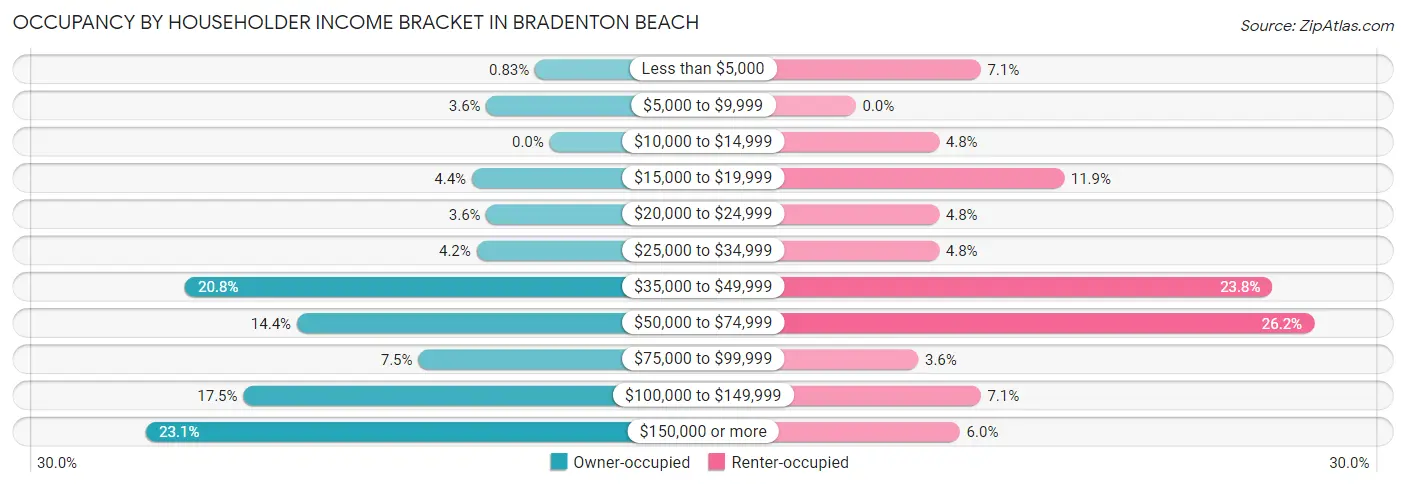
| Income Bracket | Owner-occupied | Renter-occupied |
| Less than $5,000 | 3 (0.8%) | 6 (7.1%) |
| $5,000 to $9,999 | 13 (3.6%) | 0 (0.0%) |
| $10,000 to $14,999 | 0 (0.0%) | 4 (4.8%) |
| $15,000 to $19,999 | 16 (4.4%) | 10 (11.9%) |
| $20,000 to $24,999 | 13 (3.6%) | 4 (4.8%) |
| $25,000 to $34,999 | 15 (4.2%) | 4 (4.8%) |
| $35,000 to $49,999 | 75 (20.8%) | 20 (23.8%) |
| $50,000 to $74,999 | 52 (14.4%) | 22 (26.2%) |
| $75,000 to $99,999 | 27 (7.5%) | 3 (3.6%) |
| $100,000 to $149,999 | 63 (17.5%) | 6 (7.1%) |
| $150,000 or more | 83 (23.1%) | 5 (5.9%) |
| Total | 360 (100.0%) | 84 (100.0%) |
Monthly Housing Cost Tiers in Bradenton Beach
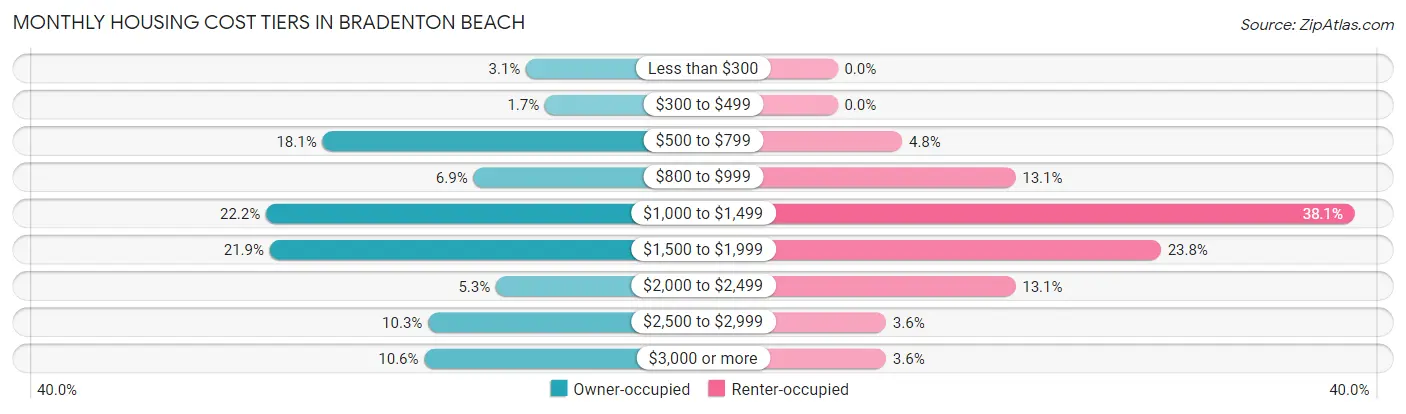
| Monthly Cost | Owner-occupied | Renter-occupied |
| Less than $300 | 11 (3.1%) | 0 (0.0%) |
| $300 to $499 | 6 (1.7%) | 0 (0.0%) |
| $500 to $799 | 65 (18.1%) | 4 (4.8%) |
| $800 to $999 | 25 (6.9%) | 11 (13.1%) |
| $1,000 to $1,499 | 80 (22.2%) | 32 (38.1%) |
| $1,500 to $1,999 | 79 (21.9%) | 20 (23.8%) |
| $2,000 to $2,499 | 19 (5.3%) | 11 (13.1%) |
| $2,500 to $2,999 | 37 (10.3%) | 3 (3.6%) |
| $3,000 or more | 38 (10.6%) | 3 (3.6%) |
| Total | 360 (100.0%) | 84 (100.0%) |
Physical Housing Characteristics in Bradenton Beach
Housing Structures in Bradenton Beach
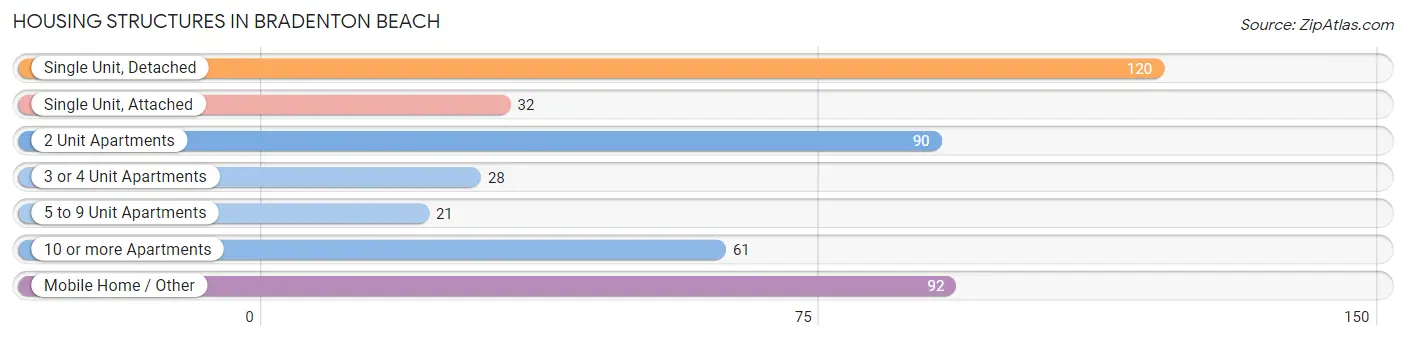
| Structure Type | # Housing Units | % Housing Units |
| Single Unit, Detached | 120 | 27.0% |
| Single Unit, Attached | 32 | 7.2% |
| 2 Unit Apartments | 90 | 20.3% |
| 3 or 4 Unit Apartments | 28 | 6.3% |
| 5 to 9 Unit Apartments | 21 | 4.7% |
| 10 or more Apartments | 61 | 13.7% |
| Mobile Home / Other | 92 | 20.7% |
| Total | 444 | 100.0% |
Housing Structures by Occupancy in Bradenton Beach
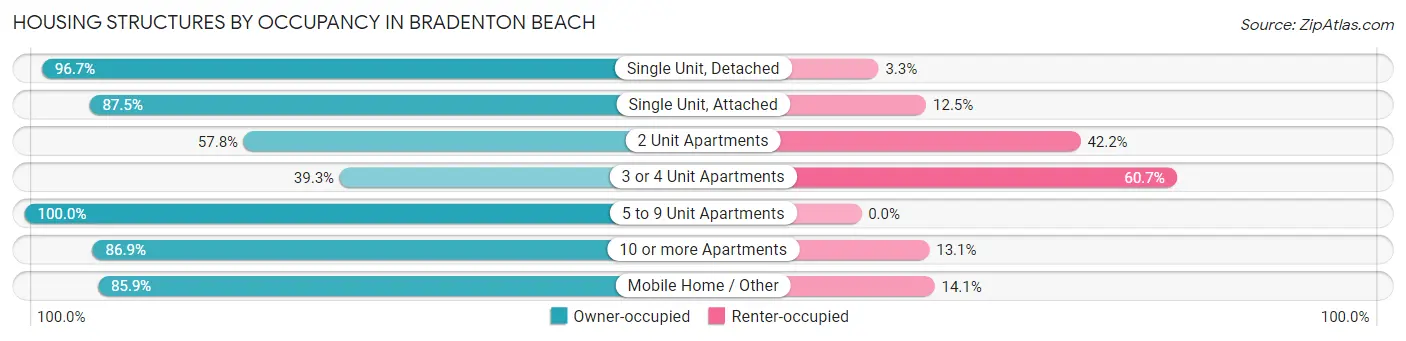
| Structure Type | Owner-occupied | Renter-occupied |
| Single Unit, Detached | 116 (96.7%) | 4 (3.3%) |
| Single Unit, Attached | 28 (87.5%) | 4 (12.5%) |
| 2 Unit Apartments | 52 (57.8%) | 38 (42.2%) |
| 3 or 4 Unit Apartments | 11 (39.3%) | 17 (60.7%) |
| 5 to 9 Unit Apartments | 21 (100.0%) | 0 (0.0%) |
| 10 or more Apartments | 53 (86.9%) | 8 (13.1%) |
| Mobile Home / Other | 79 (85.9%) | 13 (14.1%) |
| Total | 360 (81.1%) | 84 (18.9%) |
Housing Structures by Number of Rooms in Bradenton Beach
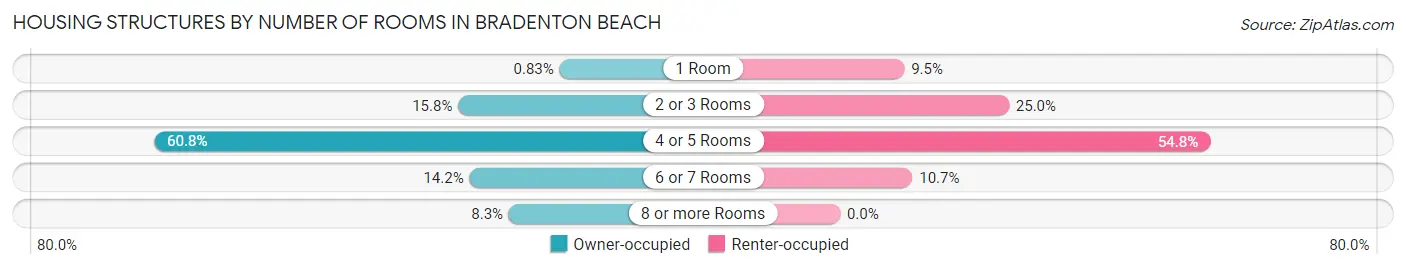
| Number of Rooms | Owner-occupied | Renter-occupied |
| 1 Room | 3 (0.8%) | 8 (9.5%) |
| 2 or 3 Rooms | 57 (15.8%) | 21 (25.0%) |
| 4 or 5 Rooms | 219 (60.8%) | 46 (54.8%) |
| 6 or 7 Rooms | 51 (14.2%) | 9 (10.7%) |
| 8 or more Rooms | 30 (8.3%) | 0 (0.0%) |
| Total | 360 (100.0%) | 84 (100.0%) |
Housing Structure by Heating Type in Bradenton Beach
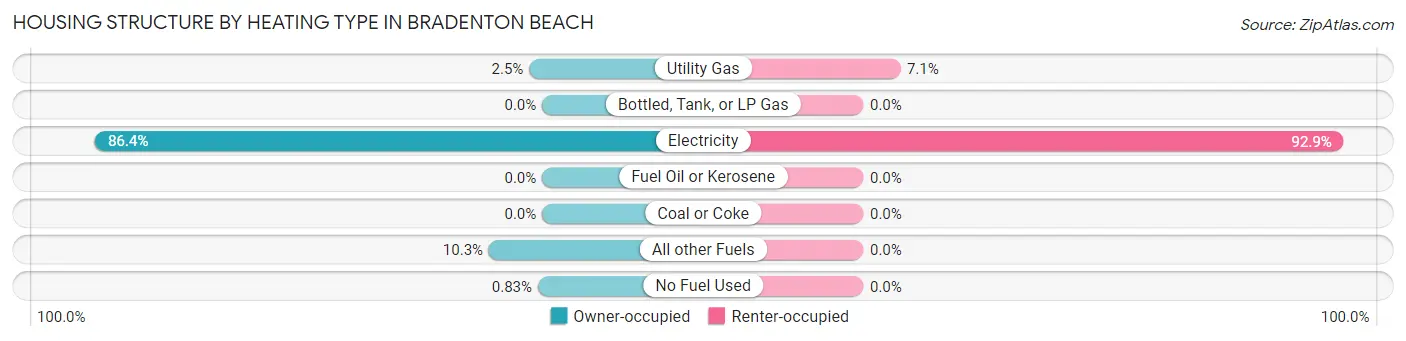
| Heating Type | Owner-occupied | Renter-occupied |
| Utility Gas | 9 (2.5%) | 6 (7.1%) |
| Bottled, Tank, or LP Gas | 0 (0.0%) | 0 (0.0%) |
| Electricity | 311 (86.4%) | 78 (92.9%) |
| Fuel Oil or Kerosene | 0 (0.0%) | 0 (0.0%) |
| Coal or Coke | 0 (0.0%) | 0 (0.0%) |
| All other Fuels | 37 (10.3%) | 0 (0.0%) |
| No Fuel Used | 3 (0.8%) | 0 (0.0%) |
| Total | 360 (100.0%) | 84 (100.0%) |
Household Vehicle Usage in Bradenton Beach
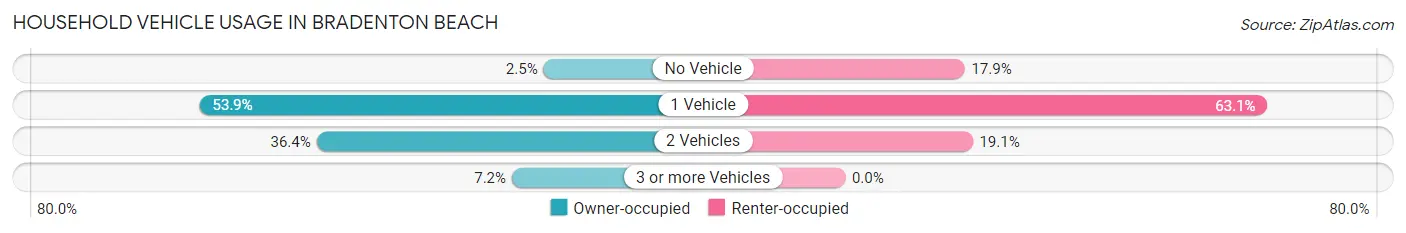
| Vehicles per Household | Owner-occupied | Renter-occupied |
| No Vehicle | 9 (2.5%) | 15 (17.9%) |
| 1 Vehicle | 194 (53.9%) | 53 (63.1%) |
| 2 Vehicles | 131 (36.4%) | 16 (19.1%) |
| 3 or more Vehicles | 26 (7.2%) | 0 (0.0%) |
| Total | 360 (100.0%) | 84 (100.0%) |
Real Estate & Mortgages in Bradenton Beach
Real Estate and Mortgage Overview in Bradenton Beach
| Characteristic | Without Mortgage | With Mortgage |
| Housing Units | 238 | 122 |
| Median Property Value | $452,000 | $306,700 |
| Median Household Income | $85,417 | $15 |
| Monthly Housing Costs | $1,131 | $35 |
| Real Estate Taxes | $5,222 | $12 |
Property Value by Mortgage Status in Bradenton Beach
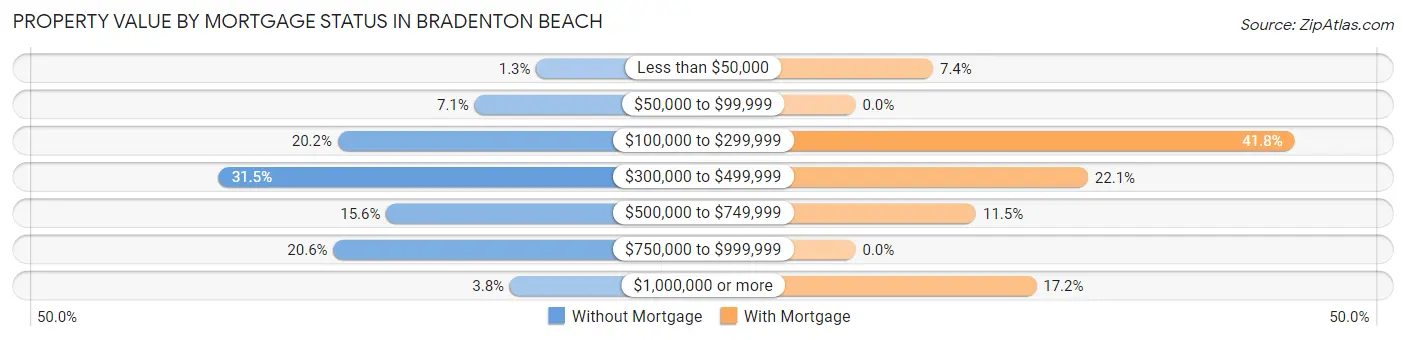
| Property Value | Without Mortgage | With Mortgage |
| Less than $50,000 | 3 (1.3%) | 9 (7.4%) |
| $50,000 to $99,999 | 17 (7.1%) | 0 (0.0%) |
| $100,000 to $299,999 | 48 (20.2%) | 51 (41.8%) |
| $300,000 to $499,999 | 75 (31.5%) | 27 (22.1%) |
| $500,000 to $749,999 | 37 (15.5%) | 14 (11.5%) |
| $750,000 to $999,999 | 49 (20.6%) | 0 (0.0%) |
| $1,000,000 or more | 9 (3.8%) | 21 (17.2%) |
| Total | 238 (100.0%) | 122 (100.0%) |
Household Income by Mortgage Status in Bradenton Beach
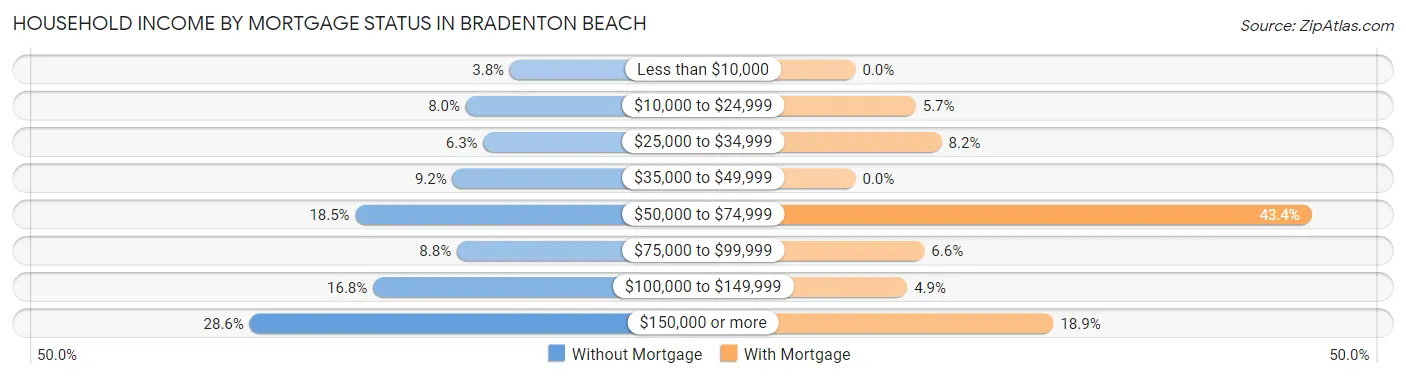
| Household Income | Without Mortgage | With Mortgage |
| Less than $10,000 | 9 (3.8%) | 0 (0.0%) |
| $10,000 to $24,999 | 19 (8.0%) | 7 (5.7%) |
| $25,000 to $34,999 | 15 (6.3%) | 10 (8.2%) |
| $35,000 to $49,999 | 22 (9.2%) | 0 (0.0%) |
| $50,000 to $74,999 | 44 (18.5%) | 53 (43.4%) |
| $75,000 to $99,999 | 21 (8.8%) | 8 (6.6%) |
| $100,000 to $149,999 | 40 (16.8%) | 6 (4.9%) |
| $150,000 or more | 68 (28.6%) | 23 (18.9%) |
| Total | 238 (100.0%) | 122 (100.0%) |
Property Value to Household Income Ratio in Bradenton Beach
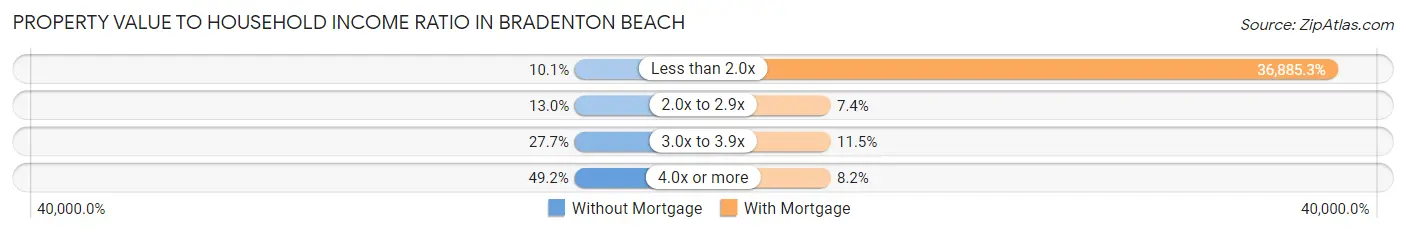
| Value-to-Income Ratio | Without Mortgage | With Mortgage |
| Less than 2.0x | 24 (10.1%) | 45,000 (36,885.3%) |
| 2.0x to 2.9x | 31 (13.0%) | 9 (7.4%) |
| 3.0x to 3.9x | 66 (27.7%) | 14 (11.5%) |
| 4.0x or more | 117 (49.2%) | 10 (8.2%) |
| Total | 238 (100.0%) | 122 (100.0%) |
Real Estate Taxes by Mortgage Status in Bradenton Beach
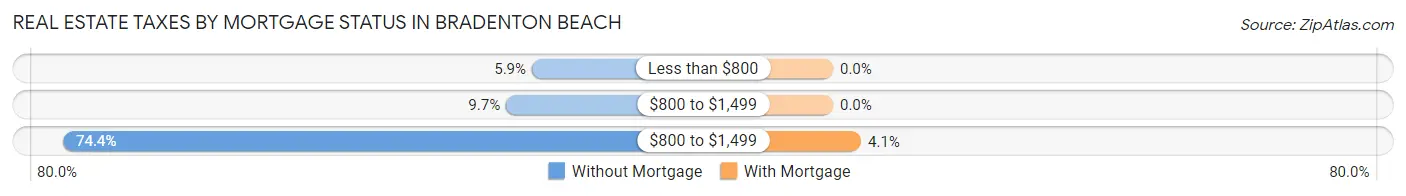
| Property Taxes | Without Mortgage | With Mortgage |
| Less than $800 | 14 (5.9%) | 0 (0.0%) |
| $800 to $1,499 | 23 (9.7%) | 0 (0.0%) |
| $800 to $1,499 | 177 (74.4%) | 5 (4.1%) |
| Total | 238 (100.0%) | 122 (100.0%) |
Health & Disability in Bradenton Beach
Health Insurance Coverage by Age in Bradenton Beach
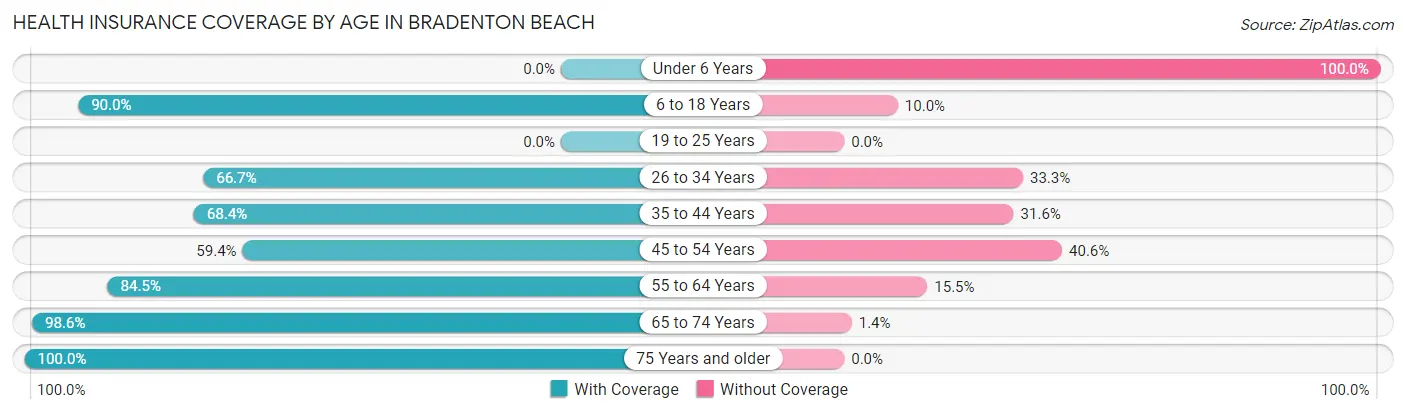
| Age Bracket | With Coverage | Without Coverage |
| Under 6 Years | 0 (0.0%) | 4 (100.0%) |
| 6 to 18 Years | 27 (90.0%) | 3 (10.0%) |
| 19 to 25 Years | 0 (0.0%) | 0 (0.0%) |
| 26 to 34 Years | 20 (66.7%) | 10 (33.3%) |
| 35 to 44 Years | 13 (68.4%) | 6 (31.6%) |
| 45 to 54 Years | 19 (59.4%) | 13 (40.6%) |
| 55 to 64 Years | 120 (84.5%) | 22 (15.5%) |
| 65 to 74 Years | 282 (98.6%) | 4 (1.4%) |
| 75 Years and older | 194 (100.0%) | 0 (0.0%) |
| Total | 675 (91.6%) | 62 (8.4%) |
Health Insurance Coverage by Citizenship Status in Bradenton Beach
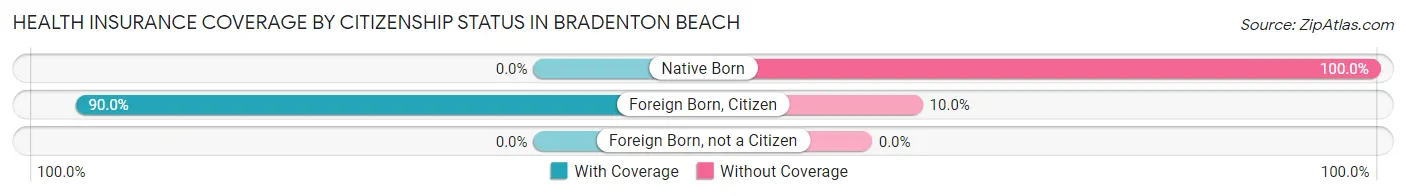
| Citizenship Status | With Coverage | Without Coverage |
| Native Born | 0 (0.0%) | 4 (100.0%) |
| Foreign Born, Citizen | 27 (90.0%) | 3 (10.0%) |
| Foreign Born, not a Citizen | 0 (0.0%) | 0 (0.0%) |
Health Insurance Coverage by Household Income in Bradenton Beach
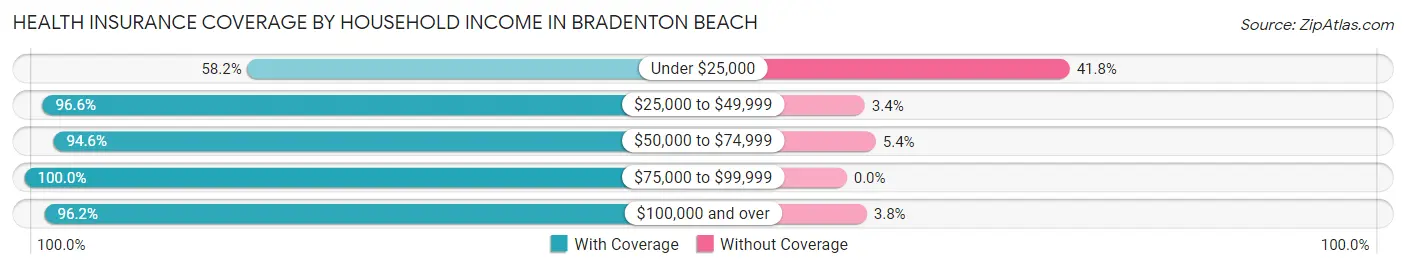
| Household Income | With Coverage | Without Coverage |
| Under $25,000 | 53 (58.2%) | 38 (41.8%) |
| $25,000 to $49,999 | 171 (96.6%) | 6 (3.4%) |
| $50,000 to $74,999 | 139 (94.6%) | 8 (5.4%) |
| $75,000 to $99,999 | 56 (100.0%) | 0 (0.0%) |
| $100,000 and over | 256 (96.2%) | 10 (3.8%) |
Public vs Private Health Insurance Coverage by Age in Bradenton Beach
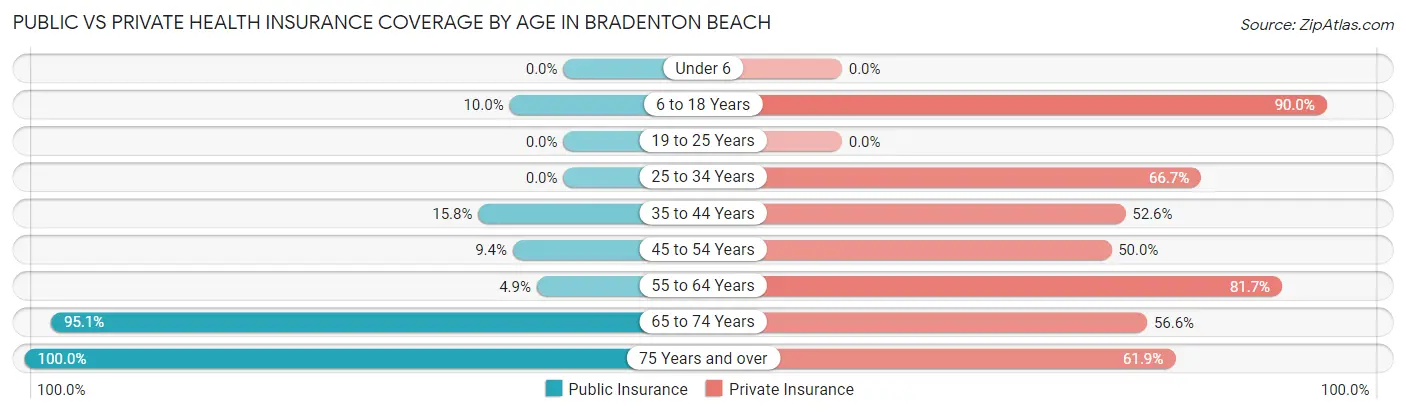
| Age Bracket | Public Insurance | Private Insurance |
| Under 6 | 0 (0.0%) | 0 (0.0%) |
| 6 to 18 Years | 3 (10.0%) | 27 (90.0%) |
| 19 to 25 Years | 0 (0.0%) | 0 (0.0%) |
| 25 to 34 Years | 0 (0.0%) | 20 (66.7%) |
| 35 to 44 Years | 3 (15.8%) | 10 (52.6%) |
| 45 to 54 Years | 3 (9.4%) | 16 (50.0%) |
| 55 to 64 Years | 7 (4.9%) | 116 (81.7%) |
| 65 to 74 Years | 272 (95.1%) | 162 (56.6%) |
| 75 Years and over | 194 (100.0%) | 120 (61.9%) |
| Total | 482 (65.4%) | 471 (63.9%) |
Disability Status by Sex by Age in Bradenton Beach
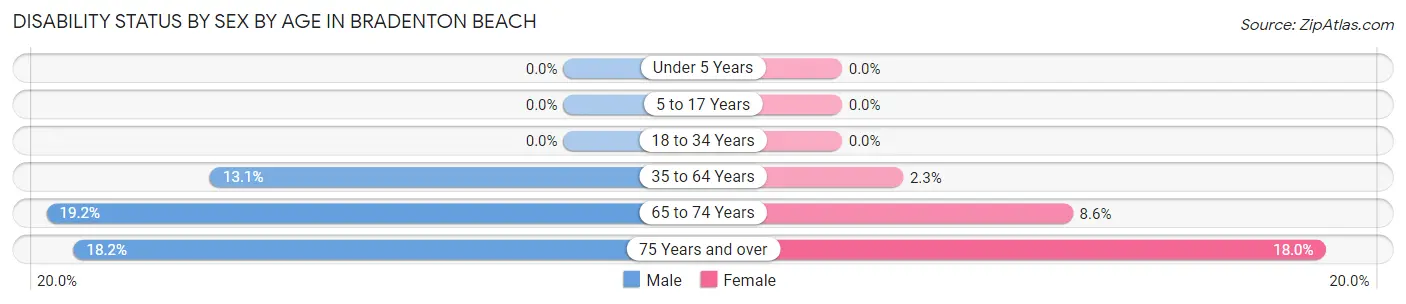
| Age Bracket | Male | Female |
| Under 5 Years | 0 (0.0%) | 0 (0.0%) |
| 5 to 17 Years | 0 (0.0%) | 0 (0.0%) |
| 18 to 34 Years | 0 (0.0%) | 0 (0.0%) |
| 35 to 64 Years | 8 (13.1%) | 3 (2.3%) |
| 65 to 74 Years | 28 (19.2%) | 12 (8.6%) |
| 75 Years and over | 14 (18.2%) | 21 (17.9%) |
Disability Class by Sex by Age in Bradenton Beach
Disability Class: Hearing Difficulty
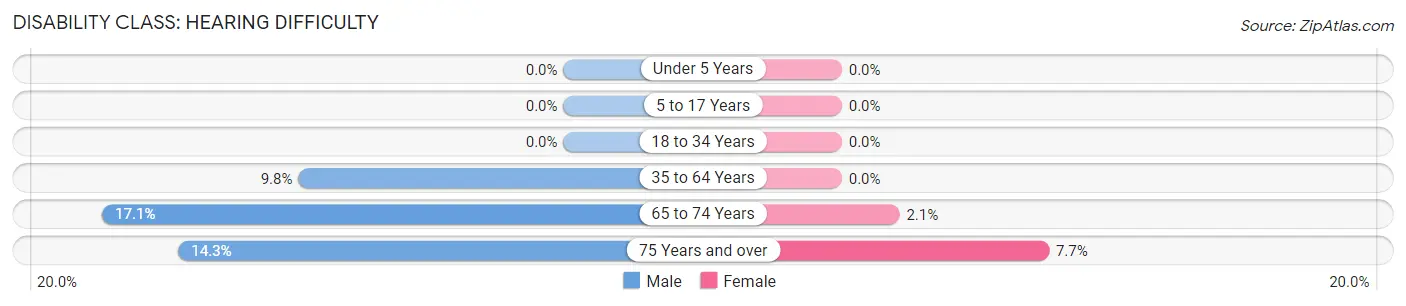
| Age Bracket | Male | Female |
| Under 5 Years | 0 (0.0%) | 0 (0.0%) |
| 5 to 17 Years | 0 (0.0%) | 0 (0.0%) |
| 18 to 34 Years | 0 (0.0%) | 0 (0.0%) |
| 35 to 64 Years | 6 (9.8%) | 0 (0.0%) |
| 65 to 74 Years | 25 (17.1%) | 3 (2.1%) |
| 75 Years and over | 11 (14.3%) | 9 (7.7%) |
Disability Class: Vision Difficulty
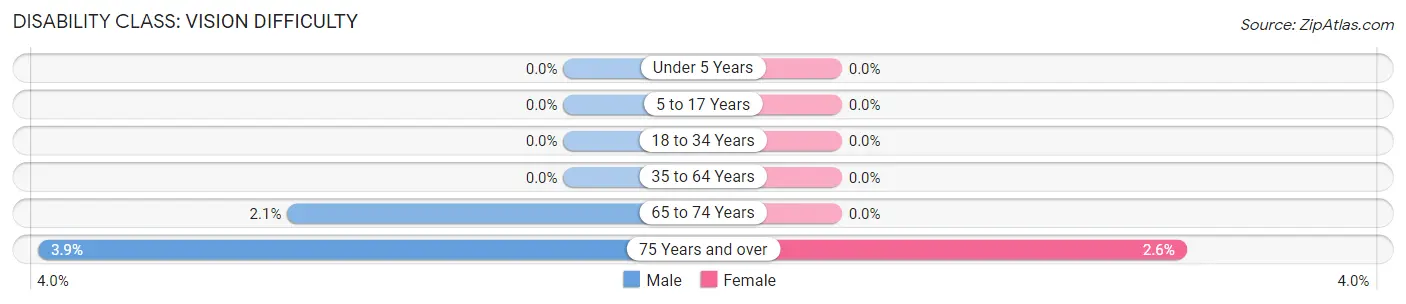
| Age Bracket | Male | Female |
| Under 5 Years | 0 (0.0%) | 0 (0.0%) |
| 5 to 17 Years | 0 (0.0%) | 0 (0.0%) |
| 18 to 34 Years | 0 (0.0%) | 0 (0.0%) |
| 35 to 64 Years | 0 (0.0%) | 0 (0.0%) |
| 65 to 74 Years | 3 (2.1%) | 0 (0.0%) |
| 75 Years and over | 3 (3.9%) | 3 (2.6%) |
Disability Class: Cognitive Difficulty
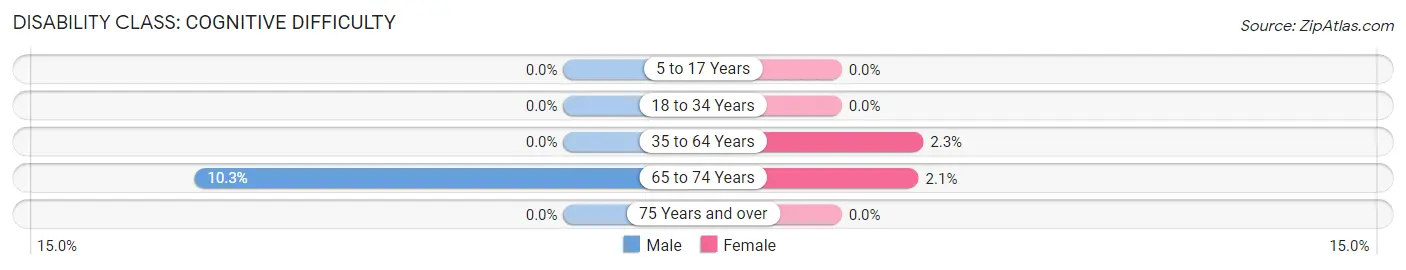
| Age Bracket | Male | Female |
| 5 to 17 Years | 0 (0.0%) | 0 (0.0%) |
| 18 to 34 Years | 0 (0.0%) | 0 (0.0%) |
| 35 to 64 Years | 0 (0.0%) | 3 (2.3%) |
| 65 to 74 Years | 15 (10.3%) | 3 (2.1%) |
| 75 Years and over | 0 (0.0%) | 0 (0.0%) |
Disability Class: Ambulatory Difficulty
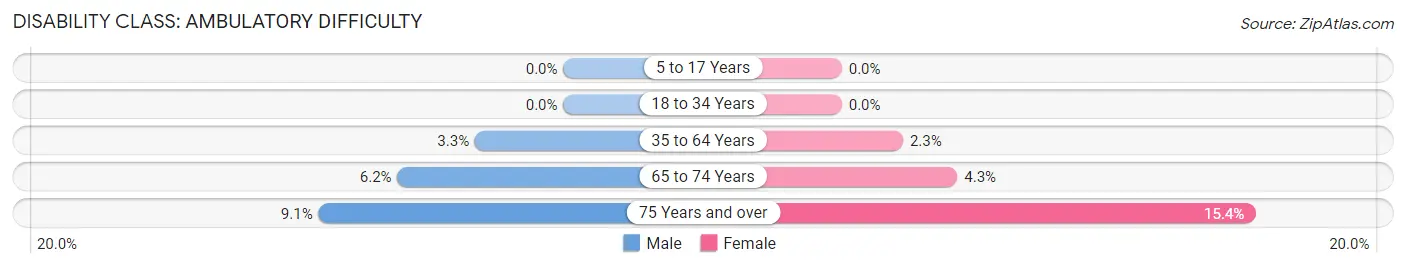
| Age Bracket | Male | Female |
| 5 to 17 Years | 0 (0.0%) | 0 (0.0%) |
| 18 to 34 Years | 0 (0.0%) | 0 (0.0%) |
| 35 to 64 Years | 2 (3.3%) | 3 (2.3%) |
| 65 to 74 Years | 9 (6.2%) | 6 (4.3%) |
| 75 Years and over | 7 (9.1%) | 18 (15.4%) |
Disability Class: Self-Care Difficulty
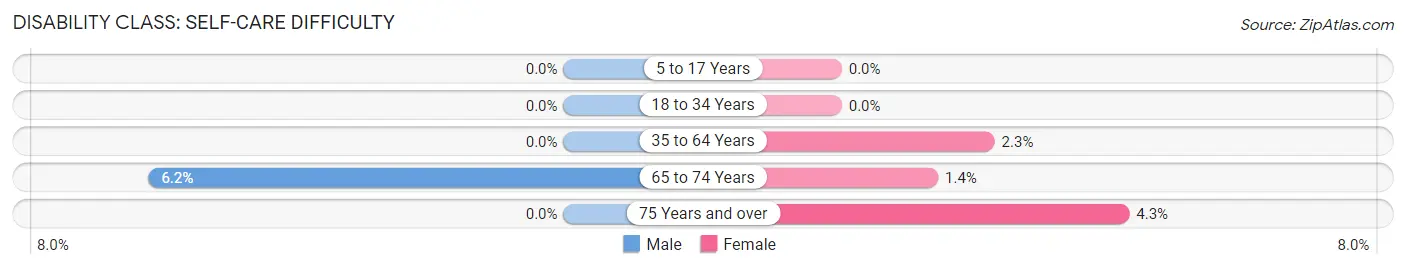
| Age Bracket | Male | Female |
| 5 to 17 Years | 0 (0.0%) | 0 (0.0%) |
| 18 to 34 Years | 0 (0.0%) | 0 (0.0%) |
| 35 to 64 Years | 0 (0.0%) | 3 (2.3%) |
| 65 to 74 Years | 9 (6.2%) | 2 (1.4%) |
| 75 Years and over | 0 (0.0%) | 5 (4.3%) |
Technology Access in Bradenton Beach
Computing Device Access in Bradenton Beach
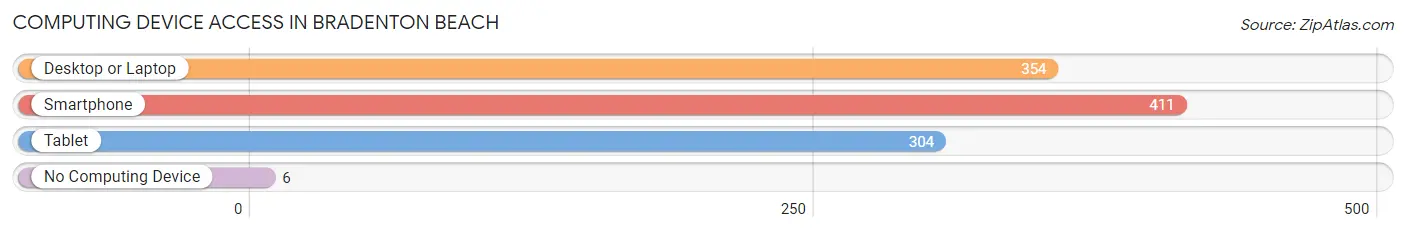
| Device Type | # Households | % Households |
| Desktop or Laptop | 354 | 79.7% |
| Smartphone | 411 | 92.6% |
| Tablet | 304 | 68.5% |
| No Computing Device | 6 | 1.3% |
| Total | 444 | 100.0% |
Internet Access in Bradenton Beach
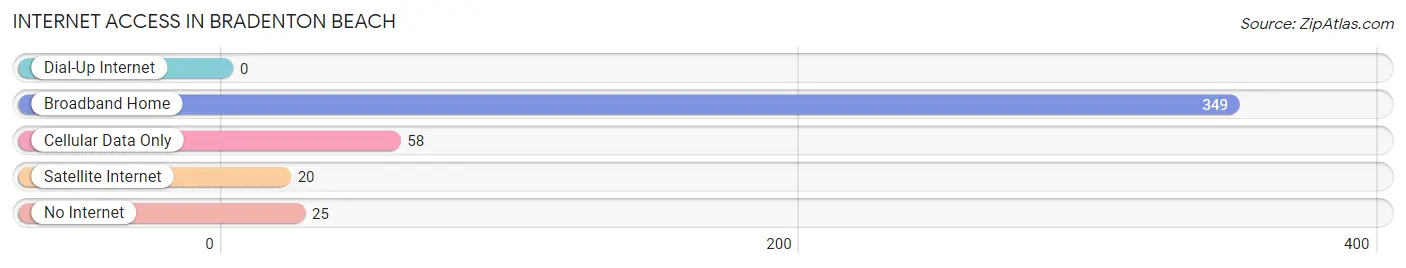
| Internet Type | # Households | % Households |
| Dial-Up Internet | 0 | 0.0% |
| Broadband Home | 349 | 78.6% |
| Cellular Data Only | 58 | 13.1% |
| Satellite Internet | 20 | 4.5% |
| No Internet | 25 | 5.6% |
| Total | 444 | 100.0% |
Bradenton Beach Summary
Bradenton Beach is a city located on Anna Maria Island in Manatee County, Florida. It is part of the Bradenton-Sarasota-Venice Metropolitan Statistical Area. The city has a population of 1,482 as of the 2010 census.
History
Bradenton Beach was first settled in the late 1800s by homesteaders. The city was incorporated in 1945 and was named after the nearby city of Bradenton. The city was originally a fishing village and was known for its seafood industry. In the 1950s, the city began to develop as a tourist destination and the population began to grow.
Geography
Bradenton Beach is located on the southern tip of Anna Maria Island in Manatee County, Florida. The city is bordered by the Gulf of Mexico to the west and Tampa Bay to the east. The city has a total area of 0.9 square miles, all of which is land. The city has a tropical climate with hot, humid summers and mild winters.
Economy
The economy of Bradenton Beach is largely based on tourism. The city is home to several resorts, hotels, and restaurants that cater to tourists. The city also has a thriving fishing industry, with many local businesses specializing in seafood. The city also has a number of retail stores and other businesses that serve the local population.
Demographics
As of the 2010 census, there were 1,482 people, 745 households, and 397 families residing in the city. The population density was 1,637.2 people per square mile. The racial makeup of the city was 94.2% White, 1.2% African American, 0.2% Native American, 0.7% Asian, 0.1% Pacific Islander, 1.7% from other races, and 1.9% from two or more races. Hispanic or Latino of any race were 5.2% of the population.
The median income for a household in the city was $41,944, and the median income for a family was $50,000. The per capita income for the city was $25,945. About 8.2% of families and 11.2% of the population were below the poverty line, including 16.2% of those under age 18 and 4.2% of those age 65 or over.
Common Questions
What is Per Capita Income in Bradenton Beach?
Per Capita income in Bradenton Beach is $64,896.
What is the Median Family Income in Bradenton Beach?
Median Family Income in Bradenton Beach is $72,019.
What is the Median Household income in Bradenton Beach?
Median Household Income in Bradenton Beach is $66,667.
What is Income or Wage Gap in Bradenton Beach?
Income or Wage Gap in Bradenton Beach is 40.2%.
Women in Bradenton Beach earn 59.8 cents for every dollar earned by a man.
What is Inequality or Gini Index in Bradenton Beach?
Inequality or Gini Index in Bradenton Beach is 0.50.
What is the Total Population of Bradenton Beach?
Total Population of Bradenton Beach is 737.
What is the Total Male Population of Bradenton Beach?
Total Male Population of Bradenton Beach is 319.
What is the Total Female Population of Bradenton Beach?
Total Female Population of Bradenton Beach is 418.
What is the Ratio of Males per 100 Females in Bradenton Beach?
There are 76.32 Males per 100 Females in Bradenton Beach.
What is the Ratio of Females per 100 Males in Bradenton Beach?
There are 131.03 Females per 100 Males in Bradenton Beach.
What is the Median Population Age in Bradenton Beach?
Median Population Age in Bradenton Beach is 70.0 Years.
What is the Average Family Size in Bradenton Beach
Average Family Size in Bradenton Beach is 2.1 People.
What is the Average Household Size in Bradenton Beach
Average Household Size in Bradenton Beach is 1.7 People.
How Large is the Labor Force in Bradenton Beach?
There are 275 People in the Labor Forcein in Bradenton Beach.
What is the Percentage of People in the Labor Force in Bradenton Beach?
39.0% of People are in the Labor Force in Bradenton Beach.
What is the Unemployment Rate in Bradenton Beach?
Unemployment Rate in Bradenton Beach is 2.5%.