Babson Park, FL Map & Demographics
Babson Park Map
Babson Park Overview
$29,289
PER CAPITA INCOME
$53,542
AVG FAMILY INCOME
$58,750
AVG HOUSEHOLD INCOME
0.62
INEQUALITY / GINI INDEX
1,071
TOTAL POPULATION
481
MALE POPULATION
590
FEMALE POPULATION
81.53
MALES / 100 FEMALES
122.66
FEMALES / 100 MALES
22.0
MEDIAN AGE
2.7
AVG FAMILY SIZE
3.0
AVG HOUSEHOLD SIZE
410
LABOR FORCE [ PEOPLE ]
42.9%
PERCENT IN LABOR FORCE
Babson Park Zip Codes
Babson Park Area Codes
Income in Babson Park
Income Overview in Babson Park
Per Capita Income in Babson Park is $29,289, while median incomes of families and households are $53,542 and $58,750 respectively.
| Characteristic | Number | Measure |
| Per Capita Income | 1,071 | $29,289 |
| Median Family Income | 178 | $53,542 |
| Mean Family Income | 178 | $130,061 |
| Median Household Income | 249 | $58,750 |
| Mean Household Income | 249 | $118,313 |
| Income Deficit | 178 | $0 |
| Wage / Income Gap (%) | 1,071 | 0.00% |
| Wage / Income Gap ($) | 1,071 | 100.00¢ per $1 |
| Gini / Inequality Index | 1,071 | 0.62 |
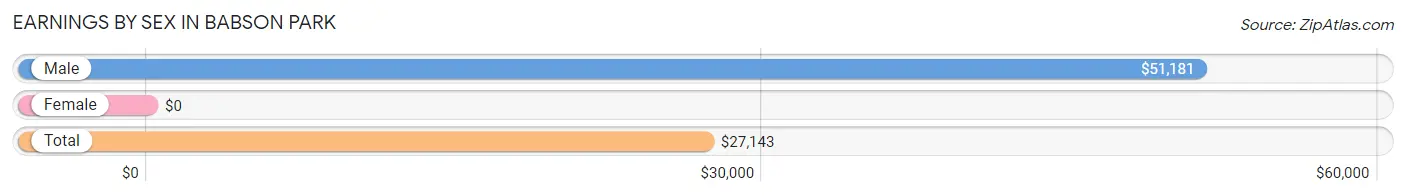
Earnings by Sex in Babson Park
| Sex | Number | Average Earnings |
| Male | 229 (52.8%) | $51,181 |
| Female | 205 (47.2%) | $0 |
| Total | 434 (100.0%) | $27,143 |
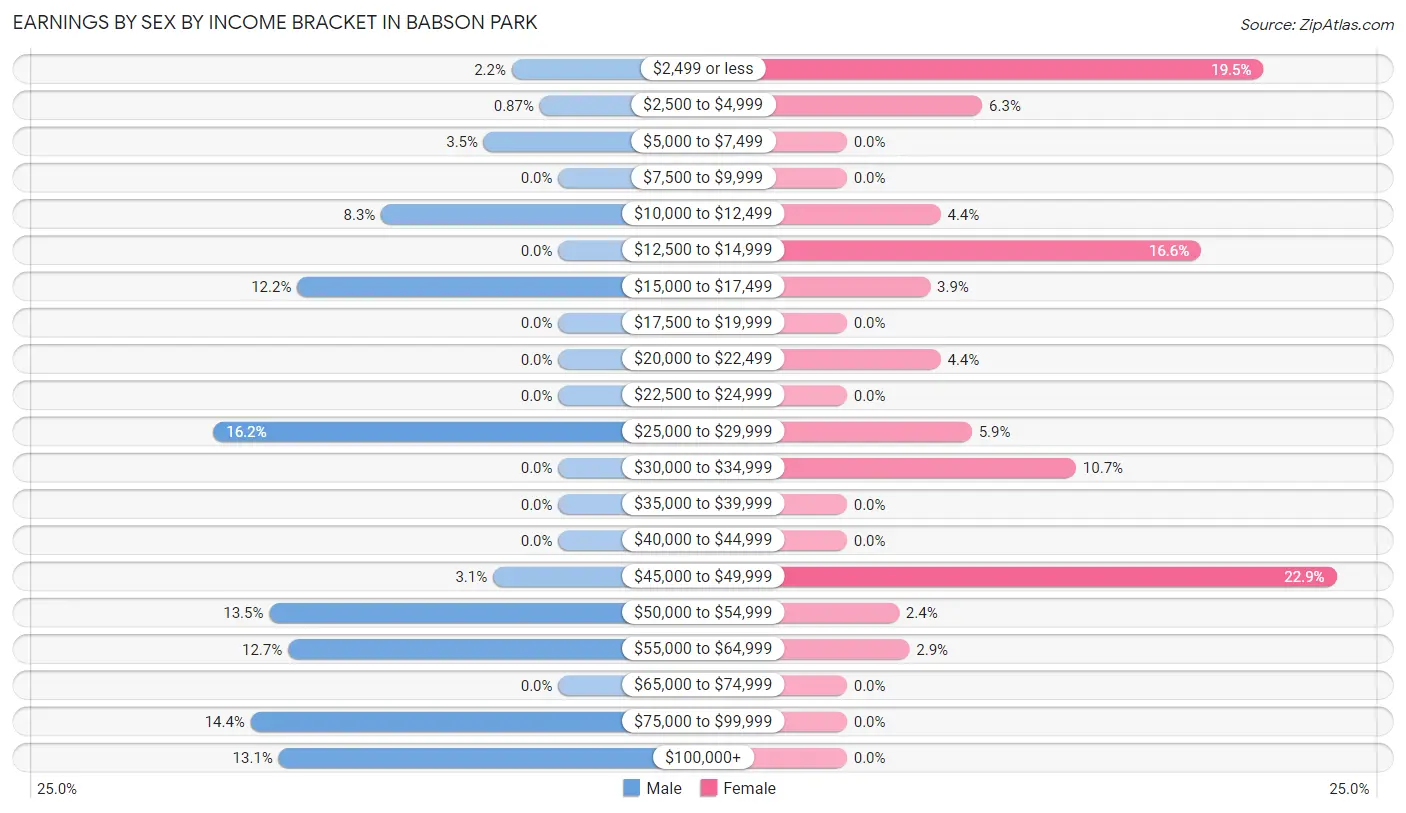
Earnings by Sex by Income Bracket in Babson Park
The most common earnings brackets in Babson Park are $25,000 to $29,999 for men (37 | 16.2%) and $45,000 to $49,999 for women (47 | 22.9%).
| Income | Male | Female |
| $2,499 or less | 5 (2.2%) | 40 (19.5%) |
| $2,500 to $4,999 | 2 (0.9%) | 13 (6.3%) |
| $5,000 to $7,499 | 8 (3.5%) | 0 (0.0%) |
| $7,500 to $9,999 | 0 (0.0%) | 0 (0.0%) |
| $10,000 to $12,499 | 19 (8.3%) | 9 (4.4%) |
| $12,500 to $14,999 | 0 (0.0%) | 34 (16.6%) |
| $15,000 to $17,499 | 28 (12.2%) | 8 (3.9%) |
| $17,500 to $19,999 | 0 (0.0%) | 0 (0.0%) |
| $20,000 to $22,499 | 0 (0.0%) | 9 (4.4%) |
| $22,500 to $24,999 | 0 (0.0%) | 0 (0.0%) |
| $25,000 to $29,999 | 37 (16.2%) | 12 (5.9%) |
| $30,000 to $34,999 | 0 (0.0%) | 22 (10.7%) |
| $35,000 to $39,999 | 0 (0.0%) | 0 (0.0%) |
| $40,000 to $44,999 | 0 (0.0%) | 0 (0.0%) |
| $45,000 to $49,999 | 7 (3.1%) | 47 (22.9%) |
| $50,000 to $54,999 | 31 (13.5%) | 5 (2.4%) |
| $55,000 to $64,999 | 29 (12.7%) | 6 (2.9%) |
| $65,000 to $74,999 | 0 (0.0%) | 0 (0.0%) |
| $75,000 to $99,999 | 33 (14.4%) | 0 (0.0%) |
| $100,000+ | 30 (13.1%) | 0 (0.0%) |
| Total | 229 (100.0%) | 205 (100.0%) |
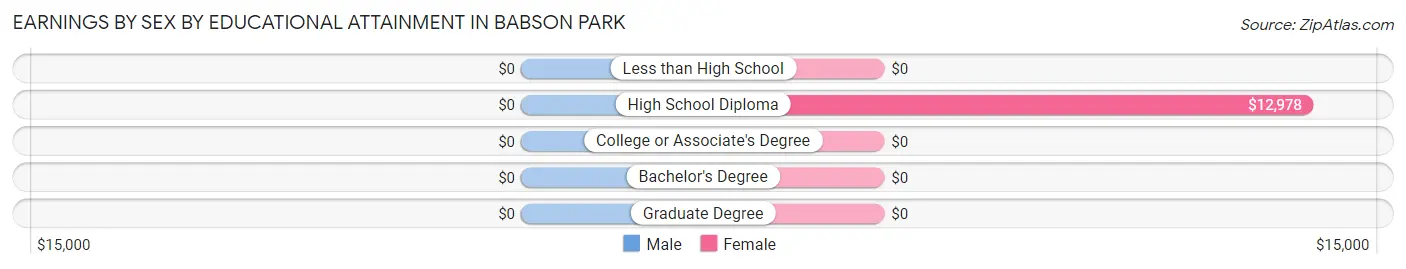
Earnings by Sex by Educational Attainment in Babson Park
| Educational Attainment | Male Income | Female Income |
| Less than High School | - | - |
| High School Diploma | - | - |
| College or Associate's Degree | - | - |
| Bachelor's Degree | - | - |
| Graduate Degree | - | - |
| Total | $55,043 | $26,667 |
Family Income in Babson Park
Family Income Brackets in Babson Park
According to the Babson Park family income data, there are 47 families falling into the $35,000 to $49,999 income range, which is the most common income bracket and makes up 26.4% of all families.
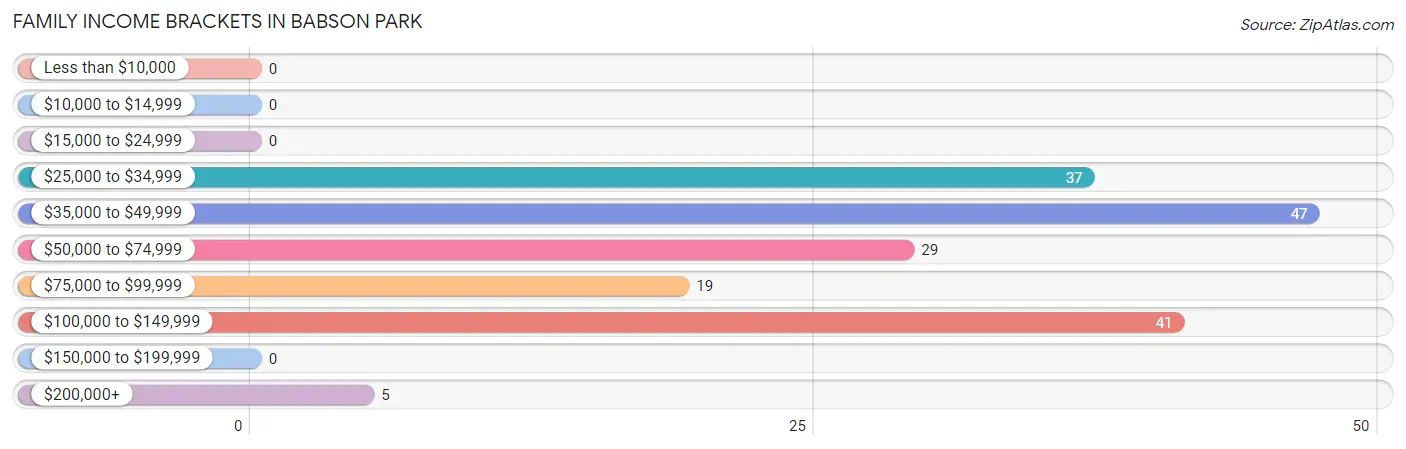
| Income Bracket | # Families | % Families |
| Less than $10,000 | 0 | 0.0% |
| $10,000 to $14,999 | 0 | 0.0% |
| $15,000 to $24,999 | 0 | 0.0% |
| $25,000 to $34,999 | 37 | 20.8% |
| $35,000 to $49,999 | 47 | 26.4% |
| $50,000 to $74,999 | 29 | 16.3% |
| $75,000 to $99,999 | 19 | 10.7% |
| $100,000 to $149,999 | 41 | 23.0% |
| $150,000 to $199,999 | 0 | 0.0% |
| $200,000+ | 5 | 2.8% |
Family Income by Famaliy Size in Babson Park
2-person families (123 | 69.1%) account for the highest median family income in Babson Park with $46,303 per family, while 2-person families (123 | 69.1%) have the highest median income of $23,152 per family member.
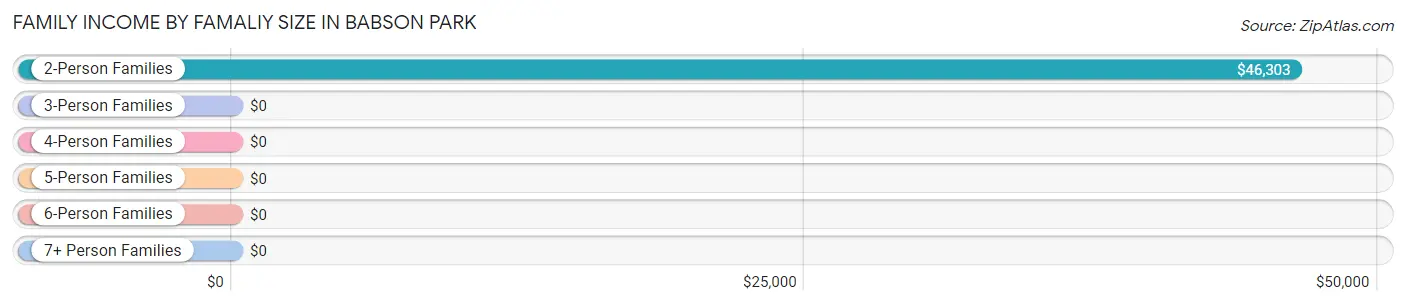
| Income Bracket | # Families | Median Income |
| 2-Person Families | 123 (69.1%) | $46,303 |
| 3-Person Families | 0 (0.0%) | $0 |
| 4-Person Families | 41 (23.0%) | $0 |
| 5-Person Families | 8 (4.5%) | $0 |
| 6-Person Families | 0 (0.0%) | $0 |
| 7+ Person Families | 6 (3.4%) | $0 |
| Total | 178 (100.0%) | $53,542 |
Family Income by Number of Earners in Babson Park
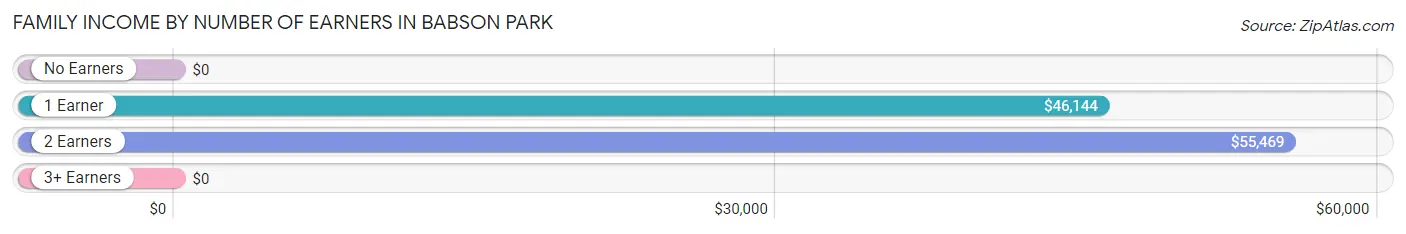
| Number of Earners | # Families | Median Income |
| No Earners | 0 (0.0%) | $0 |
| 1 Earner | 117 (65.7%) | $46,144 |
| 2 Earners | 27 (15.2%) | $55,469 |
| 3+ Earners | 34 (19.1%) | $0 |
| Total | 178 (100.0%) | $53,542 |
Household Income in Babson Park
Household Income Brackets in Babson Park
With 66 households falling in the category, the $50,000 to $74,999 income range is the most frequent in Babson Park, accounting for 26.5% of all households.
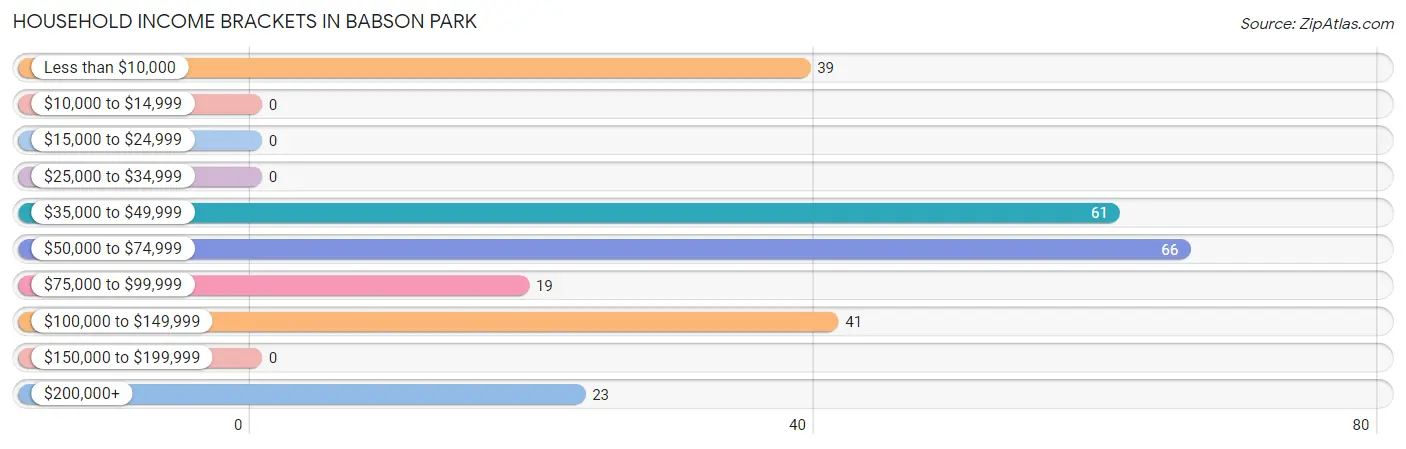
| Income Bracket | # Households | % Households |
| Less than $10,000 | 39 | 15.7% |
| $10,000 to $14,999 | 0 | 0.0% |
| $15,000 to $24,999 | 0 | 0.0% |
| $25,000 to $34,999 | 0 | 0.0% |
| $35,000 to $49,999 | 61 | 24.5% |
| $50,000 to $74,999 | 66 | 26.5% |
| $75,000 to $99,999 | 19 | 7.6% |
| $100,000 to $149,999 | 41 | 16.5% |
| $150,000 to $199,999 | 0 | 0.0% |
| $200,000+ | 23 | 9.2% |
Household Income by Householder Age in Babson Park
The median household income in Babson Park is $58,750, with the highest median household income of $118,309 found in the 25 to 44 years age bracket for the primary householder. A total of 96 households (38.6%) fall into this category. Meanwhile, the 15 to 24 years age bracket for the primary householder has the lowest median household income of $0, with 21 households (8.4%) in this group.
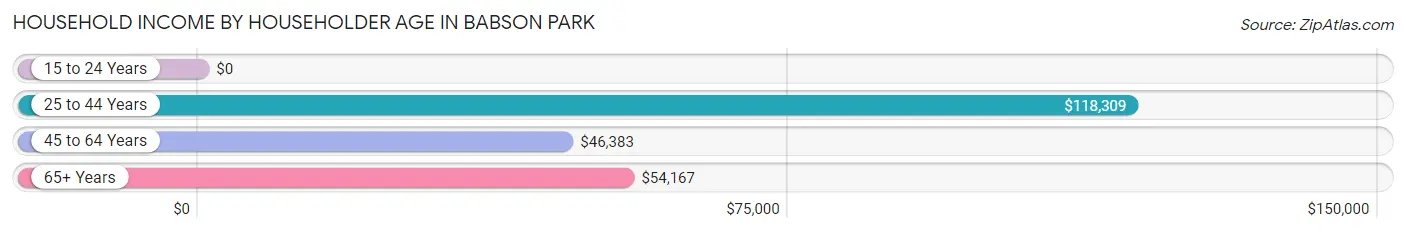
| Income Bracket | # Households | Median Income |
| 15 to 24 Years | 21 (8.4%) | $0 |
| 25 to 44 Years | 96 (38.6%) | $118,309 |
| 45 to 64 Years | 72 (28.9%) | $46,383 |
| 65+ Years | 60 (24.1%) | $54,167 |
| Total | 249 (100.0%) | $58,750 |
Poverty in Babson Park
Income Below Poverty by Sex and Age in Babson Park
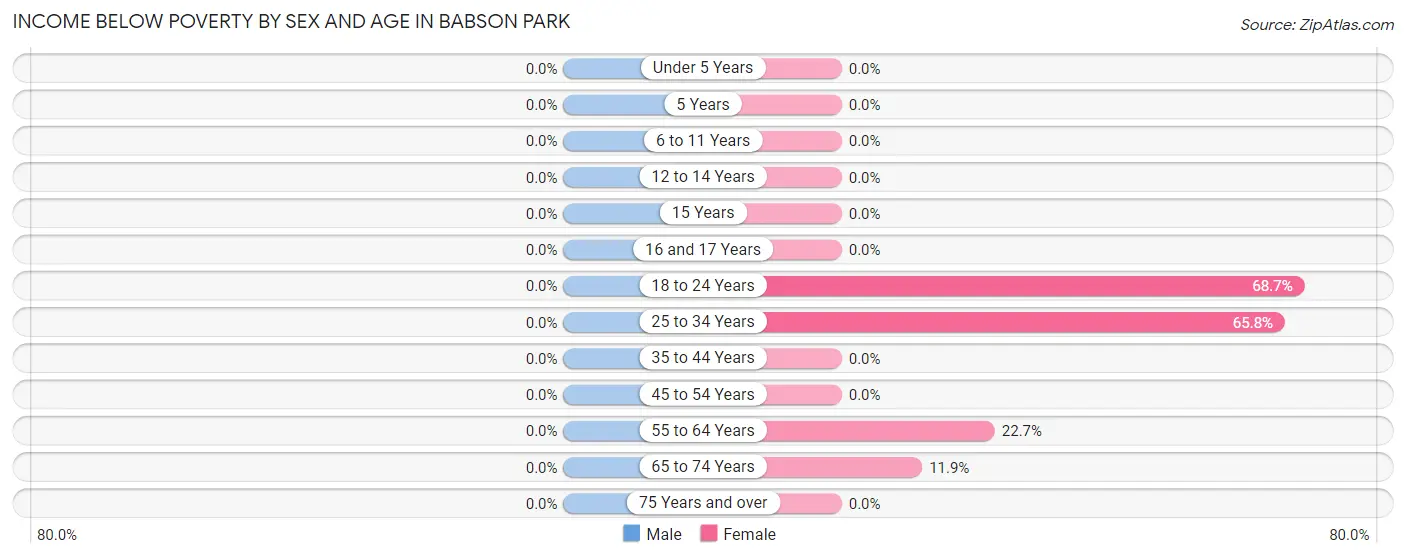
| Age Bracket | Male | Female |
| Under 5 Years | 0 (0.0%) | 0 (0.0%) |
| 5 Years | 0 (0.0%) | 0 (0.0%) |
| 6 to 11 Years | 0 (0.0%) | 0 (0.0%) |
| 12 to 14 Years | 0 (0.0%) | 0 (0.0%) |
| 15 Years | 0 (0.0%) | 0 (0.0%) |
| 16 and 17 Years | 0 (0.0%) | 0 (0.0%) |
| 18 to 24 Years | 0 (0.0%) | 79 (68.7%) |
| 25 to 34 Years | 0 (0.0%) | 25 (65.8%) |
| 35 to 44 Years | 0 (0.0%) | 0 (0.0%) |
| 45 to 54 Years | 0 (0.0%) | 0 (0.0%) |
| 55 to 64 Years | 0 (0.0%) | 10 (22.7%) |
| 65 to 74 Years | 0 (0.0%) | 8 (11.9%) |
| 75 Years and over | 0 (0.0%) | 0 (0.0%) |
| Total | 0 (0.0%) | 122 (27.2%) |
Income Above Poverty by Sex and Age in Babson Park
According to the poverty statistics in Babson Park, males aged 6 to 11 years and females aged 6 to 11 years are the age groups that are most secure financially, with 100.0% of males and 100.0% of females in these age groups living above the poverty line.
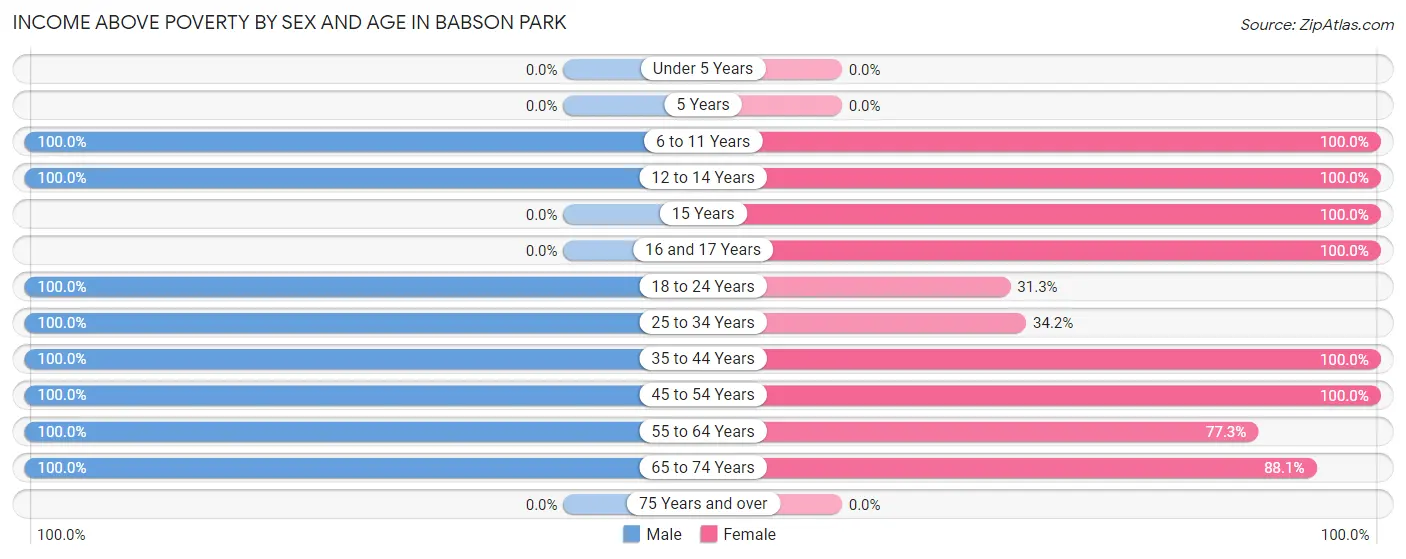
| Age Bracket | Male | Female |
| Under 5 Years | 0 (0.0%) | 0 (0.0%) |
| 5 Years | 0 (0.0%) | 0 (0.0%) |
| 6 to 11 Years | 13 (100.0%) | 7 (100.0%) |
| 12 to 14 Years | 45 (100.0%) | 37 (100.0%) |
| 15 Years | 0 (0.0%) | 7 (100.0%) |
| 16 and 17 Years | 0 (0.0%) | 35 (100.0%) |
| 18 to 24 Years | 28 (100.0%) | 36 (31.3%) |
| 25 to 34 Years | 66 (100.0%) | 13 (34.2%) |
| 35 to 44 Years | 58 (100.0%) | 34 (100.0%) |
| 45 to 54 Years | 43 (100.0%) | 65 (100.0%) |
| 55 to 64 Years | 25 (100.0%) | 34 (77.3%) |
| 65 to 74 Years | 23 (100.0%) | 59 (88.1%) |
| 75 Years and over | 0 (0.0%) | 0 (0.0%) |
| Total | 301 (100.0%) | 327 (72.8%) |
Income Below Poverty Among Married-Couple Families in Babson Park
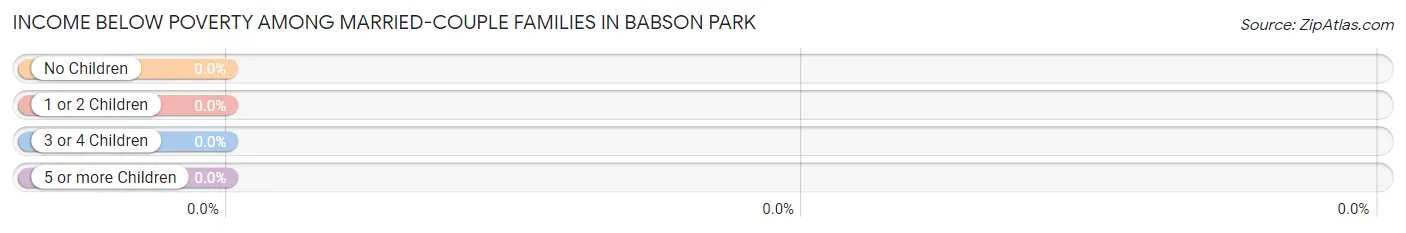
| Children | Above Poverty | Below Poverty |
| No Children | 27 (100.0%) | 0 (0.0%) |
| 1 or 2 Children | 34 (100.0%) | 0 (0.0%) |
| 3 or 4 Children | 0 (0.0%) | 0 (0.0%) |
| 5 or more Children | 0 (0.0%) | 0 (0.0%) |
| Total | 61 (100.0%) | 0 (0.0%) |
Income Below Poverty Among Single-Parent Households in Babson Park
| Children | Single Father | Single Mother |
| No Children | 0 (0.0%) | 0 (0.0%) |
| 1 or 2 Children | 0 (0.0%) | 0 (0.0%) |
| 3 or 4 Children | 0 (0.0%) | 0 (0.0%) |
| 5 or more Children | 0 (0.0%) | 0 (0.0%) |
| Total | 0 (0.0%) | 0 (0.0%) |
Income Below Poverty Among Married-Couple vs Single-Parent Households in Babson Park
| Children | Married-Couple Families | Single-Parent Households |
| No Children | 0 (0.0%) | 0 (0.0%) |
| 1 or 2 Children | 0 (0.0%) | 0 (0.0%) |
| 3 or 4 Children | 0 (0.0%) | 0 (0.0%) |
| 5 or more Children | 0 (0.0%) | 0 (0.0%) |
| Total | 0 (0.0%) | 0 (0.0%) |
Race in Babson Park
The most populous races in Babson Park are White / Caucasian (942 | 88.0%), Hispanic or Latino (83 | 7.7%), and Black / African American (60 | 5.6%).
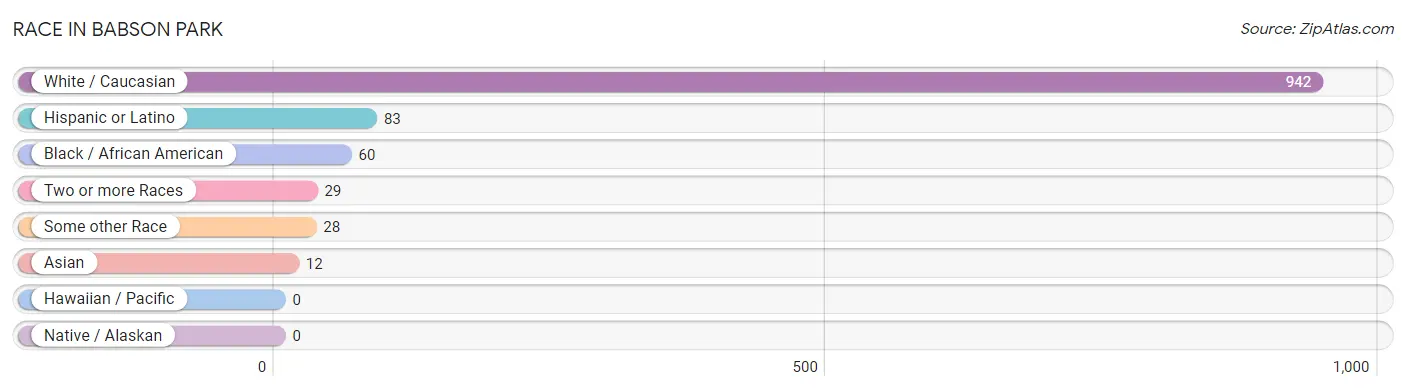
| Race | # Population | % Population |
| Asian | 12 | 1.1% |
| Black / African American | 60 | 5.6% |
| Hawaiian / Pacific | 0 | 0.0% |
| Hispanic or Latino | 83 | 7.7% |
| Native / Alaskan | 0 | 0.0% |
| White / Caucasian | 942 | 88.0% |
| Two or more Races | 29 | 2.7% |
| Some other Race | 28 | 2.6% |
| Total | 1,071 | 100.0% |
Ancestry in Babson Park
The most populous ancestries reported in Babson Park are English (210 | 19.6%), American (144 | 13.5%), Dominican (28 | 2.6%), Mexican (26 | 2.4%), and German (23 | 2.1%), together accounting for 40.3% of all Babson Park residents.
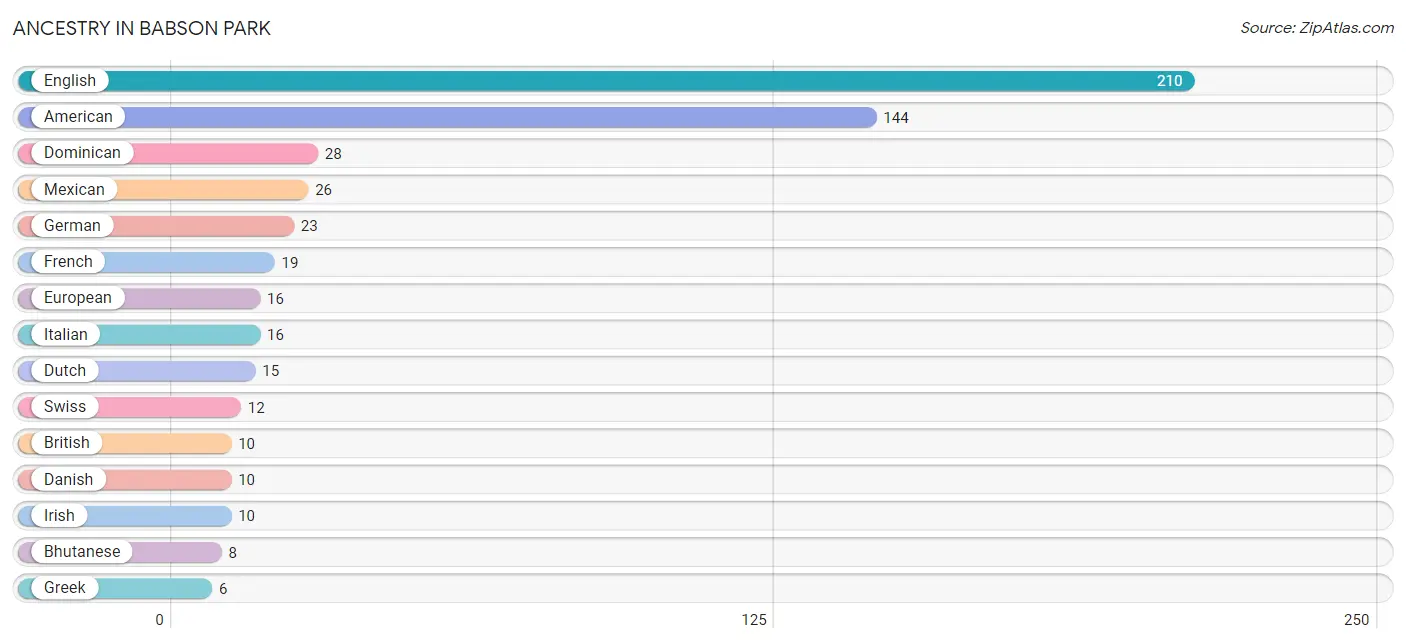
| Ancestry | # Population | % Population |
| American | 144 | 13.5% |
| Bhutanese | 8 | 0.7% |
| British | 10 | 0.9% |
| Colombian | 4 | 0.4% |
| Danish | 10 | 0.9% |
| Dominican | 28 | 2.6% |
| Dutch | 15 | 1.4% |
| English | 210 | 19.6% |
| European | 16 | 1.5% |
| French | 19 | 1.8% |
| German | 23 | 2.1% |
| Greek | 6 | 0.6% |
| Indian (Asian) | 4 | 0.4% |
| Irish | 10 | 0.9% |
| Italian | 16 | 1.5% |
| Mexican | 26 | 2.4% |
| Puerto Rican | 4 | 0.4% |
| South American | 4 | 0.4% |
| Swiss | 12 | 1.1% | View All 19 Rows |
Immigrants in Babson Park
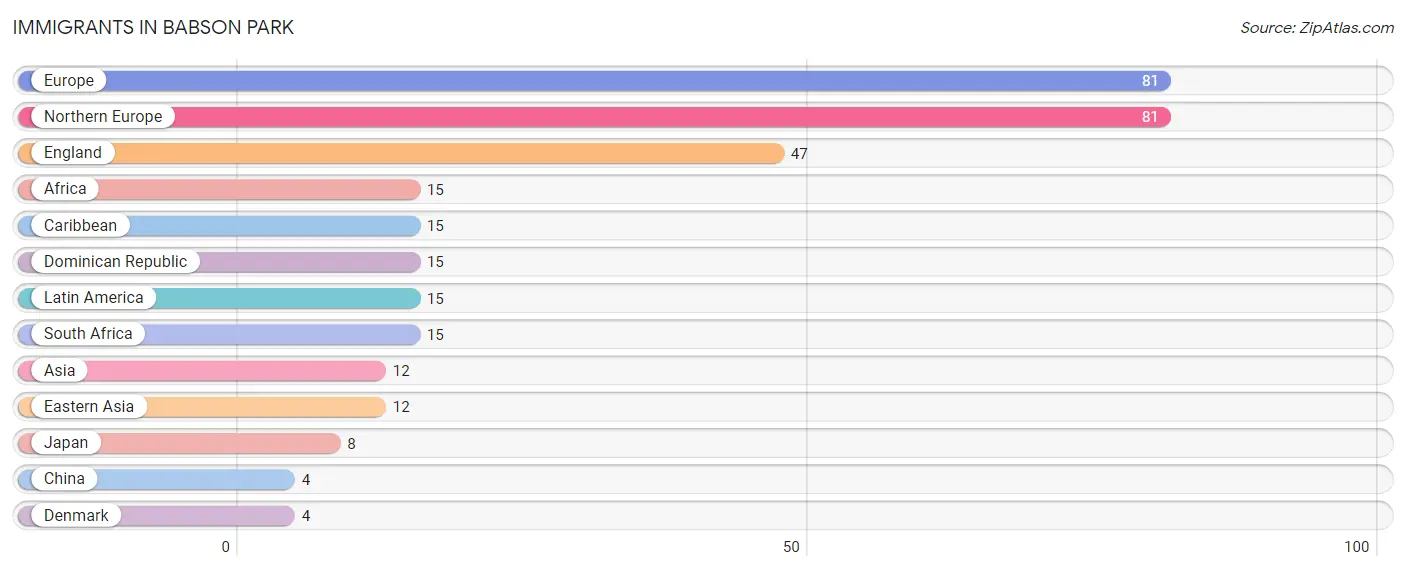
The most numerous immigrant groups reported in Babson Park came from Europe (81 | 7.6%), Northern Europe (81 | 7.6%), England (47 | 4.4%), Africa (15 | 1.4%), and Caribbean (15 | 1.4%), together accounting for 22.3% of all Babson Park residents.
| Immigration Origin | # Population | % Population |
| Africa | 15 | 1.4% |
| Asia | 12 | 1.1% |
| Caribbean | 15 | 1.4% |
| China | 4 | 0.4% |
| Denmark | 4 | 0.4% |
| Dominican Republic | 15 | 1.4% |
| Eastern Asia | 12 | 1.1% |
| England | 47 | 4.4% |
| Europe | 81 | 7.6% |
| Japan | 8 | 0.7% |
| Latin America | 15 | 1.4% |
| Northern Europe | 81 | 7.6% |
| South Africa | 15 | 1.4% | View All 13 Rows |
Sex and Age in Babson Park
Sex and Age in Babson Park
The most populous age groups in Babson Park are 15 to 19 Years (106 | 22.0%) for men and 15 to 19 Years (231 | 39.2%) for women.
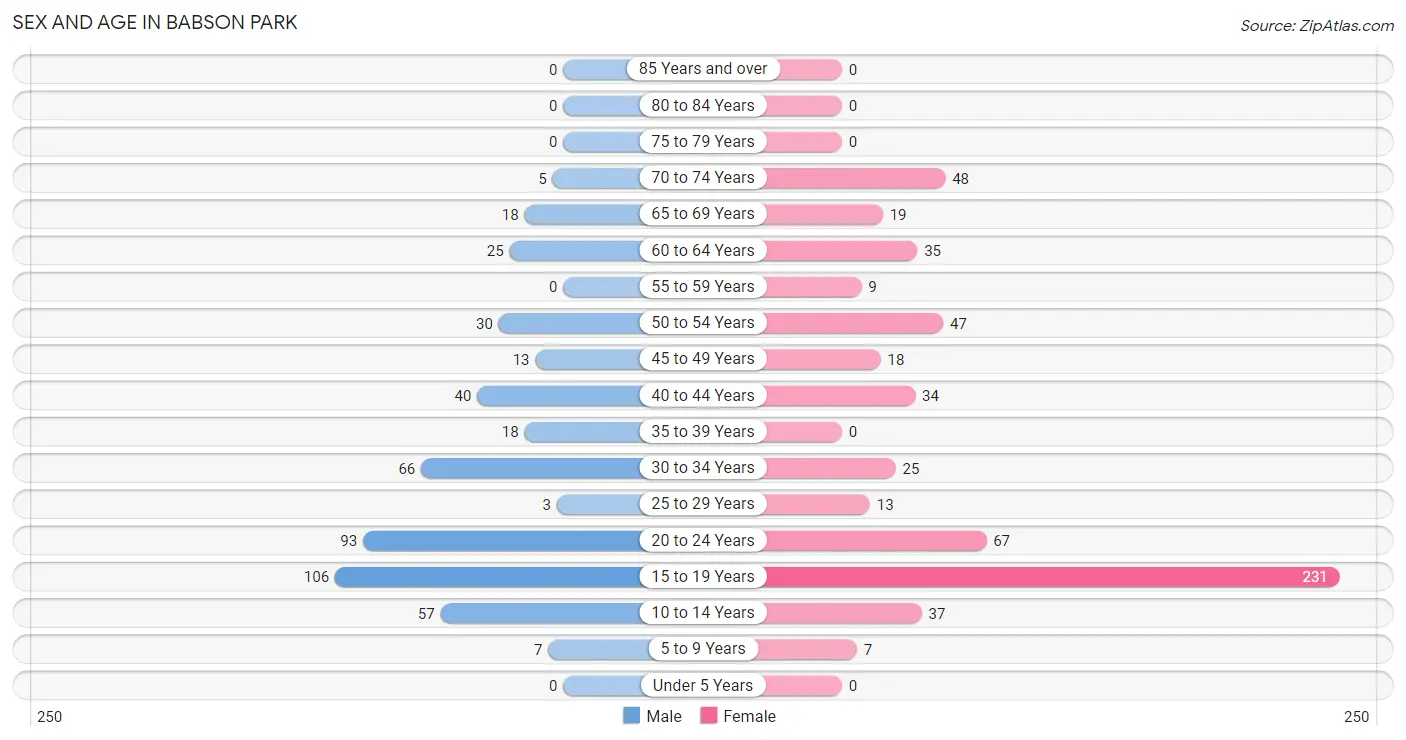
| Age Bracket | Male | Female |
| Under 5 Years | 0 (0.0%) | 0 (0.0%) |
| 5 to 9 Years | 7 (1.5%) | 7 (1.2%) |
| 10 to 14 Years | 57 (11.8%) | 37 (6.3%) |
| 15 to 19 Years | 106 (22.0%) | 231 (39.2%) |
| 20 to 24 Years | 93 (19.3%) | 67 (11.4%) |
| 25 to 29 Years | 3 (0.6%) | 13 (2.2%) |
| 30 to 34 Years | 66 (13.7%) | 25 (4.2%) |
| 35 to 39 Years | 18 (3.7%) | 0 (0.0%) |
| 40 to 44 Years | 40 (8.3%) | 34 (5.8%) |
| 45 to 49 Years | 13 (2.7%) | 18 (3.0%) |
| 50 to 54 Years | 30 (6.2%) | 47 (8.0%) |
| 55 to 59 Years | 0 (0.0%) | 9 (1.5%) |
| 60 to 64 Years | 25 (5.2%) | 35 (5.9%) |
| 65 to 69 Years | 18 (3.7%) | 19 (3.2%) |
| 70 to 74 Years | 5 (1.0%) | 48 (8.1%) |
| 75 to 79 Years | 0 (0.0%) | 0 (0.0%) |
| 80 to 84 Years | 0 (0.0%) | 0 (0.0%) |
| 85 Years and over | 0 (0.0%) | 0 (0.0%) |
| Total | 481 (100.0%) | 590 (100.0%) |
Families and Households in Babson Park
Median Family Size in Babson Park
The median family size in Babson Park is 2.74 persons per family, with married-couple families (61 | 34.3%) accounting for the largest median family size of 3.03 persons per family. On the other hand, single male/father families (44 | 24.7%) represent the smallest median family size with 2.23 persons per family.
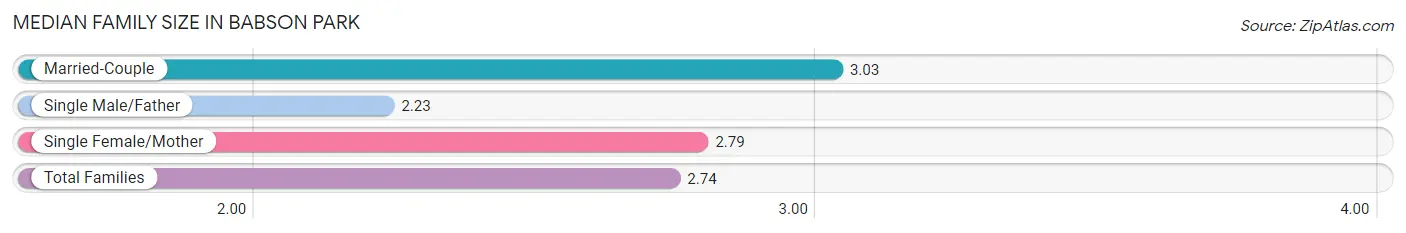
| Family Type | # Families | Family Size |
| Married-Couple | 61 (34.3%) | 3.03 |
| Single Male/Father | 44 (24.7%) | 2.23 |
| Single Female/Mother | 73 (41.0%) | 2.79 |
| Total Families | 178 (100.0%) | 2.74 |
Median Household Size in Babson Park
The median household size in Babson Park is 3.04 persons per household, with non-family households (71 | 28.5%) accounting for the largest median household size of 3.32 persons per household. single male/father households (44 | 17.7%) represent the smallest median household size with 2.84 persons per household.
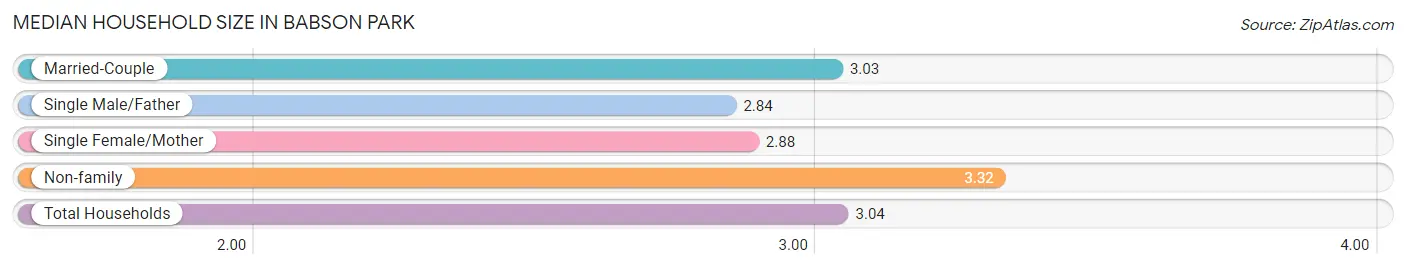
| Household Type | # Households | Household Size |
| Married-Couple | 61 (24.5%) | 3.03 |
| Single Male/Father | 44 (17.7%) | 2.84 |
| Single Female/Mother | 73 (29.3%) | 2.88 |
| Non-family | 71 (28.5%) | 3.32 |
| Total Households | 249 (100.0%) | 3.04 |
Household Size by Marriage Status in Babson Park
Out of a total of 249 households in Babson Park, 178 (71.5%) are family households, while 71 (28.5%) are nonfamily households. The most numerous type of family households are 2-person households, comprising 86, and the most common type of nonfamily households are 1-person households, comprising 32.
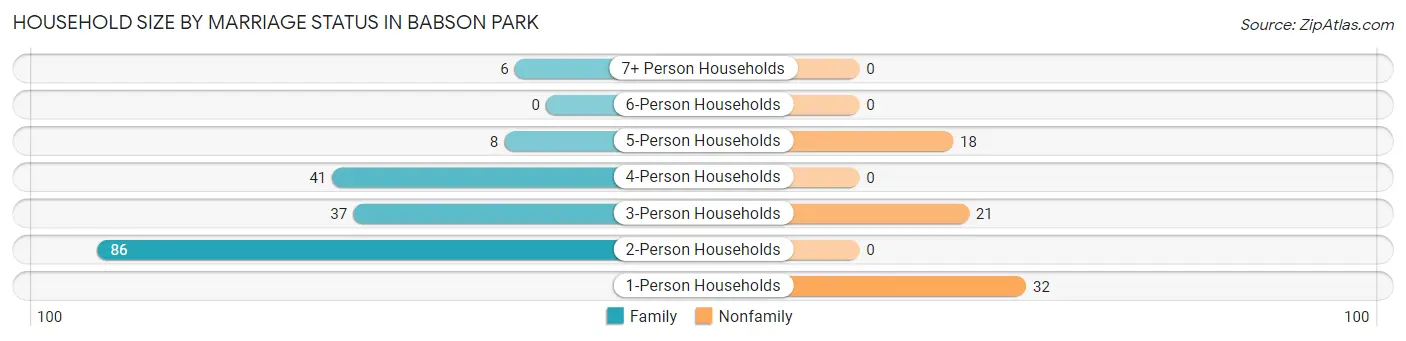
| Household Size | Family Households | Nonfamily Households |
| 1-Person Households | - | 32 (12.9%) |
| 2-Person Households | 86 (34.5%) | 0 (0.0%) |
| 3-Person Households | 37 (14.9%) | 21 (8.4%) |
| 4-Person Households | 41 (16.5%) | 0 (0.0%) |
| 5-Person Households | 8 (3.2%) | 18 (7.2%) |
| 6-Person Households | 0 (0.0%) | 0 (0.0%) |
| 7+ Person Households | 6 (2.4%) | 0 (0.0%) |
| Total | 178 (71.5%) | 71 (28.5%) |
Female Fertility in Babson Park
Fertility by Age in Babson Park
| Age Bracket | Women with Births | Births / 1,000 Women |
| 15 to 19 years | 0 (0.0%) | 0.0 |
| 20 to 34 years | 0 (0.0%) | 0.0 |
| 35 to 50 years | 0 (0.0%) | 0.0 |
| Total | 0 (0.0%) | 0.0 |
Fertility by Age by Marriage Status in Babson Park
| Age Bracket | Married | Unmarried |
| 15 to 19 years | 0 (0.0%) | 0 (0.0%) |
| 20 to 34 years | 0 (0.0%) | 0 (0.0%) |
| 35 to 50 years | 0 (0.0%) | 0 (0.0%) |
| Total | 0 (0.0%) | 0 (0.0%) |
Fertility by Education in Babson Park
| Educational Attainment | Women with Births | Births / 1,000 Women |
| Less than High School | 0 (0.0%) | 0.0 |
| High School Diploma | 0 (0.0%) | 0.0 |
| College or Associate's Degree | 0 (0.0%) | 0.0 |
| Bachelor's Degree | 0 (0.0%) | 0.0 |
| Graduate Degree | 0 (0.0%) | 0.0 |
| Total | 0 (0.0%) | 0.0 |
Fertility by Education by Marriage Status in Babson Park
| Educational Attainment | Married | Unmarried |
| Less than High School | 0 (0.0%) | 0 (0.0%) |
| High School Diploma | 0 (0.0%) | 0 (0.0%) |
| College or Associate's Degree | 0 (0.0%) | 0 (0.0%) |
| Bachelor's Degree | 0 (0.0%) | 0 (0.0%) |
| Graduate Degree | 0 (0.0%) | 0 (0.0%) |
| Total | 0 (0.0%) | 0 (0.0%) |
Employment Characteristics in Babson Park
Employment by Class of Employer in Babson Park
Among the 408 employed individuals in Babson Park, private company employees (296 | 72.6%), not-for-profit organizations (56 | 13.7%), and self-employed (not incorporated) (34 | 8.3%) make up the most common classes of employment.
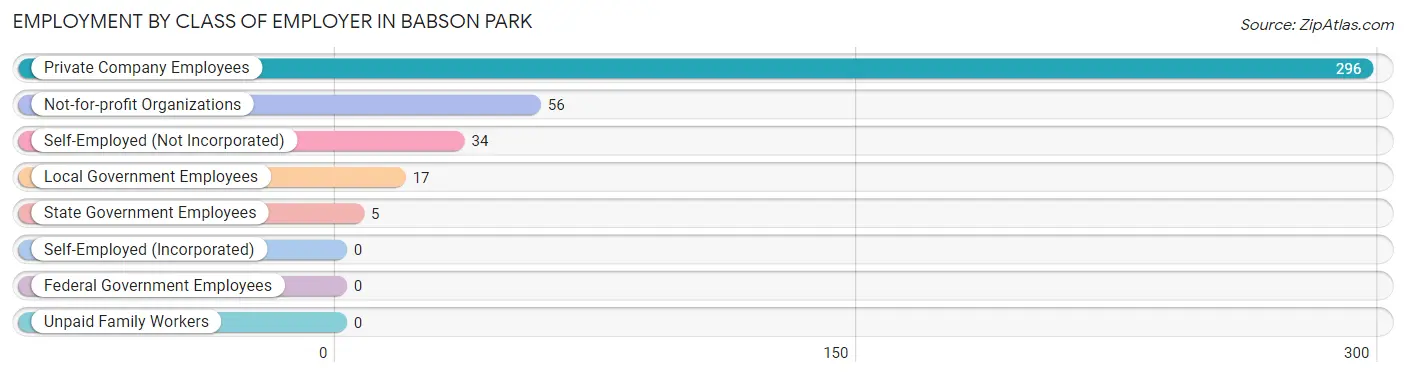
| Employer Class | # Employees | % Employees |
| Private Company Employees | 296 | 72.6% |
| Self-Employed (Incorporated) | 0 | 0.0% |
| Self-Employed (Not Incorporated) | 34 | 8.3% |
| Not-for-profit Organizations | 56 | 13.7% |
| Local Government Employees | 17 | 4.2% |
| State Government Employees | 5 | 1.2% |
| Federal Government Employees | 0 | 0.0% |
| Unpaid Family Workers | 0 | 0.0% |
| Total | 408 | 100.0% |
Employment Status by Age in Babson Park
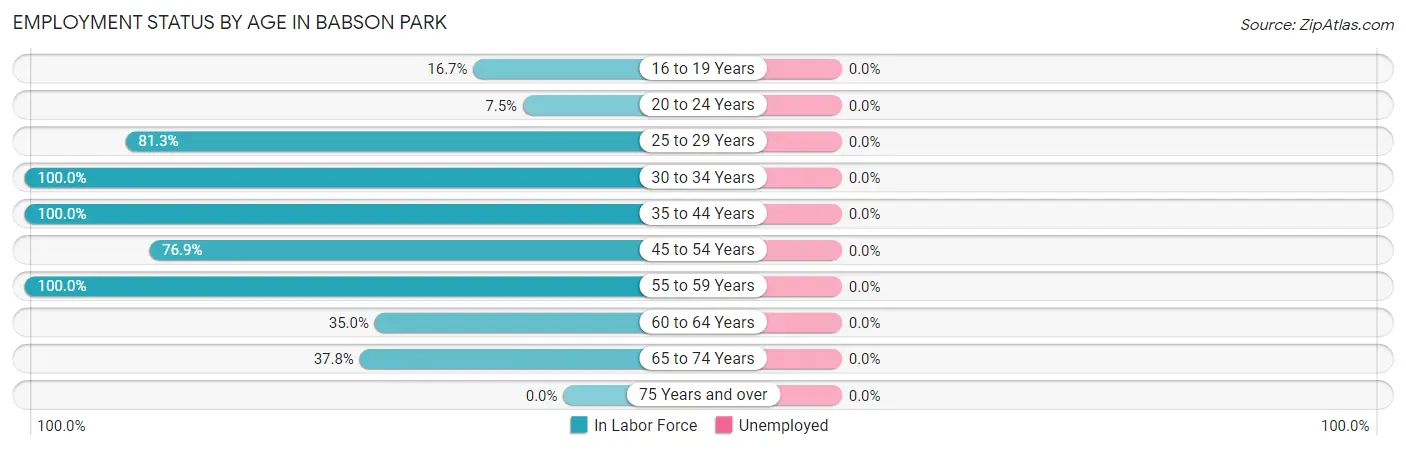
| Age Bracket | In Labor Force | Unemployed |
| 16 to 19 Years | 55 (16.7%) | 0 (0.0%) |
| 20 to 24 Years | 12 (7.5%) | 0 (0.0%) |
| 25 to 29 Years | 13 (81.3%) | 0 (0.0%) |
| 30 to 34 Years | 91 (100.0%) | 0 (0.0%) |
| 35 to 44 Years | 92 (100.0%) | 0 (0.0%) |
| 45 to 54 Years | 83 (76.9%) | 0 (0.0%) |
| 55 to 59 Years | 9 (100.0%) | 0 (0.0%) |
| 60 to 64 Years | 21 (35.0%) | 0 (0.0%) |
| 65 to 74 Years | 34 (37.8%) | 0 (0.0%) |
| 75 Years and over | 0 (0.0%) | 0 (0.0%) |
| Total | 410 (42.9%) | 0 (0.0%) |
Employment Status by Educational Attainment in Babson Park
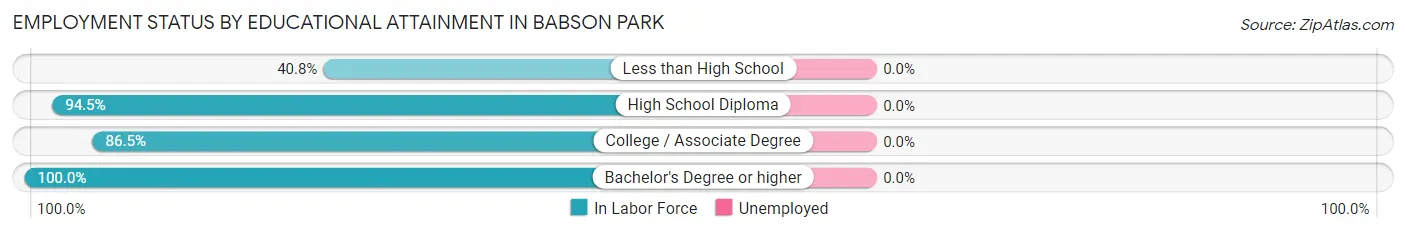
| Educational Attainment | In Labor Force | Unemployed |
| Less than High School | 29 (40.8%) | 0 (0.0%) |
| High School Diploma | 173 (94.5%) | 0 (0.0%) |
| College / Associate Degree | 96 (86.5%) | 0 (0.0%) |
| Bachelor's Degree or higher | 11 (100.0%) | 0 (0.0%) |
| Total | 309 (82.2%) | 0 (0.0%) |
Employment Occupations by Sex in Babson Park
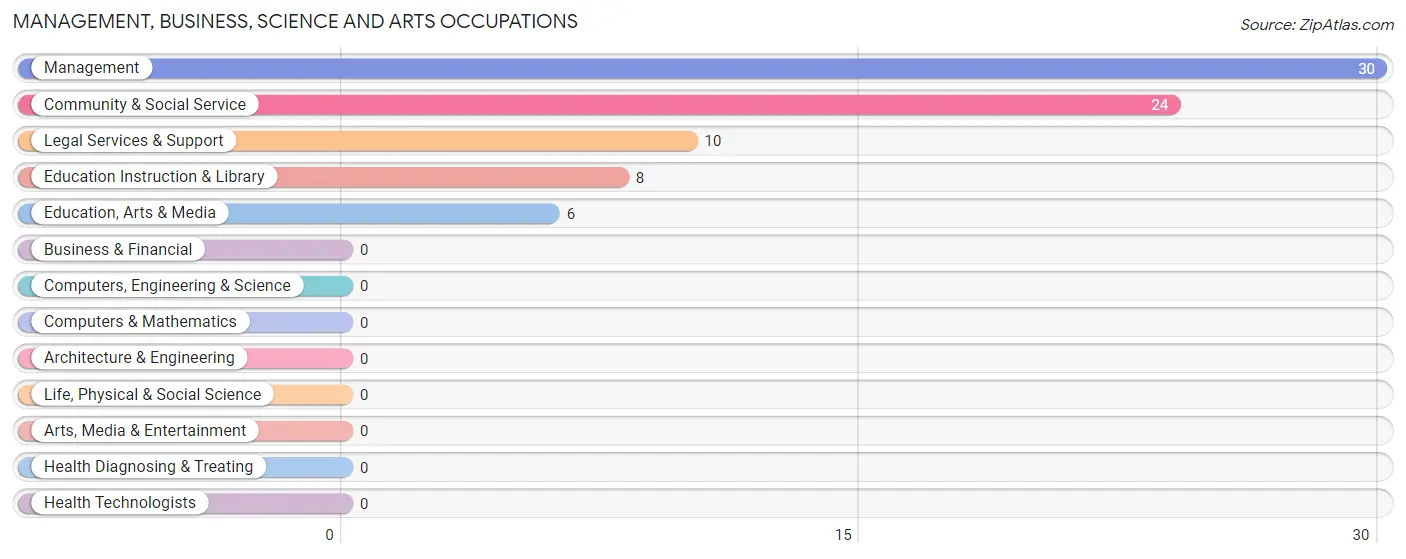
Management, Business, Science and Arts Occupations
The most common Management, Business, Science and Arts occupations in Babson Park are Management (30 | 7.3%), Community & Social Service (24 | 5.9%), Legal Services & Support (10 | 2.4%), Education Instruction & Library (8 | 1.9%), and Education, Arts & Media (6 | 1.5%).
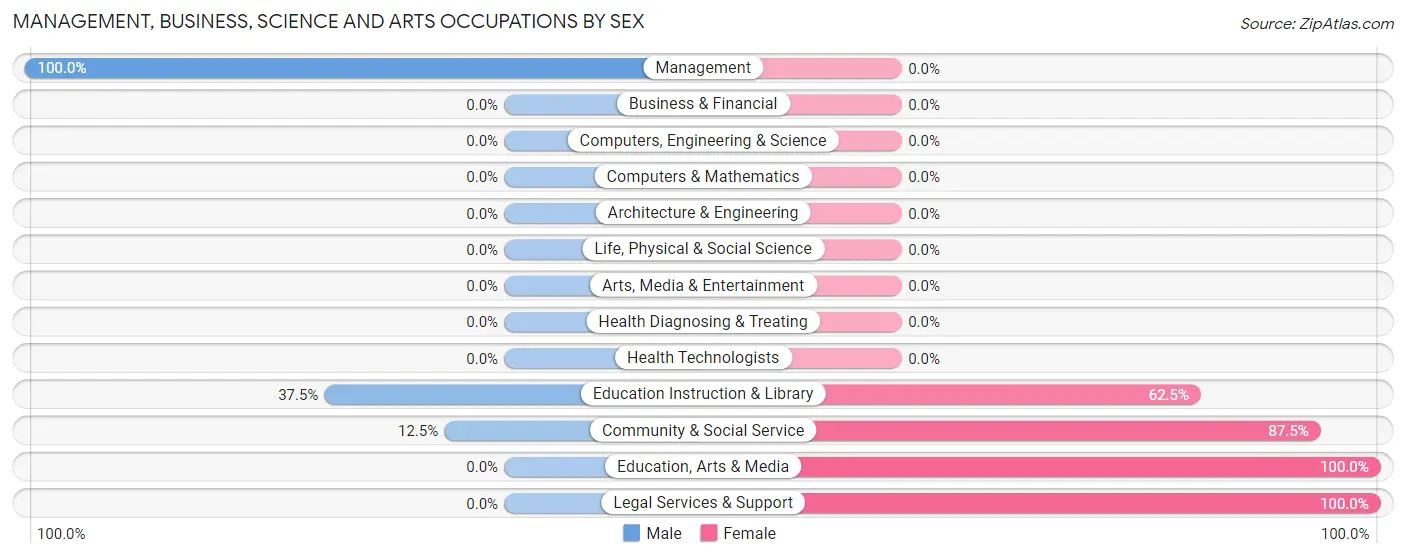
Management, Business, Science and Arts Occupations by Sex
Within the Management, Business, Science and Arts occupations in Babson Park, the most male-oriented occupations are Management (100.0%), Education Instruction & Library (37.5%), and Community & Social Service (12.5%), while the most female-oriented occupations are Education, Arts & Media (100.0%), Legal Services & Support (100.0%), and Community & Social Service (87.5%).
| Occupation | Male | Female |
| Management | 30 (100.0%) | 0 (0.0%) |
| Business & Financial | 0 (0.0%) | 0 (0.0%) |
| Computers, Engineering & Science | 0 (0.0%) | 0 (0.0%) |
| Computers & Mathematics | 0 (0.0%) | 0 (0.0%) |
| Architecture & Engineering | 0 (0.0%) | 0 (0.0%) |
| Life, Physical & Social Science | 0 (0.0%) | 0 (0.0%) |
| Community & Social Service | 3 (12.5%) | 21 (87.5%) |
| Education, Arts & Media | 0 (0.0%) | 6 (100.0%) |
| Legal Services & Support | 0 (0.0%) | 10 (100.0%) |
| Education Instruction & Library | 3 (37.5%) | 5 (62.5%) |
| Arts, Media & Entertainment | 0 (0.0%) | 0 (0.0%) |
| Health Diagnosing & Treating | 0 (0.0%) | 0 (0.0%) |
| Health Technologists | 0 (0.0%) | 0 (0.0%) |
| Total (Category) | 33 (61.1%) | 21 (38.9%) |
| Total (Overall) | 224 (54.6%) | 186 (45.4%) |
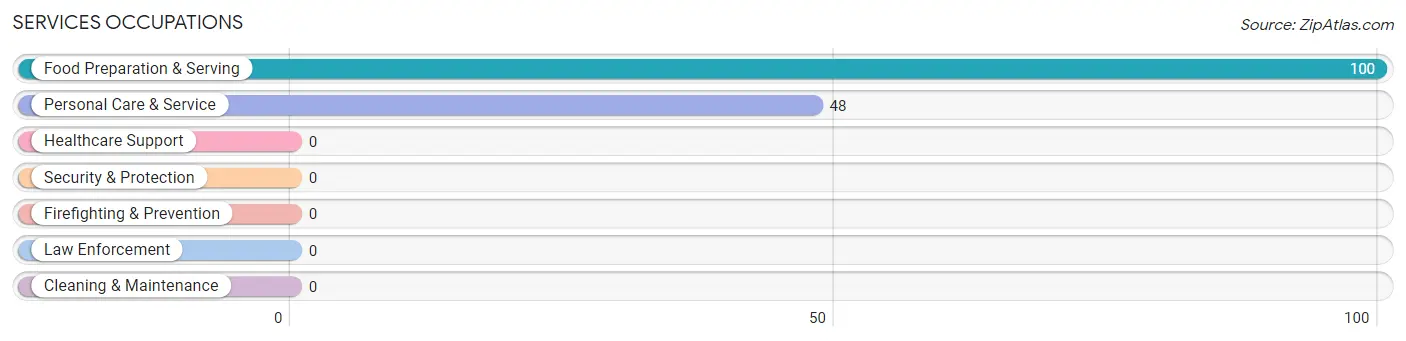
Services Occupations
The most common Services occupations in Babson Park are Food Preparation & Serving (100 | 24.4%), and Personal Care & Service (48 | 11.7%).
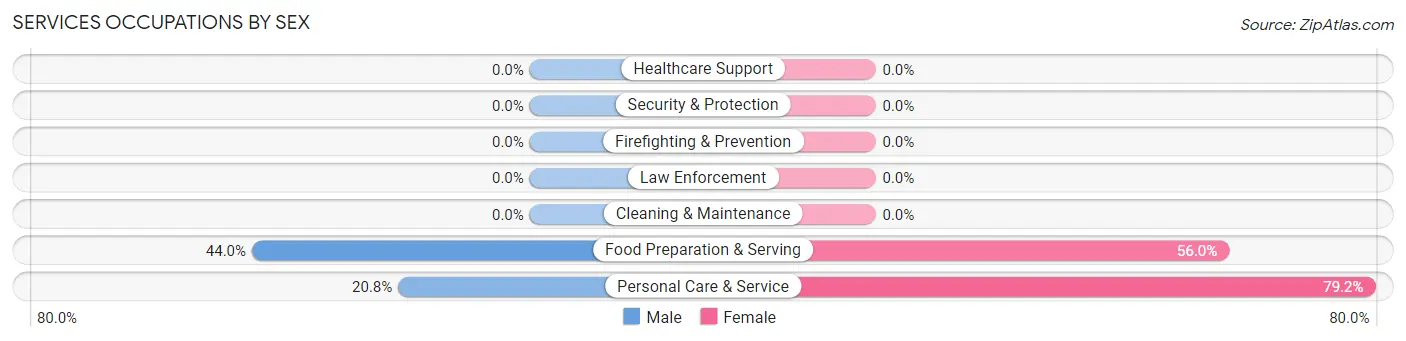
Services Occupations by Sex
Within the Services occupations in Babson Park, the most male-oriented occupations are Food Preparation & Serving (44.0%), and Personal Care & Service (20.8%), while the most female-oriented occupations are Personal Care & Service (79.2%), and Food Preparation & Serving (56.0%).
| Occupation | Male | Female |
| Healthcare Support | 0 (0.0%) | 0 (0.0%) |
| Security & Protection | 0 (0.0%) | 0 (0.0%) |
| Firefighting & Prevention | 0 (0.0%) | 0 (0.0%) |
| Law Enforcement | 0 (0.0%) | 0 (0.0%) |
| Food Preparation & Serving | 44 (44.0%) | 56 (56.0%) |
| Cleaning & Maintenance | 0 (0.0%) | 0 (0.0%) |
| Personal Care & Service | 10 (20.8%) | 38 (79.2%) |
| Total (Category) | 54 (36.5%) | 94 (63.5%) |
| Total (Overall) | 224 (54.6%) | 186 (45.4%) |
Sales and Office Occupations
The most common Sales and Office occupations in Babson Park are Office & Administration (92 | 22.4%), and Sales & Related (12 | 2.9%).
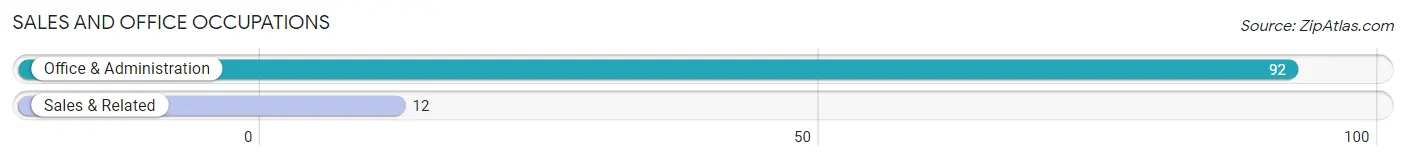
Sales and Office Occupations by Sex
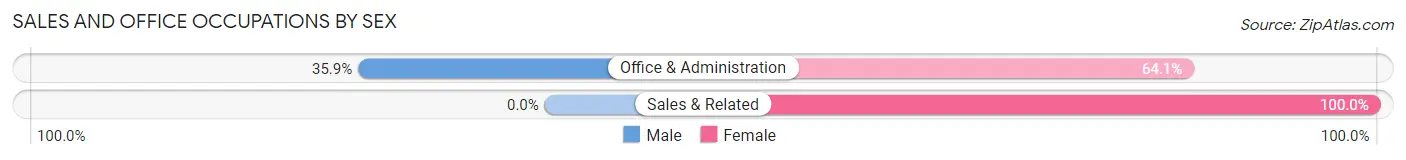
| Occupation | Male | Female |
| Sales & Related | 0 (0.0%) | 12 (100.0%) |
| Office & Administration | 33 (35.9%) | 59 (64.1%) |
| Total (Category) | 33 (31.7%) | 71 (68.3%) |
| Total (Overall) | 224 (54.6%) | 186 (45.4%) |
Natural Resources, Construction and Maintenance Occupations
The most common Natural Resources, Construction and Maintenance occupations in Babson Park are , and Installation, Maintenance & Repair (13 | 3.2%).
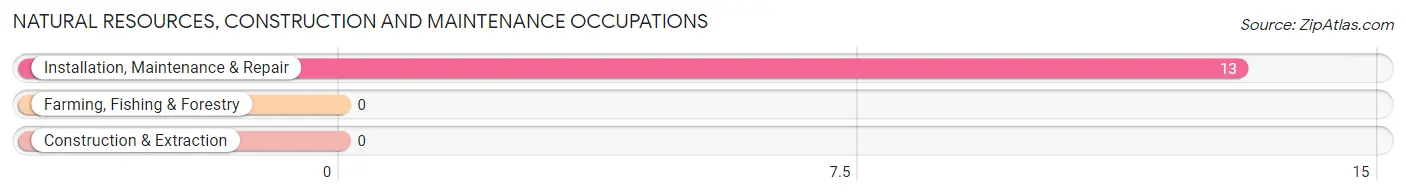
Natural Resources, Construction and Maintenance Occupations by Sex
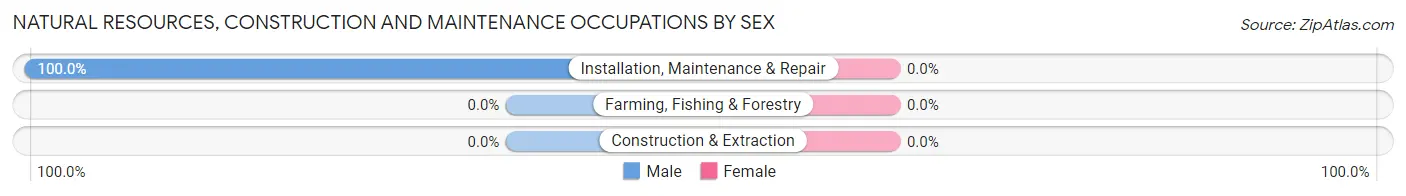
| Occupation | Male | Female |
| Farming, Fishing & Forestry | 0 (0.0%) | 0 (0.0%) |
| Construction & Extraction | 0 (0.0%) | 0 (0.0%) |
| Installation, Maintenance & Repair | 13 (100.0%) | 0 (0.0%) |
| Total (Category) | 13 (100.0%) | 0 (0.0%) |
| Total (Overall) | 224 (54.6%) | 186 (45.4%) |
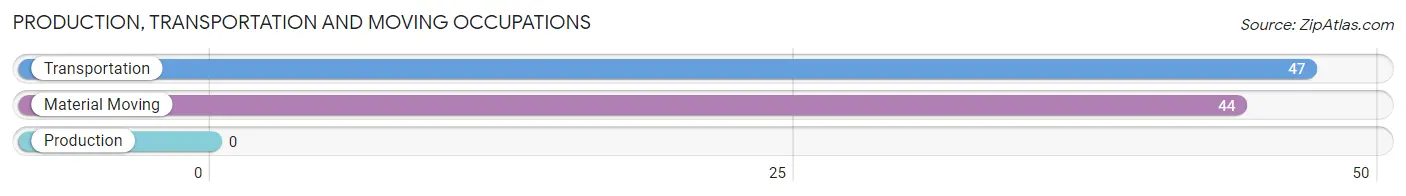
Production, Transportation and Moving Occupations
The most common Production, Transportation and Moving occupations in Babson Park are Transportation (47 | 11.5%), and Material Moving (44 | 10.7%).
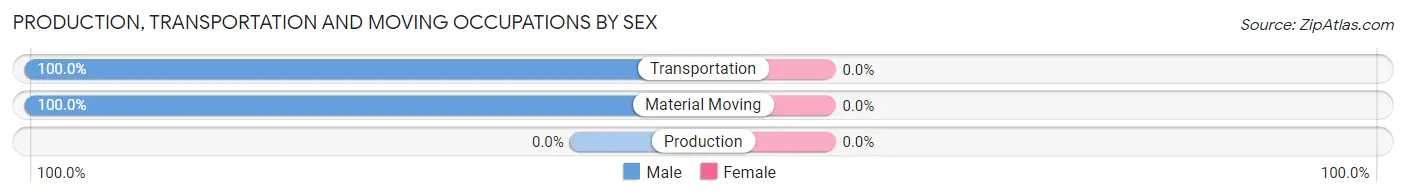
Production, Transportation and Moving Occupations by Sex
| Occupation | Male | Female |
| Production | 0 (0.0%) | 0 (0.0%) |
| Transportation | 47 (100.0%) | 0 (0.0%) |
| Material Moving | 44 (100.0%) | 0 (0.0%) |
| Total (Category) | 91 (100.0%) | 0 (0.0%) |
| Total (Overall) | 224 (54.6%) | 186 (45.4%) |
Employment Industries by Sex in Babson Park
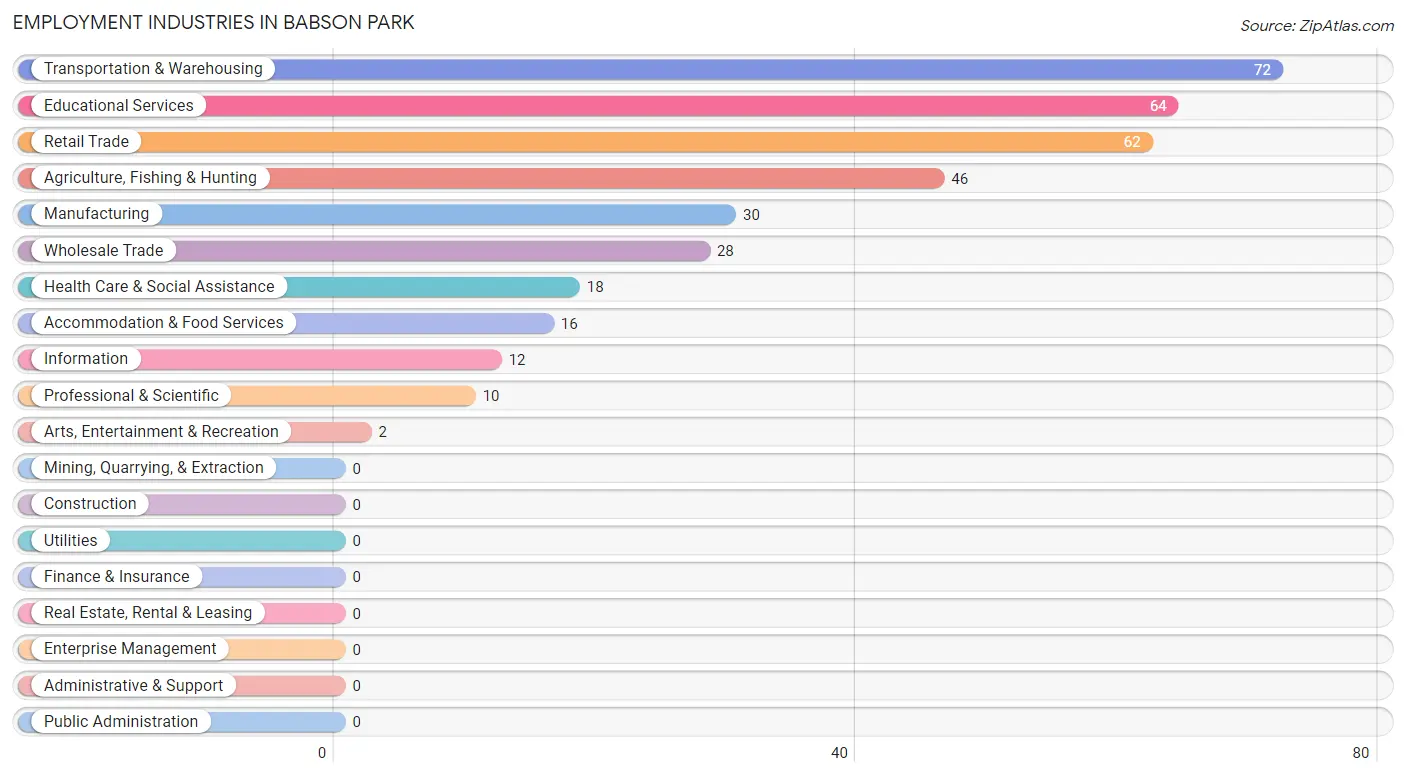
Employment Industries in Babson Park
The major employment industries in Babson Park include Transportation & Warehousing (72 | 17.6%), Educational Services (64 | 15.6%), Retail Trade (62 | 15.1%), Agriculture, Fishing & Hunting (46 | 11.2%), and Manufacturing (30 | 7.3%).
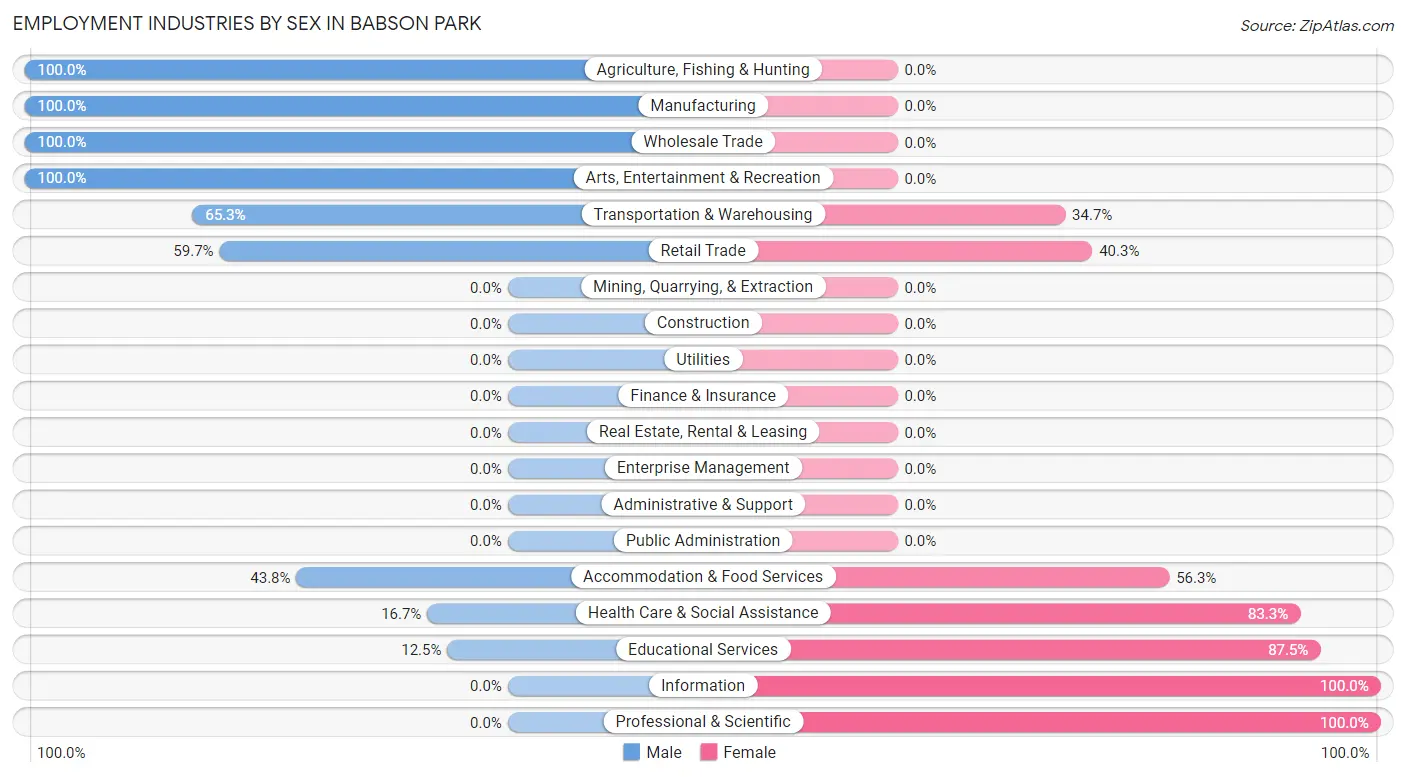
Employment Industries by Sex in Babson Park
The Babson Park industries that see more men than women are Agriculture, Fishing & Hunting (100.0%), Manufacturing (100.0%), and Wholesale Trade (100.0%), whereas the industries that tend to have a higher number of women are Information (100.0%), Professional & Scientific (100.0%), and Educational Services (87.5%).
| Industry | Male | Female |
| Agriculture, Fishing & Hunting | 46 (100.0%) | 0 (0.0%) |
| Mining, Quarrying, & Extraction | 0 (0.0%) | 0 (0.0%) |
| Construction | 0 (0.0%) | 0 (0.0%) |
| Manufacturing | 30 (100.0%) | 0 (0.0%) |
| Wholesale Trade | 28 (100.0%) | 0 (0.0%) |
| Retail Trade | 37 (59.7%) | 25 (40.3%) |
| Transportation & Warehousing | 47 (65.3%) | 25 (34.7%) |
| Utilities | 0 (0.0%) | 0 (0.0%) |
| Information | 0 (0.0%) | 12 (100.0%) |
| Finance & Insurance | 0 (0.0%) | 0 (0.0%) |
| Real Estate, Rental & Leasing | 0 (0.0%) | 0 (0.0%) |
| Professional & Scientific | 0 (0.0%) | 10 (100.0%) |
| Enterprise Management | 0 (0.0%) | 0 (0.0%) |
| Administrative & Support | 0 (0.0%) | 0 (0.0%) |
| Educational Services | 8 (12.5%) | 56 (87.5%) |
| Health Care & Social Assistance | 3 (16.7%) | 15 (83.3%) |
| Arts, Entertainment & Recreation | 2 (100.0%) | 0 (0.0%) |
| Accommodation & Food Services | 7 (43.8%) | 9 (56.2%) |
| Public Administration | 0 (0.0%) | 0 (0.0%) |
| Total | 224 (54.6%) | 186 (45.4%) |
Education in Babson Park
School Enrollment in Babson Park
The most common levels of schooling among the 571 students in Babson Park are college / undergraduate (421 | 73.7%), middle school (88 | 15.4%), and high school (42 | 7.4%).
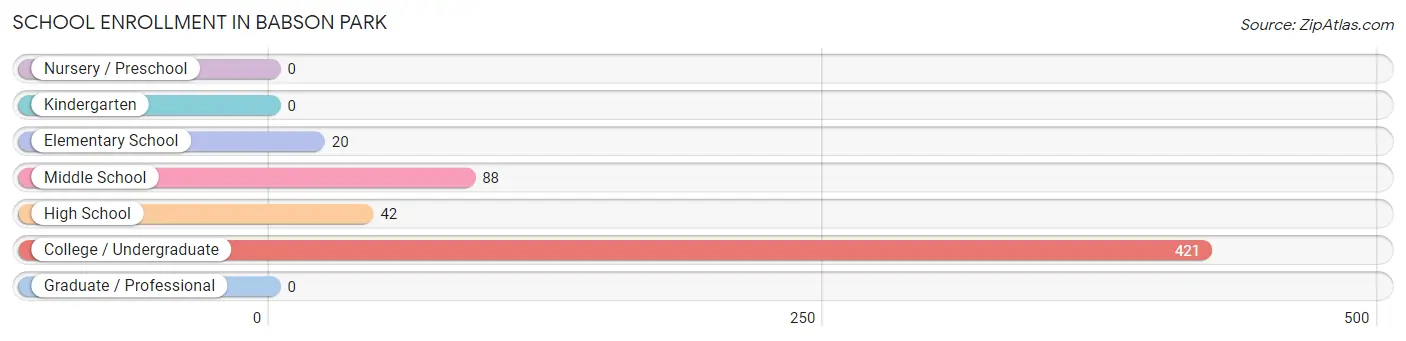
| School Level | # Students | % Students |
| Nursery / Preschool | 0 | 0.0% |
| Kindergarten | 0 | 0.0% |
| Elementary School | 20 | 3.5% |
| Middle School | 88 | 15.4% |
| High School | 42 | 7.4% |
| College / Undergraduate | 421 | 73.7% |
| Graduate / Professional | 0 | 0.0% |
| Total | 571 | 100.0% |
School Enrollment by Age by Funding Source in Babson Park
Out of a total of 571 students who are enrolled in schools in Babson Park, 366 (64.1%) attend a private institution, while the remaining 205 (35.9%) are enrolled in public schools. The age group of 25 to 34 year olds has the highest likelihood of being enrolled in private schools, with 3 (100.0% in the age bracket) enrolled. Conversely, the age group of 5 to 9 year old has the lowest likelihood of being enrolled in a private school, with 14 (100.0% in the age bracket) attending a public institution.
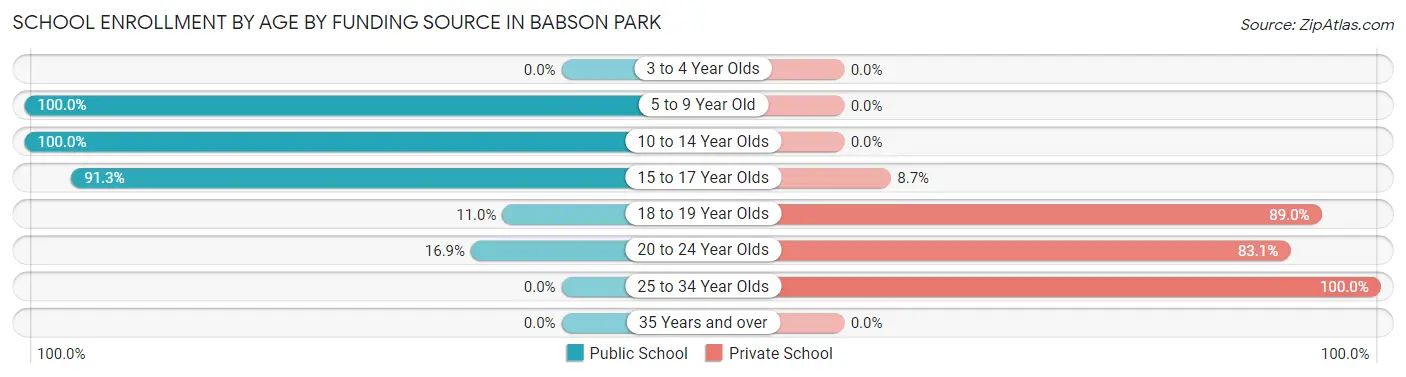
| Age Bracket | Public School | Private School |
| 3 to 4 Year Olds | 0 (0.0%) | 0 (0.0%) |
| 5 to 9 Year Old | 14 (100.0%) | 0 (0.0%) |
| 10 to 14 Year Olds | 94 (100.0%) | 0 (0.0%) |
| 15 to 17 Year Olds | 42 (91.3%) | 4 (8.7%) |
| 18 to 19 Year Olds | 28 (11.0%) | 226 (89.0%) |
| 20 to 24 Year Olds | 27 (16.9%) | 133 (83.1%) |
| 25 to 34 Year Olds | 0 (0.0%) | 3 (100.0%) |
| 35 Years and over | 0 (0.0%) | 0 (0.0%) |
| Total | 205 (35.9%) | 366 (64.1%) |
Educational Attainment by Field of Study in Babson Park
Psychology (6 | 35.3%), arts & humanities (6 | 35.3%), and education (5 | 29.4%) are the most common fields of study among 17 individuals in Babson Park who have obtained a bachelor's degree or higher.
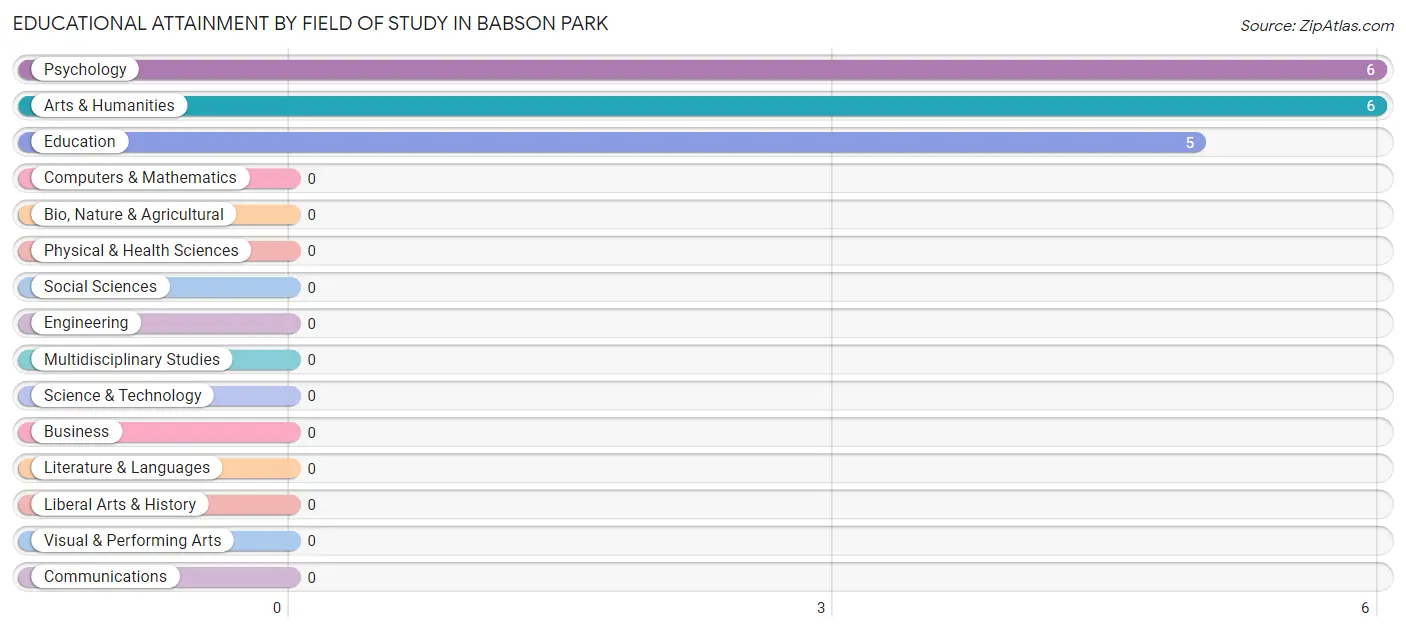
| Field of Study | # Graduates | % Graduates |
| Computers & Mathematics | 0 | 0.0% |
| Bio, Nature & Agricultural | 0 | 0.0% |
| Physical & Health Sciences | 0 | 0.0% |
| Psychology | 6 | 35.3% |
| Social Sciences | 0 | 0.0% |
| Engineering | 0 | 0.0% |
| Multidisciplinary Studies | 0 | 0.0% |
| Science & Technology | 0 | 0.0% |
| Business | 0 | 0.0% |
| Education | 5 | 29.4% |
| Literature & Languages | 0 | 0.0% |
| Liberal Arts & History | 0 | 0.0% |
| Visual & Performing Arts | 0 | 0.0% |
| Communications | 0 | 0.0% |
| Arts & Humanities | 6 | 35.3% |
| Total | 17 | 100.0% |
Transportation & Commute in Babson Park
Vehicle Availability by Sex in Babson Park
The most prevalent vehicle ownership categories in Babson Park are males with 5 or more vehicles (77, accounting for 36.5%) and females with 5 or more vehicles (25, making up 45.6%).
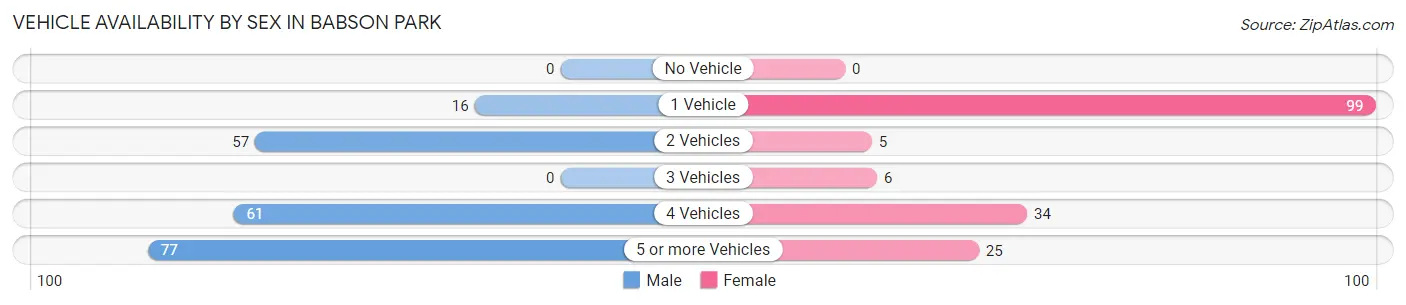
| Vehicles Available | Male | Female |
| No Vehicle | 0 (0.0%) | 0 (0.0%) |
| 1 Vehicle | 16 (7.6%) | 99 (58.6%) |
| 2 Vehicles | 57 (27.0%) | 5 (3.0%) |
| 3 Vehicles | 0 (0.0%) | 6 (3.5%) |
| 4 Vehicles | 61 (28.9%) | 34 (20.1%) |
| 5 or more Vehicles | 77 (36.5%) | 25 (14.8%) |
| Total | 211 (100.0%) | 169 (100.0%) |
Commute Time in Babson Park
The most frequently occuring commute durations in Babson Park are 15 to 19 minutes (88 commuters, 21.7%), less than 5 minutes (73 commuters, 18.0%), and 20 to 24 minutes (69 commuters, 17.0%).
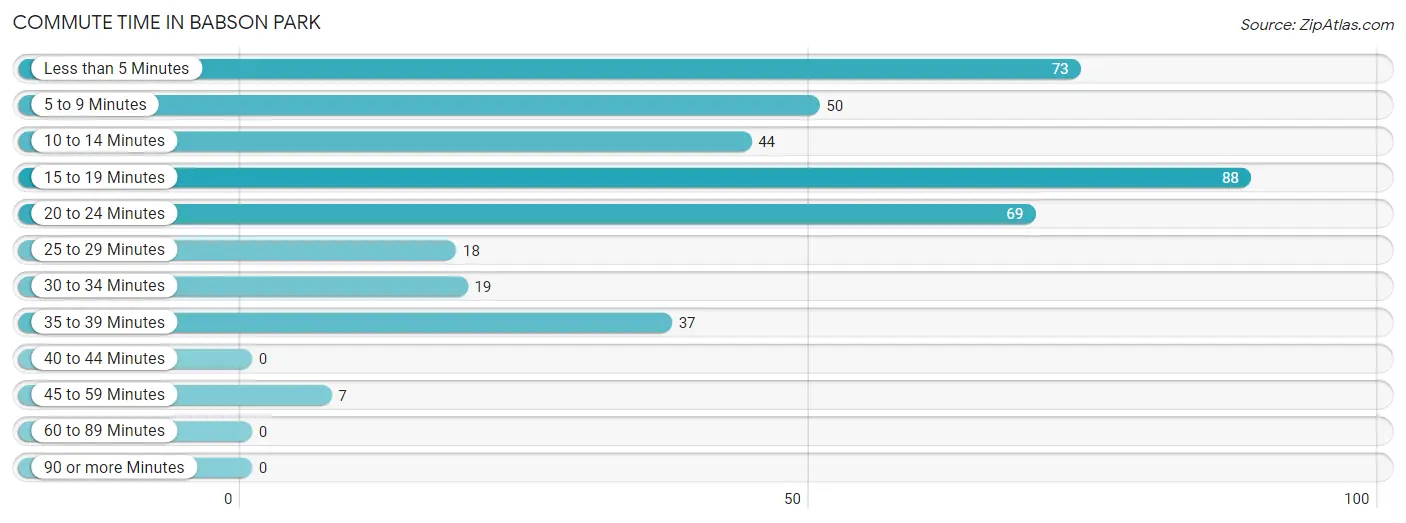
| Commute Time | # Commuters | % Commuters |
| Less than 5 Minutes | 73 | 18.0% |
| 5 to 9 Minutes | 50 | 12.3% |
| 10 to 14 Minutes | 44 | 10.9% |
| 15 to 19 Minutes | 88 | 21.7% |
| 20 to 24 Minutes | 69 | 17.0% |
| 25 to 29 Minutes | 18 | 4.4% |
| 30 to 34 Minutes | 19 | 4.7% |
| 35 to 39 Minutes | 37 | 9.1% |
| 40 to 44 Minutes | 0 | 0.0% |
| 45 to 59 Minutes | 7 | 1.7% |
| 60 to 89 Minutes | 0 | 0.0% |
| 90 or more Minutes | 0 | 0.0% |
Commute Time by Sex in Babson Park
The most common commute times in Babson Park are 15 to 19 minutes (63 commuters, 28.8%) for males and 5 to 9 minutes (47 commuters, 25.3%) for females.
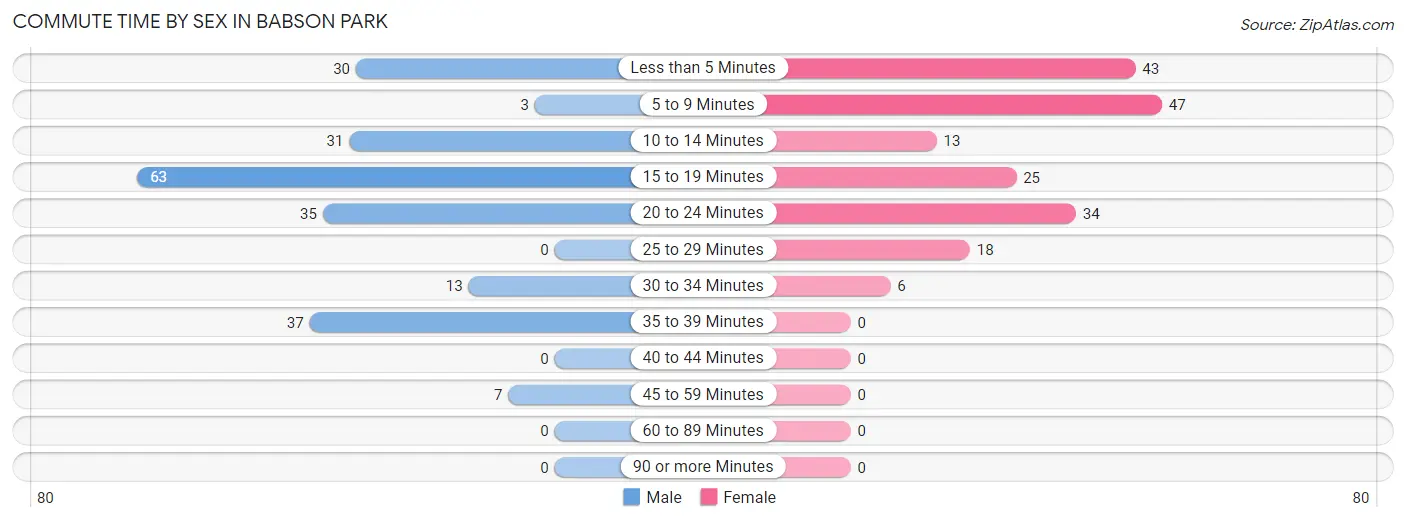
| Commute Time | Male | Female |
| Less than 5 Minutes | 30 (13.7%) | 43 (23.1%) |
| 5 to 9 Minutes | 3 (1.4%) | 47 (25.3%) |
| 10 to 14 Minutes | 31 (14.2%) | 13 (7.0%) |
| 15 to 19 Minutes | 63 (28.8%) | 25 (13.4%) |
| 20 to 24 Minutes | 35 (16.0%) | 34 (18.3%) |
| 25 to 29 Minutes | 0 (0.0%) | 18 (9.7%) |
| 30 to 34 Minutes | 13 (5.9%) | 6 (3.2%) |
| 35 to 39 Minutes | 37 (16.9%) | 0 (0.0%) |
| 40 to 44 Minutes | 0 (0.0%) | 0 (0.0%) |
| 45 to 59 Minutes | 7 (3.2%) | 0 (0.0%) |
| 60 to 89 Minutes | 0 (0.0%) | 0 (0.0%) |
| 90 or more Minutes | 0 (0.0%) | 0 (0.0%) |
Time of Departure to Work by Sex in Babson Park
The most frequent times of departure to work in Babson Park are 7:30 AM to 7:59 AM (50, 22.8%) for males and 7:30 AM to 7:59 AM (50, 26.9%) for females.
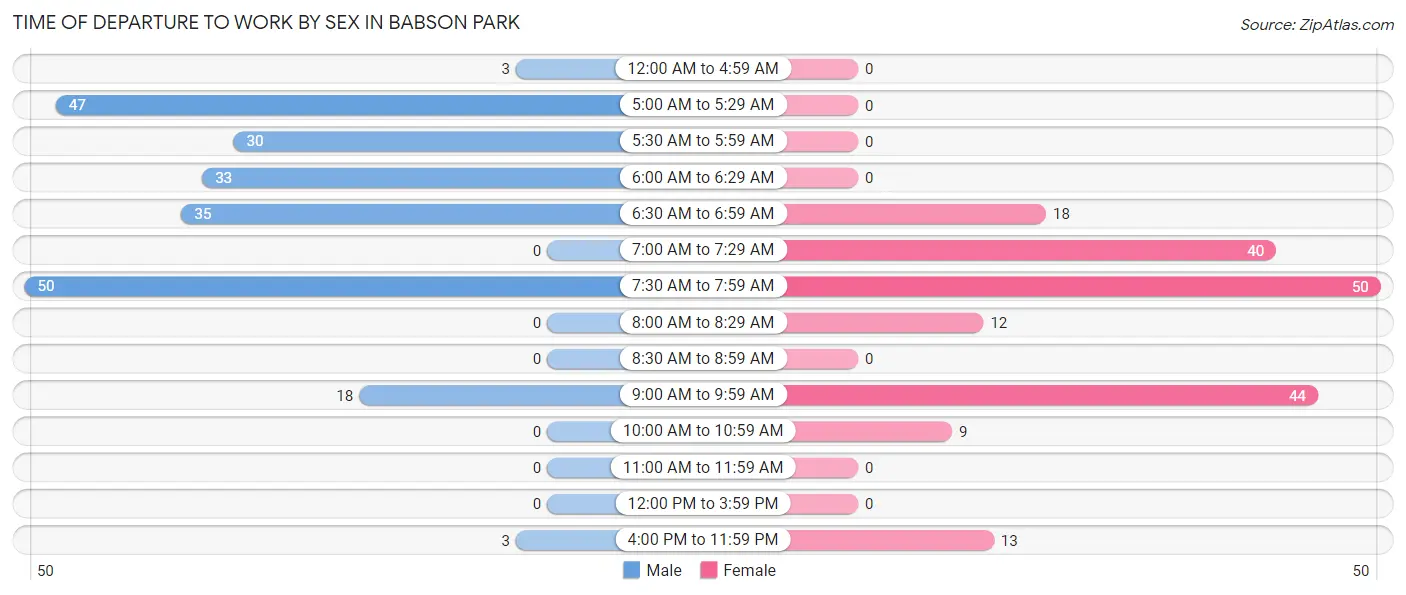
| Time of Departure | Male | Female |
| 12:00 AM to 4:59 AM | 3 (1.4%) | 0 (0.0%) |
| 5:00 AM to 5:29 AM | 47 (21.5%) | 0 (0.0%) |
| 5:30 AM to 5:59 AM | 30 (13.7%) | 0 (0.0%) |
| 6:00 AM to 6:29 AM | 33 (15.1%) | 0 (0.0%) |
| 6:30 AM to 6:59 AM | 35 (16.0%) | 18 (9.7%) |
| 7:00 AM to 7:29 AM | 0 (0.0%) | 40 (21.5%) |
| 7:30 AM to 7:59 AM | 50 (22.8%) | 50 (26.9%) |
| 8:00 AM to 8:29 AM | 0 (0.0%) | 12 (6.5%) |
| 8:30 AM to 8:59 AM | 0 (0.0%) | 0 (0.0%) |
| 9:00 AM to 9:59 AM | 18 (8.2%) | 44 (23.7%) |
| 10:00 AM to 10:59 AM | 0 (0.0%) | 9 (4.8%) |
| 11:00 AM to 11:59 AM | 0 (0.0%) | 0 (0.0%) |
| 12:00 PM to 3:59 PM | 0 (0.0%) | 0 (0.0%) |
| 4:00 PM to 11:59 PM | 3 (1.4%) | 13 (7.0%) |
| Total | 219 (100.0%) | 186 (100.0%) |
Housing Occupancy in Babson Park
Occupancy by Ownership in Babson Park
Of the total 249 dwellings in Babson Park, owner-occupied units account for 191 (76.7%), while renter-occupied units make up 58 (23.3%).
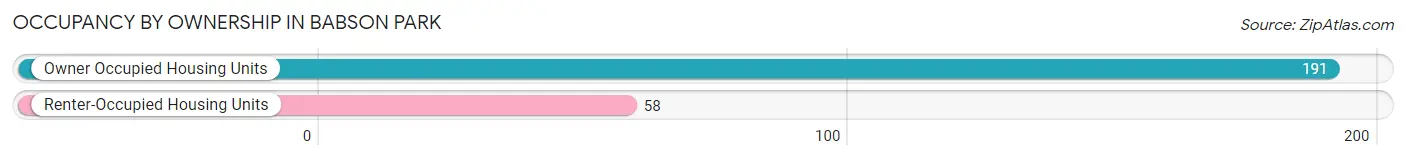
| Occupancy | # Housing Units | % Housing Units |
| Owner Occupied Housing Units | 191 | 76.7% |
| Renter-Occupied Housing Units | 58 | 23.3% |
| Total Occupied Housing Units | 249 | 100.0% |
Occupancy by Household Size in Babson Park
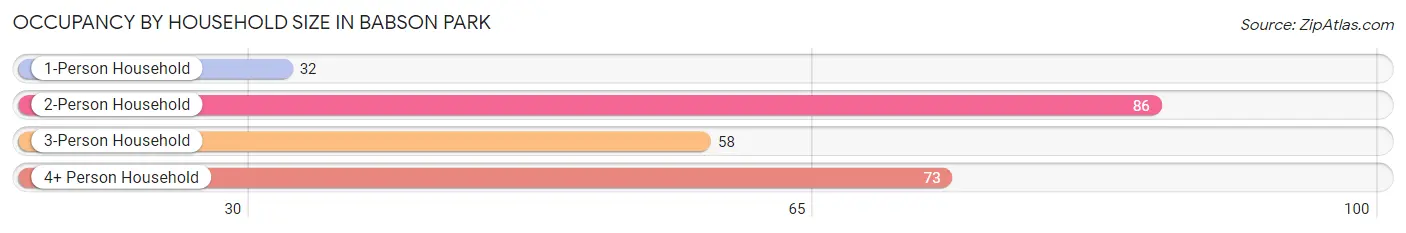
| Household Size | # Housing Units | % Housing Units |
| 1-Person Household | 32 | 12.9% |
| 2-Person Household | 86 | 34.5% |
| 3-Person Household | 58 | 23.3% |
| 4+ Person Household | 73 | 29.3% |
| Total Housing Units | 249 | 100.0% |
Occupancy by Ownership by Household Size in Babson Park
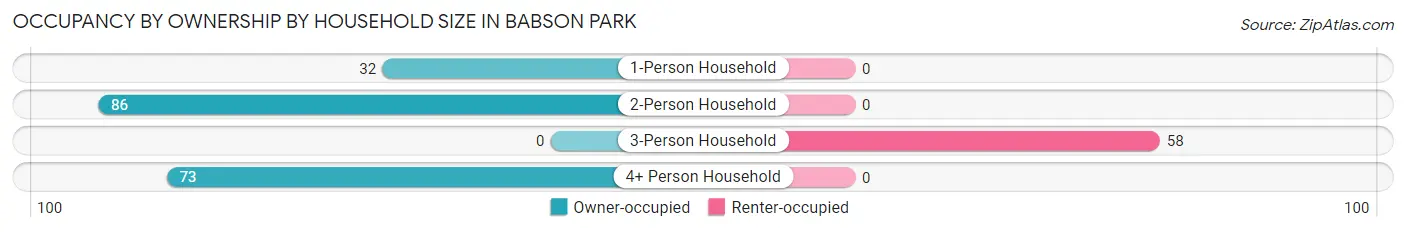
| Household Size | Owner-occupied | Renter-occupied |
| 1-Person Household | 32 (100.0%) | 0 (0.0%) |
| 2-Person Household | 86 (100.0%) | 0 (0.0%) |
| 3-Person Household | 0 (0.0%) | 58 (100.0%) |
| 4+ Person Household | 73 (100.0%) | 0 (0.0%) |
| Total Housing Units | 191 (76.7%) | 58 (23.3%) |
Occupancy by Educational Attainment in Babson Park
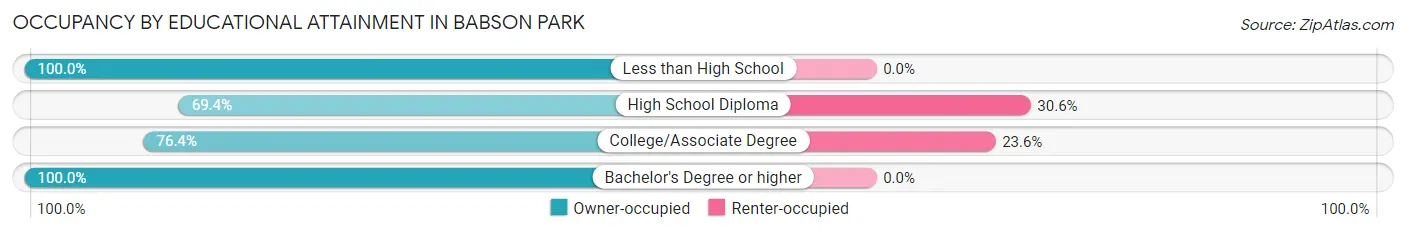
| Household Size | Owner-occupied | Renter-occupied |
| Less than High School | 33 (100.0%) | 0 (0.0%) |
| High School Diploma | 84 (69.4%) | 37 (30.6%) |
| College/Associate Degree | 68 (76.4%) | 21 (23.6%) |
| Bachelor's Degree or higher | 6 (100.0%) | 0 (0.0%) |
Occupancy by Age of Householder in Babson Park
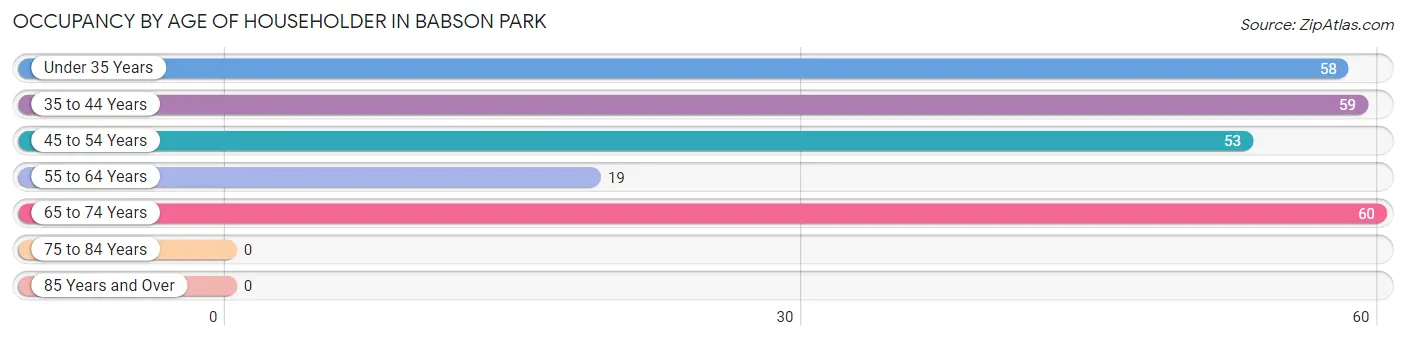
| Age Bracket | # Households | % Households |
| Under 35 Years | 58 | 23.3% |
| 35 to 44 Years | 59 | 23.7% |
| 45 to 54 Years | 53 | 21.3% |
| 55 to 64 Years | 19 | 7.6% |
| 65 to 74 Years | 60 | 24.1% |
| 75 to 84 Years | 0 | 0.0% |
| 85 Years and Over | 0 | 0.0% |
| Total | 249 | 100.0% |
Housing Finances in Babson Park
Median Income by Occupancy in Babson Park
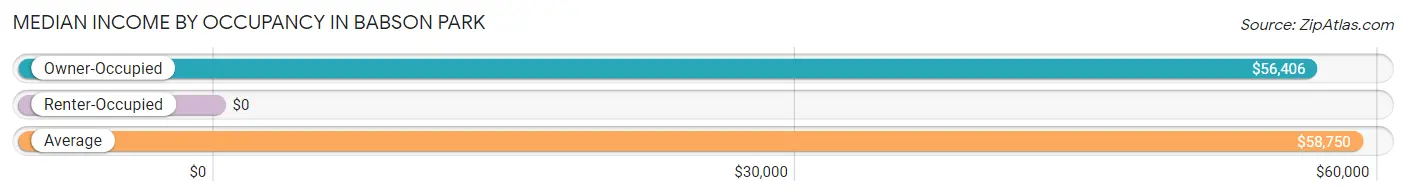
| Occupancy Type | # Households | Median Income |
| Owner-Occupied | 191 (76.7%) | $56,406 |
| Renter-Occupied | 58 (23.3%) | $0 |
| Average | 249 (100.0%) | $58,750 |
Occupancy by Householder Income Bracket in Babson Park
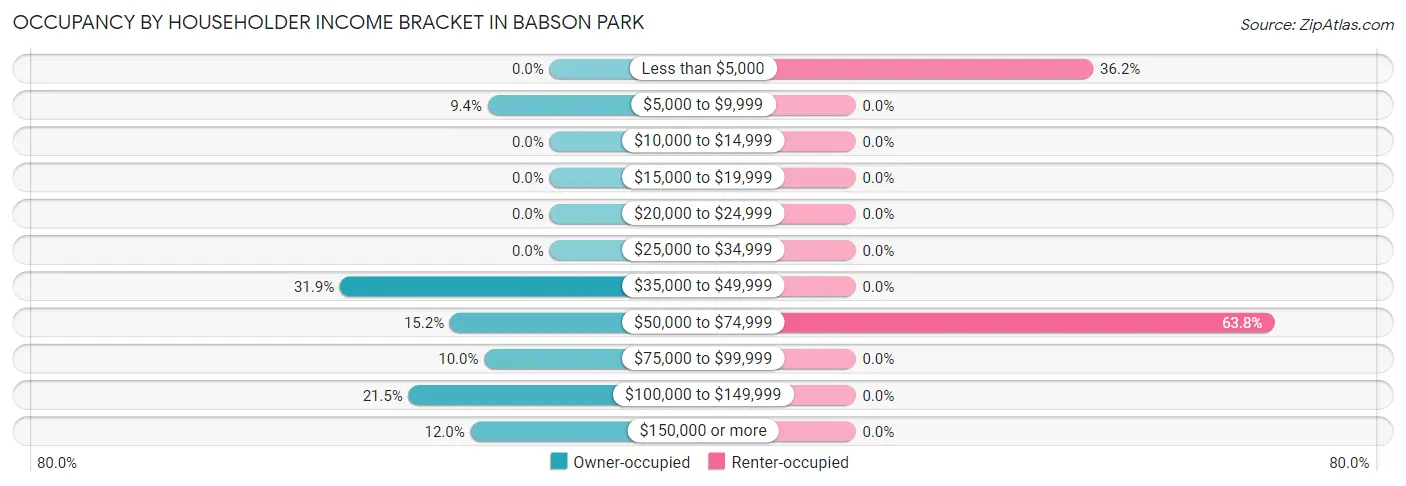
| Income Bracket | Owner-occupied | Renter-occupied |
| Less than $5,000 | 0 (0.0%) | 21 (36.2%) |
| $5,000 to $9,999 | 18 (9.4%) | 0 (0.0%) |
| $10,000 to $14,999 | 0 (0.0%) | 0 (0.0%) |
| $15,000 to $19,999 | 0 (0.0%) | 0 (0.0%) |
| $20,000 to $24,999 | 0 (0.0%) | 0 (0.0%) |
| $25,000 to $34,999 | 0 (0.0%) | 0 (0.0%) |
| $35,000 to $49,999 | 61 (31.9%) | 0 (0.0%) |
| $50,000 to $74,999 | 29 (15.2%) | 37 (63.8%) |
| $75,000 to $99,999 | 19 (10.0%) | 0 (0.0%) |
| $100,000 to $149,999 | 41 (21.5%) | 0 (0.0%) |
| $150,000 or more | 23 (12.0%) | 0 (0.0%) |
| Total | 191 (100.0%) | 58 (100.0%) |
Monthly Housing Cost Tiers in Babson Park
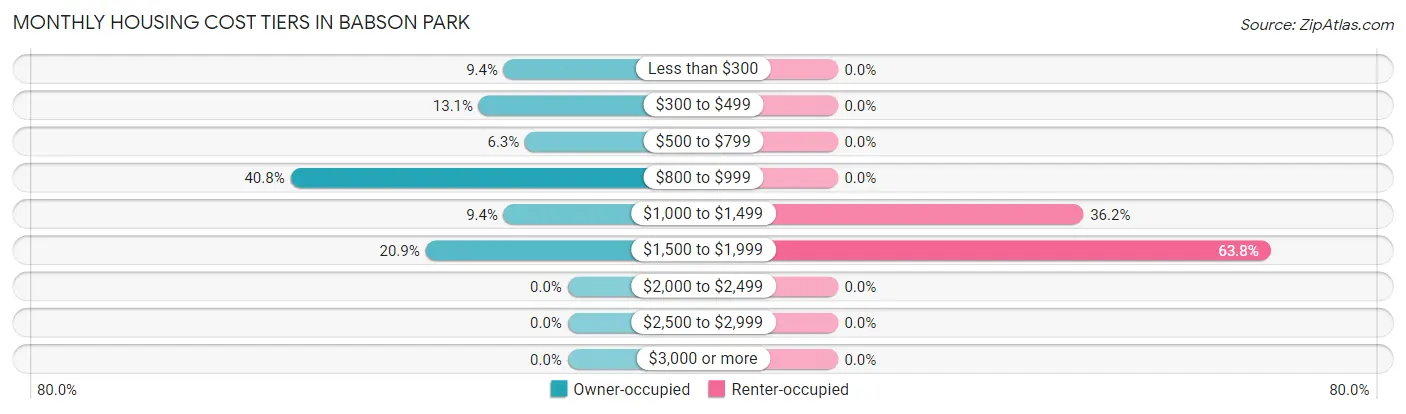
| Monthly Cost | Owner-occupied | Renter-occupied |
| Less than $300 | 18 (9.4%) | 0 (0.0%) |
| $300 to $499 | 25 (13.1%) | 0 (0.0%) |
| $500 to $799 | 12 (6.3%) | 0 (0.0%) |
| $800 to $999 | 78 (40.8%) | 0 (0.0%) |
| $1,000 to $1,499 | 18 (9.4%) | 21 (36.2%) |
| $1,500 to $1,999 | 40 (20.9%) | 37 (63.8%) |
| $2,000 to $2,499 | 0 (0.0%) | 0 (0.0%) |
| $2,500 to $2,999 | 0 (0.0%) | 0 (0.0%) |
| $3,000 or more | 0 (0.0%) | 0 (0.0%) |
| Total | 191 (100.0%) | 58 (100.0%) |
Physical Housing Characteristics in Babson Park
Housing Structures in Babson Park
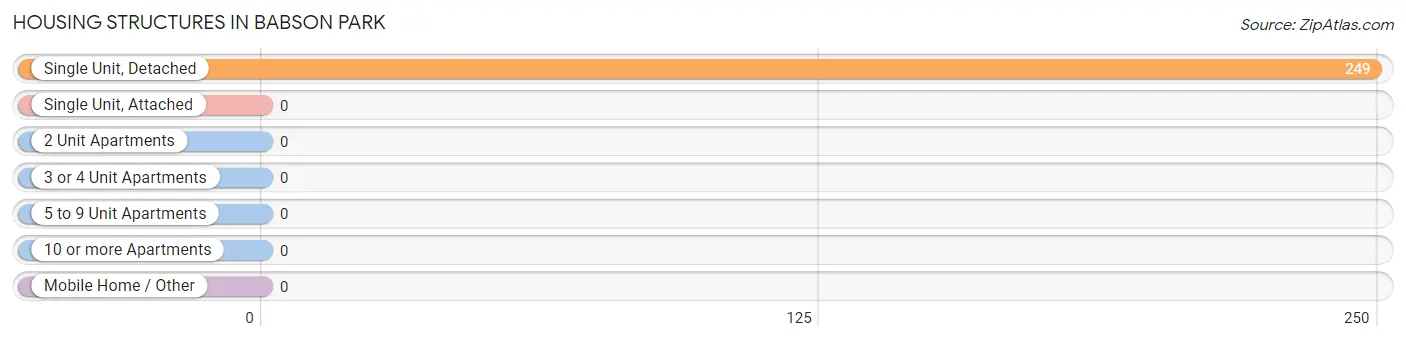
| Structure Type | # Housing Units | % Housing Units |
| Single Unit, Detached | 249 | 100.0% |
| Single Unit, Attached | 0 | 0.0% |
| 2 Unit Apartments | 0 | 0.0% |
| 3 or 4 Unit Apartments | 0 | 0.0% |
| 5 to 9 Unit Apartments | 0 | 0.0% |
| 10 or more Apartments | 0 | 0.0% |
| Mobile Home / Other | 0 | 0.0% |
| Total | 249 | 100.0% |
Housing Structures by Occupancy in Babson Park
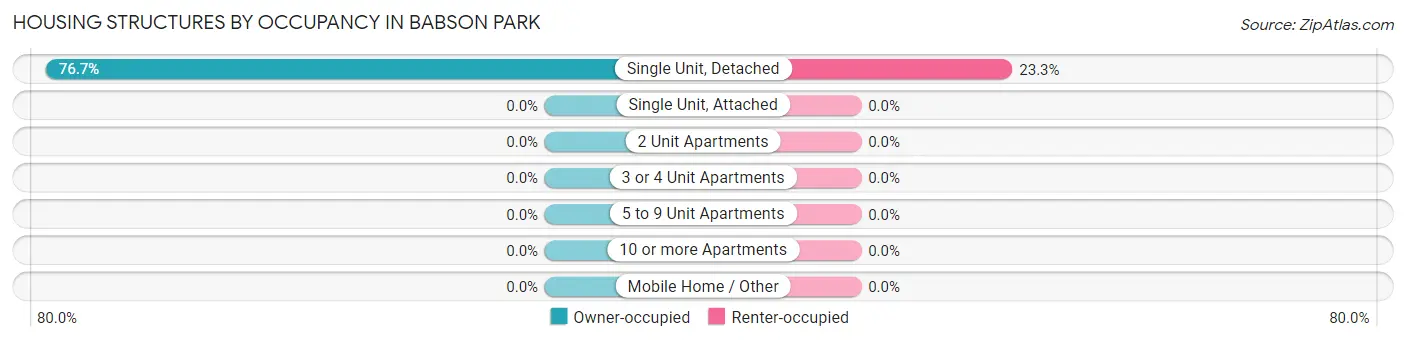
| Structure Type | Owner-occupied | Renter-occupied |
| Single Unit, Detached | 191 (76.7%) | 58 (23.3%) |
| Single Unit, Attached | 0 (0.0%) | 0 (0.0%) |
| 2 Unit Apartments | 0 (0.0%) | 0 (0.0%) |
| 3 or 4 Unit Apartments | 0 (0.0%) | 0 (0.0%) |
| 5 to 9 Unit Apartments | 0 (0.0%) | 0 (0.0%) |
| 10 or more Apartments | 0 (0.0%) | 0 (0.0%) |
| Mobile Home / Other | 0 (0.0%) | 0 (0.0%) |
| Total | 191 (76.7%) | 58 (23.3%) |
Housing Structures by Number of Rooms in Babson Park
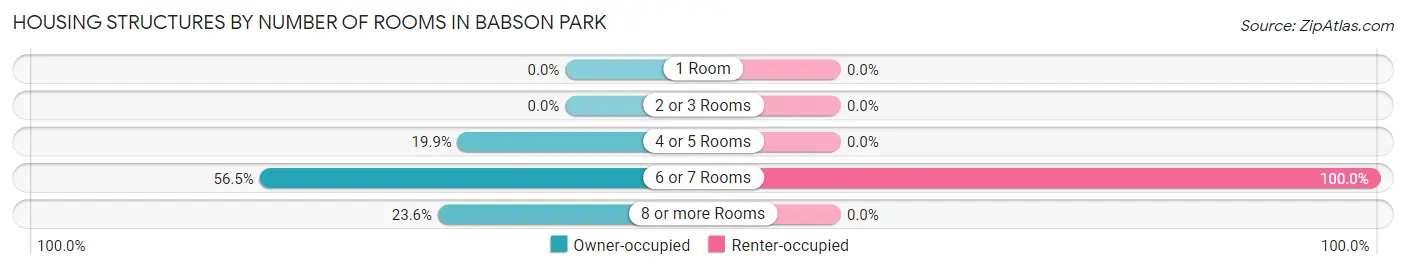
| Number of Rooms | Owner-occupied | Renter-occupied |
| 1 Room | 0 (0.0%) | 0 (0.0%) |
| 2 or 3 Rooms | 0 (0.0%) | 0 (0.0%) |
| 4 or 5 Rooms | 38 (19.9%) | 0 (0.0%) |
| 6 or 7 Rooms | 108 (56.5%) | 58 (100.0%) |
| 8 or more Rooms | 45 (23.6%) | 0 (0.0%) |
| Total | 191 (100.0%) | 58 (100.0%) |
Housing Structure by Heating Type in Babson Park
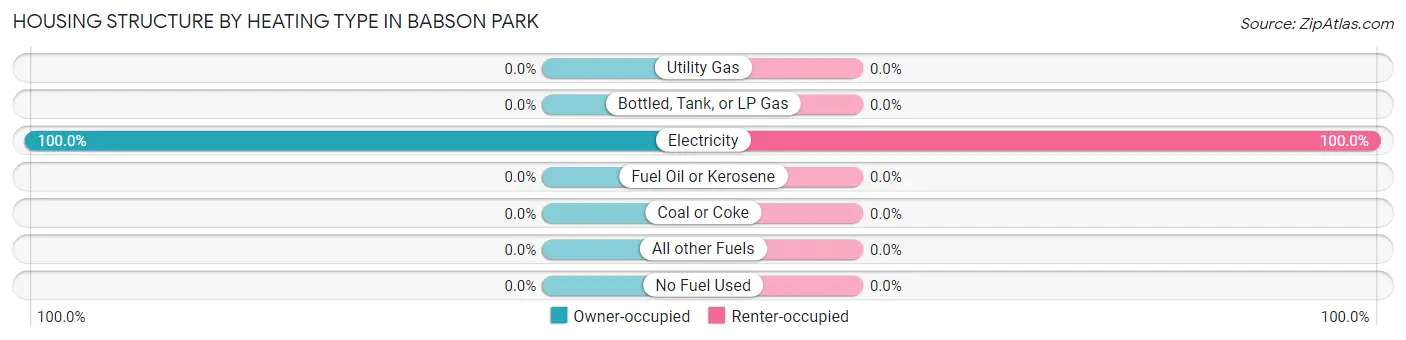
| Heating Type | Owner-occupied | Renter-occupied |
| Utility Gas | 0 (0.0%) | 0 (0.0%) |
| Bottled, Tank, or LP Gas | 0 (0.0%) | 0 (0.0%) |
| Electricity | 191 (100.0%) | 58 (100.0%) |
| Fuel Oil or Kerosene | 0 (0.0%) | 0 (0.0%) |
| Coal or Coke | 0 (0.0%) | 0 (0.0%) |
| All other Fuels | 0 (0.0%) | 0 (0.0%) |
| No Fuel Used | 0 (0.0%) | 0 (0.0%) |
| Total | 191 (100.0%) | 58 (100.0%) |
Household Vehicle Usage in Babson Park
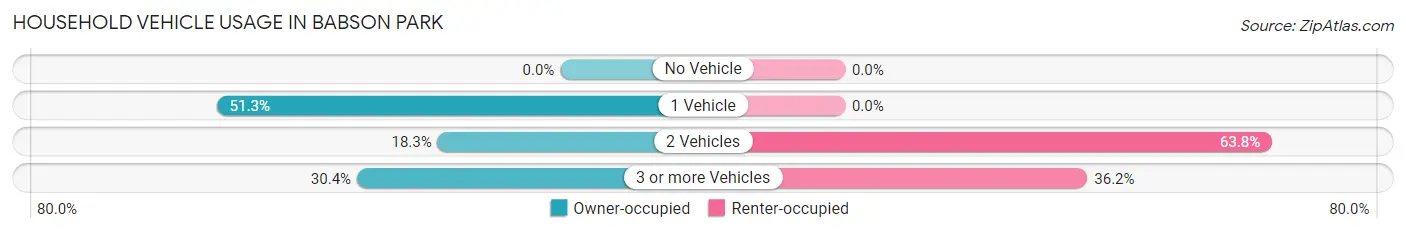
| Vehicles per Household | Owner-occupied | Renter-occupied |
| No Vehicle | 0 (0.0%) | 0 (0.0%) |
| 1 Vehicle | 98 (51.3%) | 0 (0.0%) |
| 2 Vehicles | 35 (18.3%) | 37 (63.8%) |
| 3 or more Vehicles | 58 (30.4%) | 21 (36.2%) |
| Total | 191 (100.0%) | 58 (100.0%) |
Real Estate & Mortgages in Babson Park
Real Estate and Mortgage Overview in Babson Park
| Characteristic | Without Mortgage | With Mortgage |
| Housing Units | 68 | 123 |
| Median Property Value | - | - |
| Median Household Income | - | - |
| Monthly Housing Costs | $447 | $0 |
| Real Estate Taxes | - | - |
Property Value by Mortgage Status in Babson Park
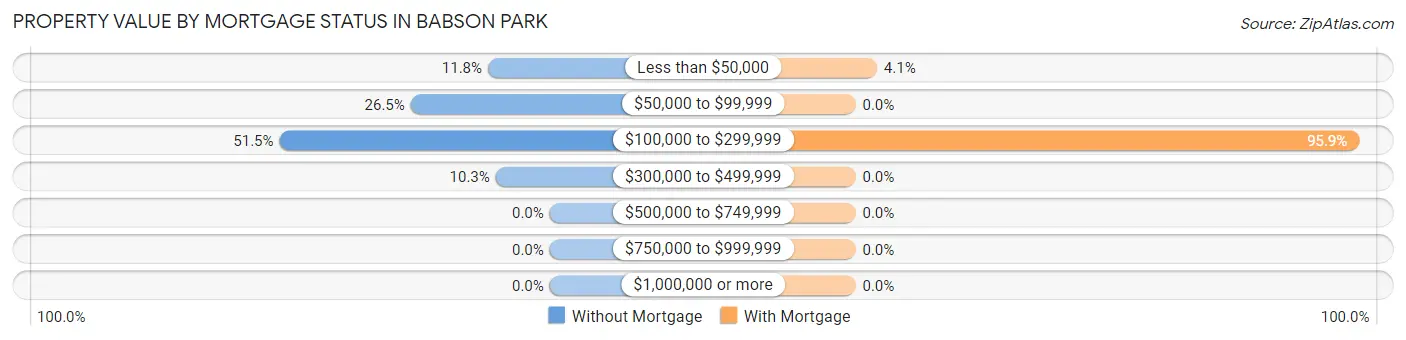
| Property Value | Without Mortgage | With Mortgage |
| Less than $50,000 | 8 (11.8%) | 5 (4.1%) |
| $50,000 to $99,999 | 18 (26.5%) | 0 (0.0%) |
| $100,000 to $299,999 | 35 (51.5%) | 118 (95.9%) |
| $300,000 to $499,999 | 7 (10.3%) | 0 (0.0%) |
| $500,000 to $749,999 | 0 (0.0%) | 0 (0.0%) |
| $750,000 to $999,999 | 0 (0.0%) | 0 (0.0%) |
| $1,000,000 or more | 0 (0.0%) | 0 (0.0%) |
| Total | 68 (100.0%) | 123 (100.0%) |
Household Income by Mortgage Status in Babson Park
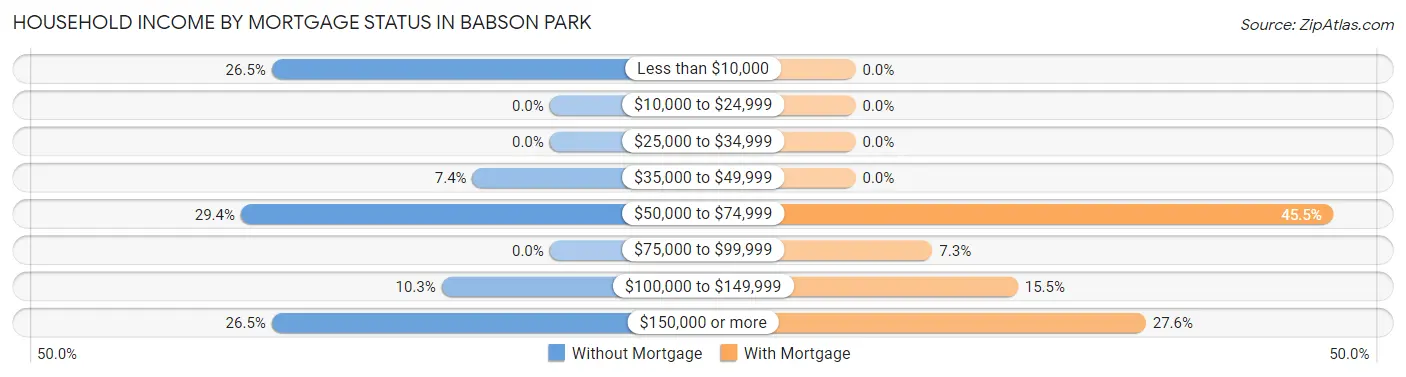
| Household Income | Without Mortgage | With Mortgage |
| Less than $10,000 | 18 (26.5%) | 0 (0.0%) |
| $10,000 to $24,999 | 0 (0.0%) | 0 (0.0%) |
| $25,000 to $34,999 | 0 (0.0%) | 0 (0.0%) |
| $35,000 to $49,999 | 5 (7.3%) | 0 (0.0%) |
| $50,000 to $74,999 | 20 (29.4%) | 56 (45.5%) |
| $75,000 to $99,999 | 0 (0.0%) | 9 (7.3%) |
| $100,000 to $149,999 | 7 (10.3%) | 19 (15.4%) |
| $150,000 or more | 18 (26.5%) | 34 (27.6%) |
| Total | 68 (100.0%) | 123 (100.0%) |
Property Value to Household Income Ratio in Babson Park
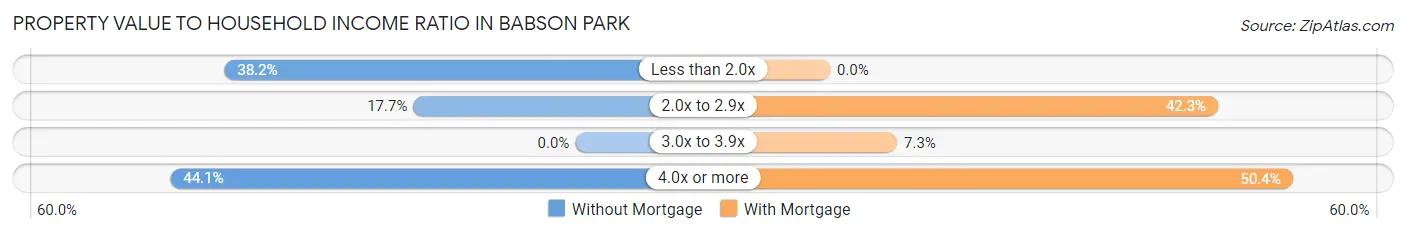
| Value-to-Income Ratio | Without Mortgage | With Mortgage |
| Less than 2.0x | 26 (38.2%) | 0 (0.0%) |
| 2.0x to 2.9x | 12 (17.6%) | 52 (42.3%) |
| 3.0x to 3.9x | 0 (0.0%) | 9 (7.3%) |
| 4.0x or more | 30 (44.1%) | 62 (50.4%) |
| Total | 68 (100.0%) | 123 (100.0%) |
Real Estate Taxes by Mortgage Status in Babson Park
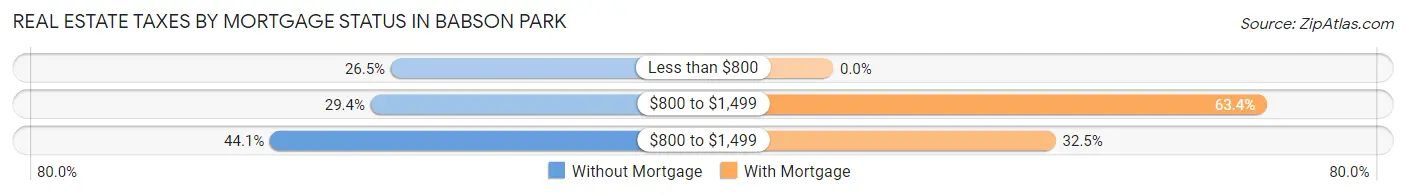
| Property Taxes | Without Mortgage | With Mortgage |
| Less than $800 | 18 (26.5%) | 0 (0.0%) |
| $800 to $1,499 | 20 (29.4%) | 78 (63.4%) |
| $800 to $1,499 | 30 (44.1%) | 40 (32.5%) |
| Total | 68 (100.0%) | 123 (100.0%) |
Health & Disability in Babson Park
Health Insurance Coverage by Age in Babson Park
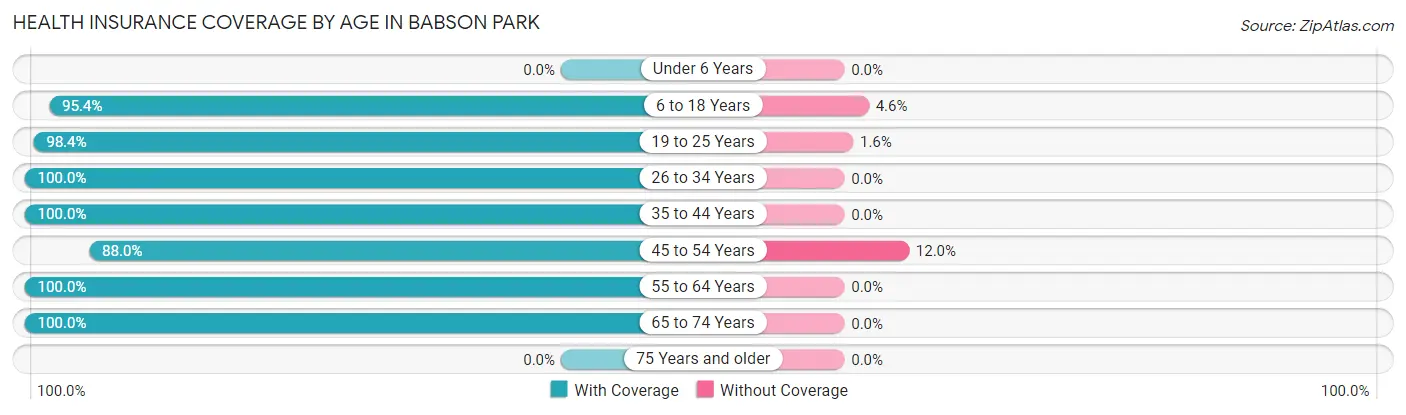
| Age Bracket | With Coverage | Without Coverage |
| Under 6 Years | 0 (0.0%) | 0 (0.0%) |
| 6 to 18 Years | 230 (95.4%) | 11 (4.6%) |
| 19 to 25 Years | 361 (98.4%) | 6 (1.6%) |
| 26 to 34 Years | 104 (100.0%) | 0 (0.0%) |
| 35 to 44 Years | 92 (100.0%) | 0 (0.0%) |
| 45 to 54 Years | 95 (88.0%) | 13 (12.0%) |
| 55 to 64 Years | 69 (100.0%) | 0 (0.0%) |
| 65 to 74 Years | 90 (100.0%) | 0 (0.0%) |
| 75 Years and older | 0 (0.0%) | 0 (0.0%) |
| Total | 1,041 (97.2%) | 30 (2.8%) |
Health Insurance Coverage by Citizenship Status in Babson Park
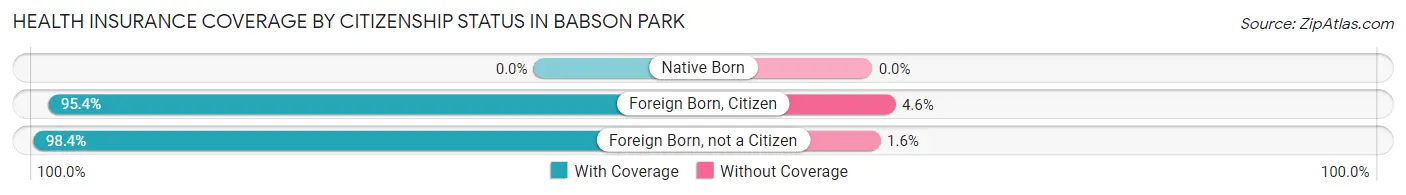
| Citizenship Status | With Coverage | Without Coverage |
| Native Born | 0 (0.0%) | 0 (0.0%) |
| Foreign Born, Citizen | 230 (95.4%) | 11 (4.6%) |
| Foreign Born, not a Citizen | 361 (98.4%) | 6 (1.6%) |
Health Insurance Coverage by Household Income in Babson Park
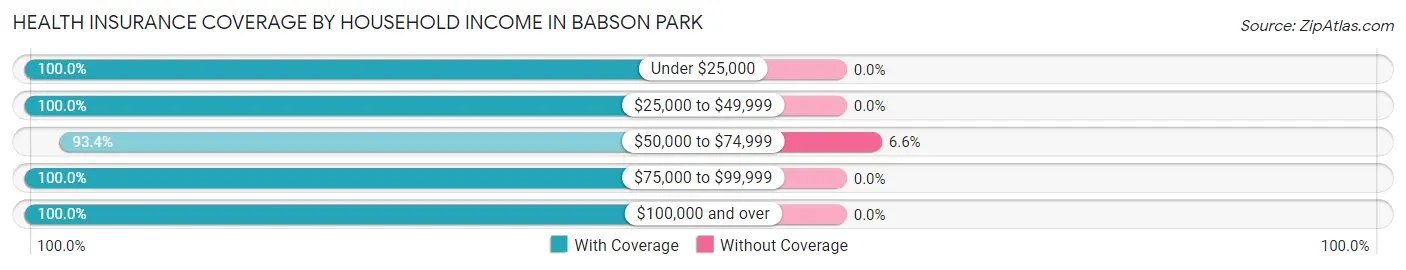
| Household Income | With Coverage | Without Coverage |
| Under $25,000 | 97 (100.0%) | 0 (0.0%) |
| $25,000 to $49,999 | 89 (100.0%) | 0 (0.0%) |
| $50,000 to $74,999 | 185 (93.4%) | 13 (6.6%) |
| $75,000 to $99,999 | 77 (100.0%) | 0 (0.0%) |
| $100,000 and over | 295 (100.0%) | 0 (0.0%) |
Public vs Private Health Insurance Coverage by Age in Babson Park
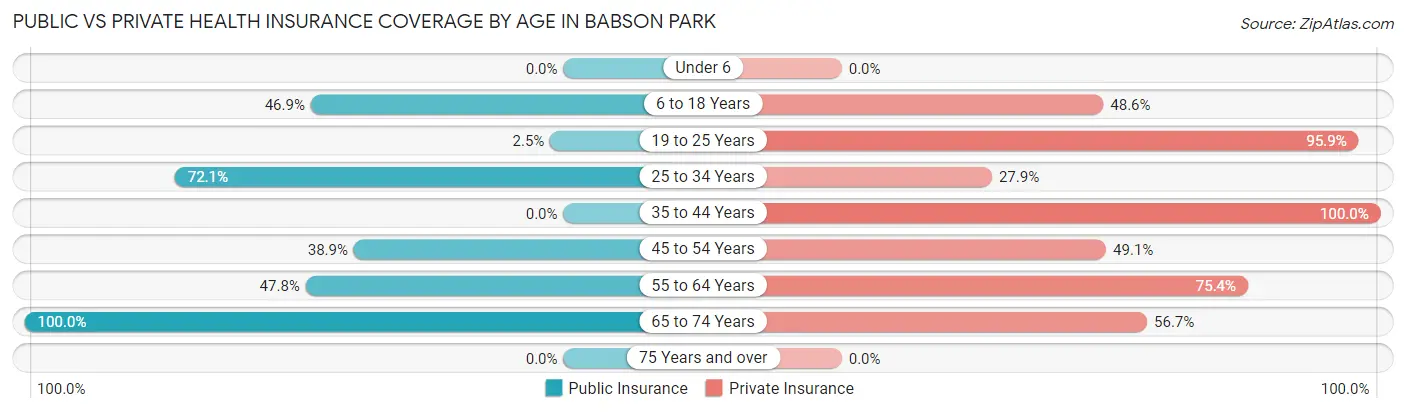
| Age Bracket | Public Insurance | Private Insurance |
| Under 6 | 0 (0.0%) | 0 (0.0%) |
| 6 to 18 Years | 113 (46.9%) | 117 (48.5%) |
| 19 to 25 Years | 9 (2.5%) | 352 (95.9%) |
| 25 to 34 Years | 75 (72.1%) | 29 (27.9%) |
| 35 to 44 Years | 0 (0.0%) | 92 (100.0%) |
| 45 to 54 Years | 42 (38.9%) | 53 (49.1%) |
| 55 to 64 Years | 33 (47.8%) | 52 (75.4%) |
| 65 to 74 Years | 90 (100.0%) | 51 (56.7%) |
| 75 Years and over | 0 (0.0%) | 0 (0.0%) |
| Total | 362 (33.8%) | 746 (69.7%) |
Disability Status by Sex by Age in Babson Park
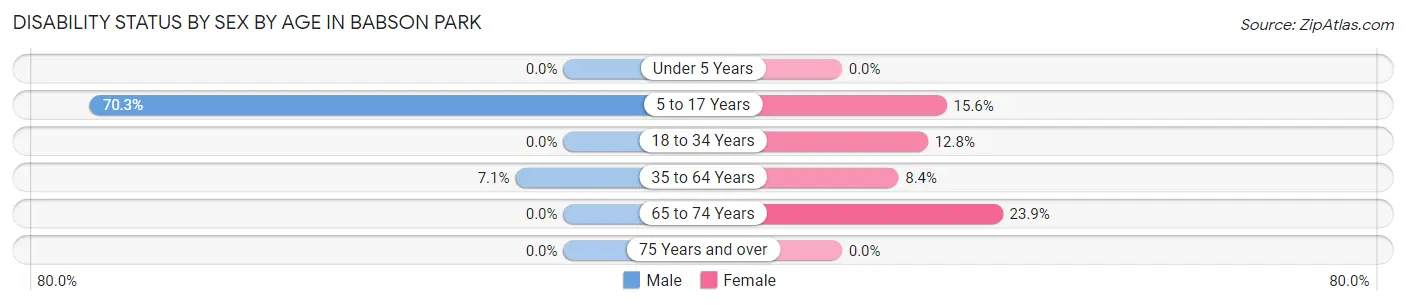
| Age Bracket | Male | Female |
| Under 5 Years | 0 (0.0%) | 0 (0.0%) |
| 5 to 17 Years | 45 (70.3%) | 14 (15.6%) |
| 18 to 34 Years | 0 (0.0%) | 37 (12.8%) |
| 35 to 64 Years | 9 (7.1%) | 12 (8.4%) |
| 65 to 74 Years | 0 (0.0%) | 16 (23.9%) |
| 75 Years and over | 0 (0.0%) | 0 (0.0%) |
Disability Class by Sex by Age in Babson Park
Disability Class: Hearing Difficulty
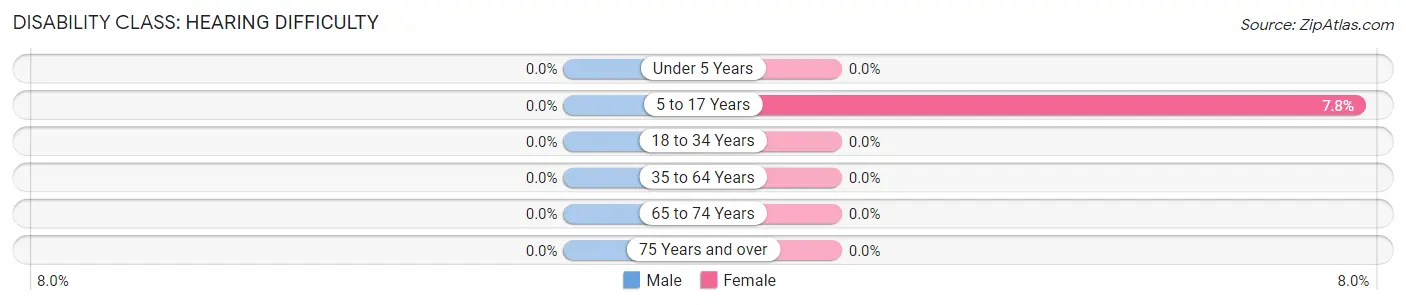
| Age Bracket | Male | Female |
| Under 5 Years | 0 (0.0%) | 0 (0.0%) |
| 5 to 17 Years | 0 (0.0%) | 7 (7.8%) |
| 18 to 34 Years | 0 (0.0%) | 0 (0.0%) |
| 35 to 64 Years | 0 (0.0%) | 0 (0.0%) |
| 65 to 74 Years | 0 (0.0%) | 0 (0.0%) |
| 75 Years and over | 0 (0.0%) | 0 (0.0%) |
Disability Class: Vision Difficulty
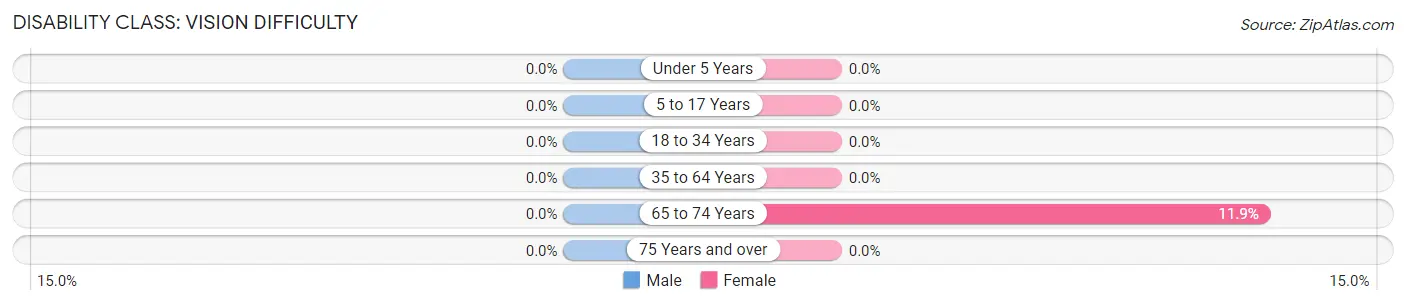
| Age Bracket | Male | Female |
| Under 5 Years | 0 (0.0%) | 0 (0.0%) |
| 5 to 17 Years | 0 (0.0%) | 0 (0.0%) |
| 18 to 34 Years | 0 (0.0%) | 0 (0.0%) |
| 35 to 64 Years | 0 (0.0%) | 0 (0.0%) |
| 65 to 74 Years | 0 (0.0%) | 8 (11.9%) |
| 75 Years and over | 0 (0.0%) | 0 (0.0%) |
Disability Class: Cognitive Difficulty
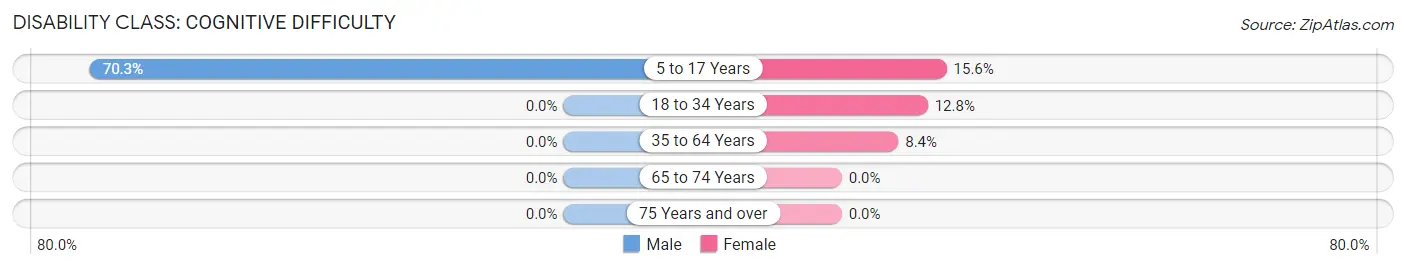
| Age Bracket | Male | Female |
| 5 to 17 Years | 45 (70.3%) | 14 (15.6%) |
| 18 to 34 Years | 0 (0.0%) | 37 (12.8%) |
| 35 to 64 Years | 0 (0.0%) | 12 (8.4%) |
| 65 to 74 Years | 0 (0.0%) | 0 (0.0%) |
| 75 Years and over | 0 (0.0%) | 0 (0.0%) |
Disability Class: Ambulatory Difficulty
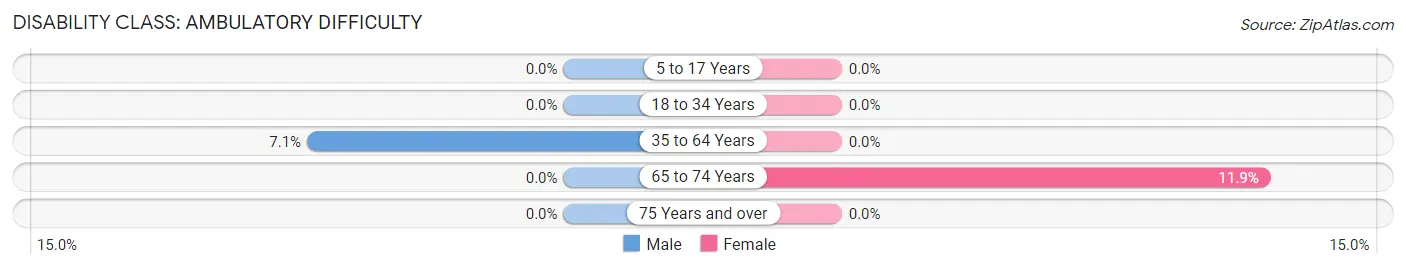
| Age Bracket | Male | Female |
| 5 to 17 Years | 0 (0.0%) | 0 (0.0%) |
| 18 to 34 Years | 0 (0.0%) | 0 (0.0%) |
| 35 to 64 Years | 9 (7.1%) | 0 (0.0%) |
| 65 to 74 Years | 0 (0.0%) | 8 (11.9%) |
| 75 Years and over | 0 (0.0%) | 0 (0.0%) |
Disability Class: Self-Care Difficulty
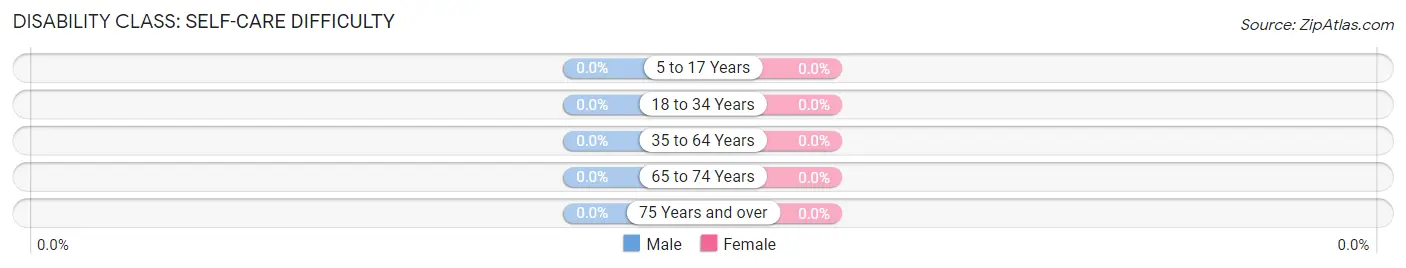
| Age Bracket | Male | Female |
| 5 to 17 Years | 0 (0.0%) | 0 (0.0%) |
| 18 to 34 Years | 0 (0.0%) | 0 (0.0%) |
| 35 to 64 Years | 0 (0.0%) | 0 (0.0%) |
| 65 to 74 Years | 0 (0.0%) | 0 (0.0%) |
| 75 Years and over | 0 (0.0%) | 0 (0.0%) |
Technology Access in Babson Park
Computing Device Access in Babson Park
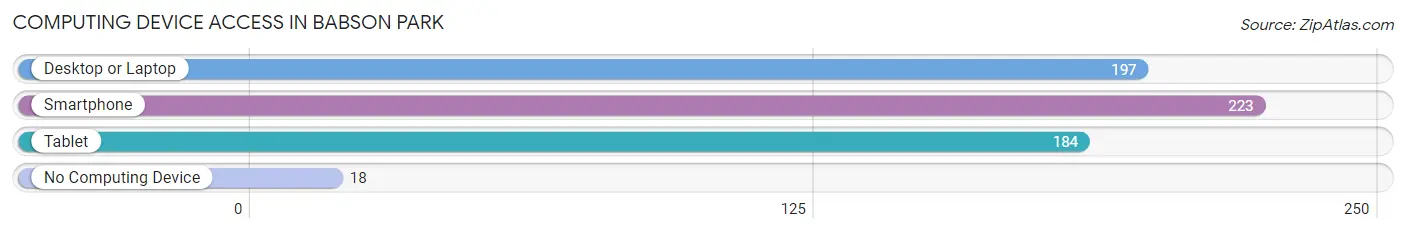
| Device Type | # Households | % Households |
| Desktop or Laptop | 197 | 79.1% |
| Smartphone | 223 | 89.6% |
| Tablet | 184 | 73.9% |
| No Computing Device | 18 | 7.2% |
| Total | 249 | 100.0% |
Internet Access in Babson Park
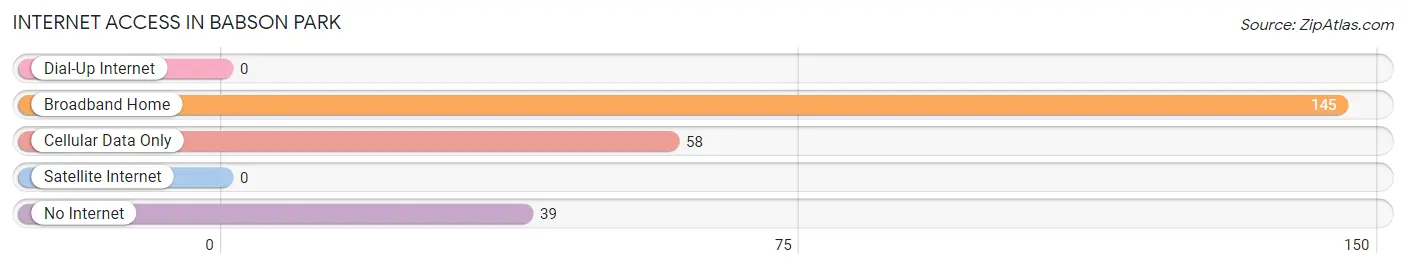
| Internet Type | # Households | % Households |
| Dial-Up Internet | 0 | 0.0% |
| Broadband Home | 145 | 58.2% |
| Cellular Data Only | 58 | 23.3% |
| Satellite Internet | 0 | 0.0% |
| No Internet | 39 | 15.7% |
| Total | 249 | 100.0% |
Babson Park Summary
Babson Park is a small unincorporated community located in Polk County, Florida, United States. It is located on the south shore of Crooked Lake, just east of Lake Wales. The population was estimated to be around 1,000 in 2020.
History
Babson Park was founded in the early 1900s by Roger Babson, an entrepreneur and founder of the Babson Institute. He purchased the land from the State of Florida in order to create a resort community. The town was named after him and was incorporated in 1925.
The town was originally a resort community, with a hotel, golf course, and other amenities. It was also home to a number of citrus groves and other agricultural operations.
In the 1950s, the town began to decline as the citrus industry declined and the resort industry moved elsewhere. The town was eventually annexed by the City of Lake Wales in the 1970s.
Geography
Babson Park is located in central Florida, about 25 miles east of Lake Wales. It is situated on the south shore of Crooked Lake, just east of Lake Wales. The town is surrounded by citrus groves and other agricultural operations.
The terrain is mostly flat, with some rolling hills. The average elevation is around 100 feet above sea level.
Economy
The economy of Babson Park is largely based on agriculture. Citrus groves and other agricultural operations are the main sources of employment in the area.
In addition, the town is home to a number of small businesses, including restaurants, retail stores, and other services.
Demographics
As of the 2010 census, the population of Babson Park was 1,000. The racial makeup of the town was 94.2% White, 2.2% African American, 0.2% Native American, 0.2% Asian, 0.2% from other races, and 2.2% from two or more races. Hispanic or Latino of any race were 2.2% of the population.
The median income for a household in the town was $37,500, and the median income for a family was $45,000. The per capita income for the town was $19,000. About 11.2% of families and 14.2% of the population were below the poverty line, including 18.2% of those under age 18 and none of those age 65 or over.
Common Questions
What is Per Capita Income in Babson Park?
Per Capita income in Babson Park is $29,289.
What is the Median Family Income in Babson Park?
Median Family Income in Babson Park is $53,542.
What is the Median Household income in Babson Park?
Median Household Income in Babson Park is $58,750.
What is Inequality or Gini Index in Babson Park?
Inequality or Gini Index in Babson Park is 0.62.
What is the Total Population of Babson Park?
Total Population of Babson Park is 1,071.
What is the Total Male Population of Babson Park?
Total Male Population of Babson Park is 481.
What is the Total Female Population of Babson Park?
Total Female Population of Babson Park is 590.
What is the Ratio of Males per 100 Females in Babson Park?
There are 81.53 Males per 100 Females in Babson Park.
What is the Ratio of Females per 100 Males in Babson Park?
There are 122.66 Females per 100 Males in Babson Park.
What is the Median Population Age in Babson Park?
Median Population Age in Babson Park is 22.0 Years.
What is the Average Family Size in Babson Park
Average Family Size in Babson Park is 2.7 People.
What is the Average Household Size in Babson Park
Average Household Size in Babson Park is 3.0 People.
How Large is the Labor Force in Babson Park?
There are 410 People in the Labor Forcein in Babson Park.
What is the Percentage of People in the Labor Force in Babson Park?
42.9% of People are in the Labor Force in Babson Park.