Palm Beach Shores, FL Map & Demographics
Palm Beach Shores Map
Palm Beach Shores Overview
$79,379
PER CAPITA INCOME
$111,875
AVG FAMILY INCOME
$78,240
AVG HOUSEHOLD INCOME
31.9%
WAGE / INCOME GAP [ % ]
68.1¢/ $1
WAGE / INCOME GAP [ $ ]
0.52
INEQUALITY / GINI INDEX
1,217
TOTAL POPULATION
562
MALE POPULATION
655
FEMALE POPULATION
85.80
MALES / 100 FEMALES
116.55
FEMALES / 100 MALES
60.0
MEDIAN AGE
2.2
AVG FAMILY SIZE
1.6
AVG HOUSEHOLD SIZE
540
LABOR FORCE [ PEOPLE ]
47.0%
PERCENT IN LABOR FORCE
8.9%
UNEMPLOYMENT RATE
Palm Beach Shores Area Codes
Income in Palm Beach Shores
Income Overview in Palm Beach Shores
Per Capita Income in Palm Beach Shores is $79,379, while median incomes of families and households are $111,875 and $78,240 respectively.
| Characteristic | Number | Measure |
| Per Capita Income | 1,217 | $79,379 |
| Median Family Income | 341 | $111,875 |
| Mean Family Income | 341 | $169,443 |
| Median Household Income | 727 | $78,240 |
| Mean Household Income | 727 | $132,137 |
| Income Deficit | 341 | $0 |
| Wage / Income Gap (%) | 1,217 | 31.87% |
| Wage / Income Gap ($) | 1,217 | 68.13¢ per $1 |
| Gini / Inequality Index | 1,217 | 0.52 |
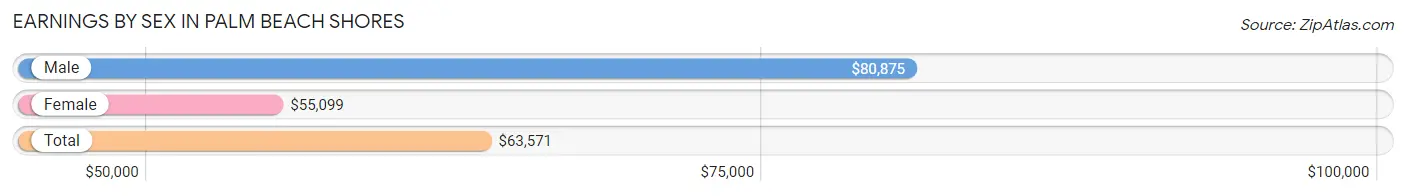
Earnings by Sex in Palm Beach Shores
Average Earnings in Palm Beach Shores are $63,571, $80,875 for men and $55,099 for women, a difference of 31.9%.
| Sex | Number | Average Earnings |
| Male | 339 (55.6%) | $80,875 |
| Female | 271 (44.4%) | $55,099 |
| Total | 610 (100.0%) | $63,571 |
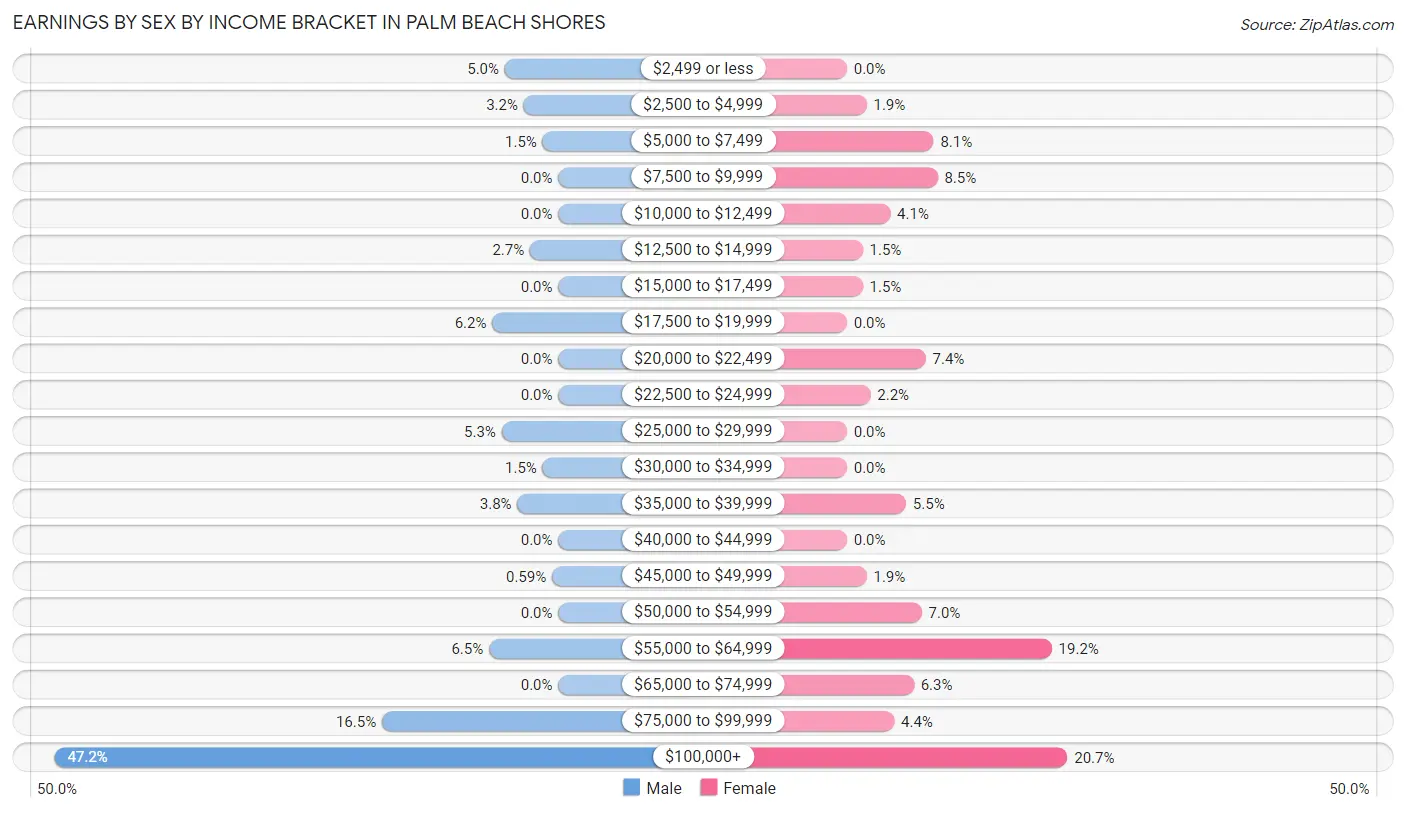
Earnings by Sex by Income Bracket in Palm Beach Shores
The most common earnings brackets in Palm Beach Shores are $100,000+ for men (160 | 47.2%) and $100,000+ for women (56 | 20.7%).
| Income | Male | Female |
| $2,499 or less | 17 (5.0%) | 0 (0.0%) |
| $2,500 to $4,999 | 11 (3.2%) | 5 (1.8%) |
| $5,000 to $7,499 | 5 (1.5%) | 22 (8.1%) |
| $7,500 to $9,999 | 0 (0.0%) | 23 (8.5%) |
| $10,000 to $12,499 | 0 (0.0%) | 11 (4.1%) |
| $12,500 to $14,999 | 9 (2.6%) | 4 (1.5%) |
| $15,000 to $17,499 | 0 (0.0%) | 4 (1.5%) |
| $17,500 to $19,999 | 21 (6.2%) | 0 (0.0%) |
| $20,000 to $22,499 | 0 (0.0%) | 20 (7.4%) |
| $22,500 to $24,999 | 0 (0.0%) | 6 (2.2%) |
| $25,000 to $29,999 | 18 (5.3%) | 0 (0.0%) |
| $30,000 to $34,999 | 5 (1.5%) | 0 (0.0%) |
| $35,000 to $39,999 | 13 (3.8%) | 15 (5.5%) |
| $40,000 to $44,999 | 0 (0.0%) | 0 (0.0%) |
| $45,000 to $49,999 | 2 (0.6%) | 5 (1.8%) |
| $50,000 to $54,999 | 0 (0.0%) | 19 (7.0%) |
| $55,000 to $64,999 | 22 (6.5%) | 52 (19.2%) |
| $65,000 to $74,999 | 0 (0.0%) | 17 (6.3%) |
| $75,000 to $99,999 | 56 (16.5%) | 12 (4.4%) |
| $100,000+ | 160 (47.2%) | 56 (20.7%) |
| Total | 339 (100.0%) | 271 (100.0%) |
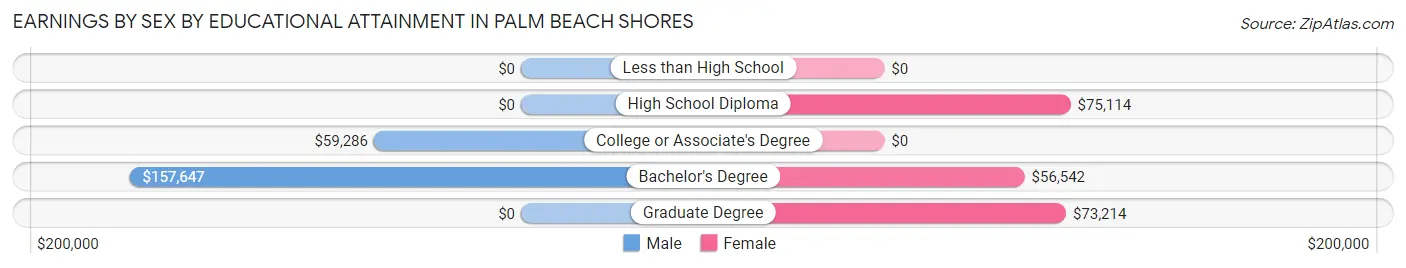
Earnings by Sex by Educational Attainment in Palm Beach Shores
Average earnings in Palm Beach Shores are $82,250 for men and $55,987 for women, a difference of 31.9%. Men with an educational attainment of bachelor's degree enjoy the highest average annual earnings of $157,647, while those with college or associate's degree education earn the least with $59,286. Women with an educational attainment of high school diploma earn the most with the average annual earnings of $75,114, while those with bachelor's degree education have the smallest earnings of $56,542.
| Educational Attainment | Male Income | Female Income |
| Less than High School | - | - |
| High School Diploma | - | - |
| College or Associate's Degree | $59,286 | $0 |
| Bachelor's Degree | $157,647 | $56,542 |
| Graduate Degree | - | - |
| Total | $82,250 | $55,987 |
Family Income in Palm Beach Shores
Family Income Brackets in Palm Beach Shores
According to the Palm Beach Shores family income data, there are 93 families falling into the $200,000+ income range, which is the most common income bracket and makes up 27.3% of all families.
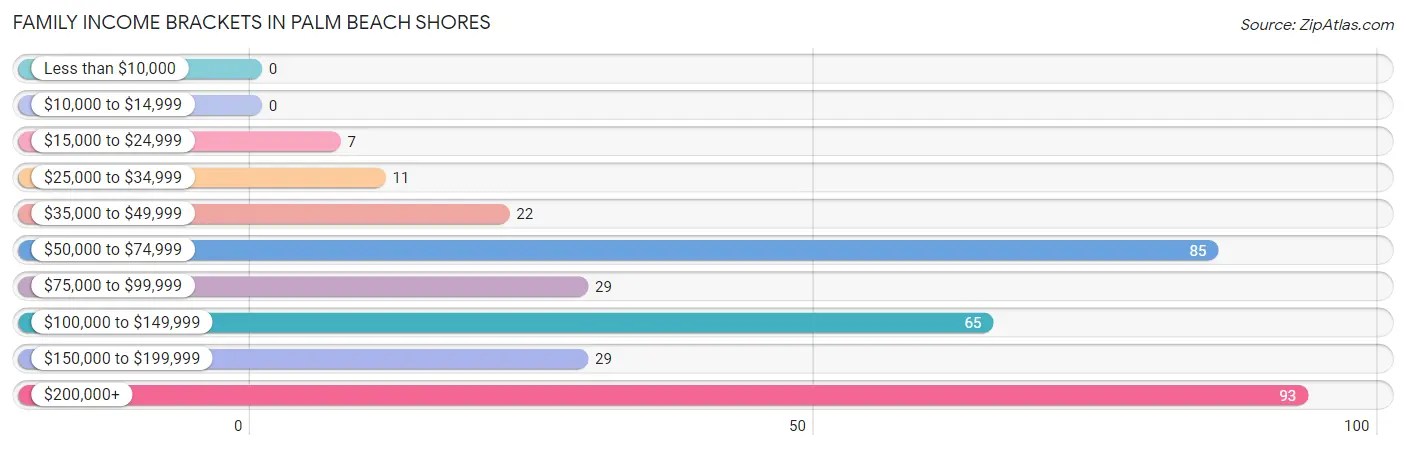
| Income Bracket | # Families | % Families |
| Less than $10,000 | 0 | 0.0% |
| $10,000 to $14,999 | 0 | 0.0% |
| $15,000 to $24,999 | 7 | 2.1% |
| $25,000 to $34,999 | 11 | 3.2% |
| $35,000 to $49,999 | 22 | 6.5% |
| $50,000 to $74,999 | 85 | 24.9% |
| $75,000 to $99,999 | 29 | 8.5% |
| $100,000 to $149,999 | 65 | 19.1% |
| $150,000 to $199,999 | 29 | 8.5% |
| $200,000+ | 93 | 27.3% |
Family Income by Famaliy Size in Palm Beach Shores
3-person families (44 | 12.9%) account for the highest median family income in Palm Beach Shores with $220,595 per family, while 3-person families (44 | 12.9%) have the highest median income of $73,532 per family member.
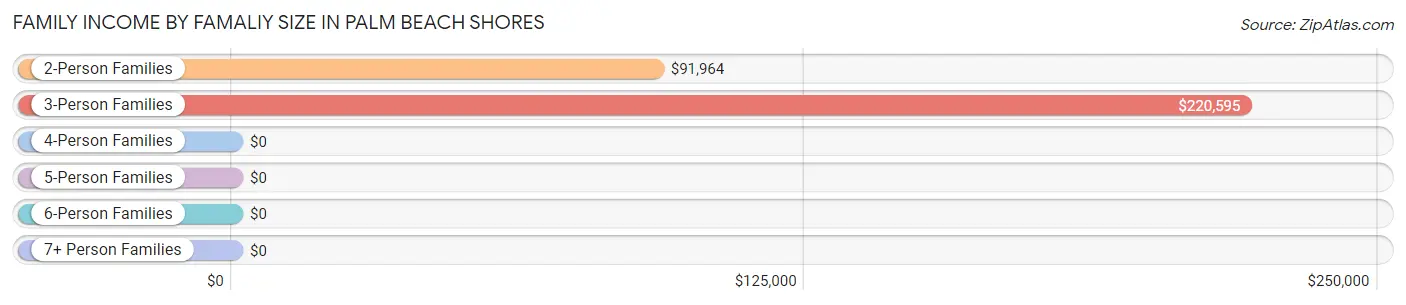
| Income Bracket | # Families | Median Income |
| 2-Person Families | 285 (83.6%) | $91,964 |
| 3-Person Families | 44 (12.9%) | $220,595 |
| 4-Person Families | 11 (3.2%) | $0 |
| 5-Person Families | 0 (0.0%) | $0 |
| 6-Person Families | 1 (0.3%) | $0 |
| 7+ Person Families | 0 (0.0%) | $0 |
| Total | 341 (100.0%) | $111,875 |
Family Income by Number of Earners in Palm Beach Shores
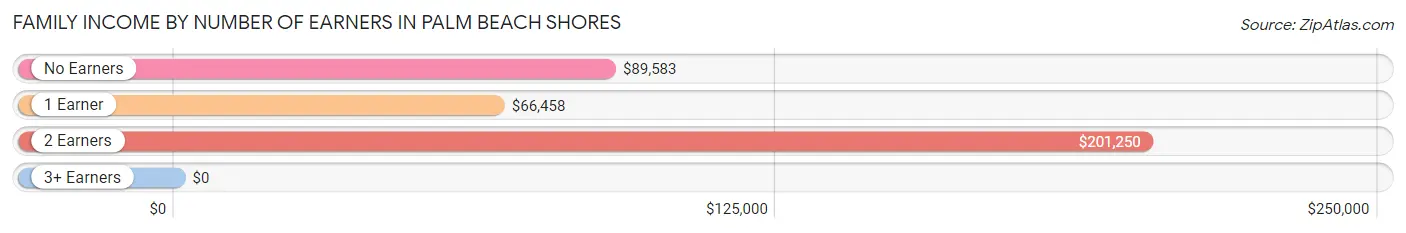
| Number of Earners | # Families | Median Income |
| No Earners | 86 (25.2%) | $89,583 |
| 1 Earner | 127 (37.2%) | $66,458 |
| 2 Earners | 128 (37.5%) | $201,250 |
| 3+ Earners | 0 (0.0%) | $0 |
| Total | 341 (100.0%) | $111,875 |
Household Income in Palm Beach Shores
Household Income Brackets in Palm Beach Shores
With 144 households falling in the category, the $200,000+ income range is the most frequent in Palm Beach Shores, accounting for 19.8% of all households. In contrast, only 10 households (1.4%) fall into the less than $10,000 income bracket, making it the least populous group.
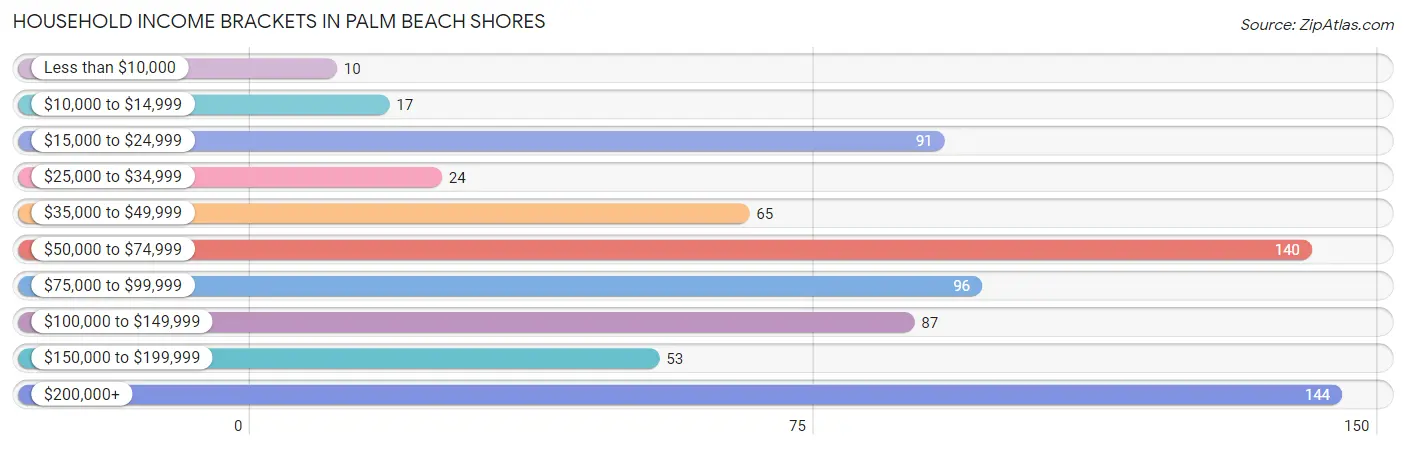
| Income Bracket | # Households | % Households |
| Less than $10,000 | 10 | 1.4% |
| $10,000 to $14,999 | 17 | 2.3% |
| $15,000 to $24,999 | 91 | 12.5% |
| $25,000 to $34,999 | 24 | 3.3% |
| $35,000 to $49,999 | 65 | 8.9% |
| $50,000 to $74,999 | 140 | 19.3% |
| $75,000 to $99,999 | 96 | 13.2% |
| $100,000 to $149,999 | 87 | 12.0% |
| $150,000 to $199,999 | 53 | 7.3% |
| $200,000+ | 144 | 19.8% |
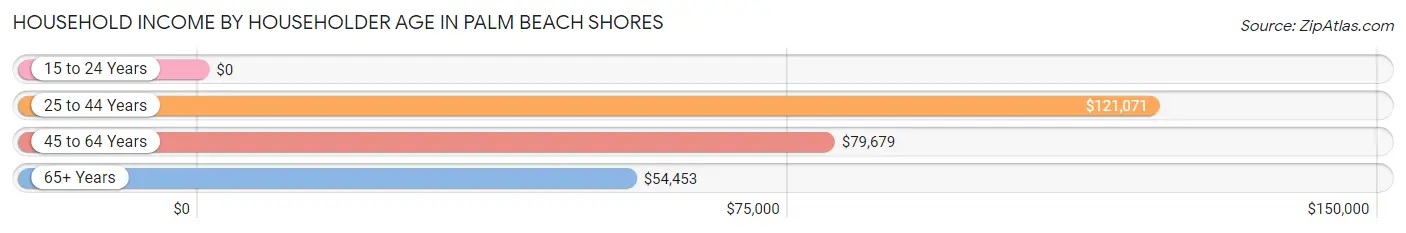
Household Income by Householder Age in Palm Beach Shores
The median household income in Palm Beach Shores is $78,240, with the highest median household income of $121,071 found in the 25 to 44 years age bracket for the primary householder. A total of 88 households (12.1%) fall into this category. Meanwhile, the 15 to 24 years age bracket for the primary householder has the lowest median household income of $0, with 4 households (0.5%) in this group.
| Income Bracket | # Households | Median Income |
| 15 to 24 Years | 4 (0.5%) | $0 |
| 25 to 44 Years | 88 (12.1%) | $121,071 |
| 45 to 64 Years | 298 (41.0%) | $79,679 |
| 65+ Years | 337 (46.4%) | $54,453 |
| Total | 727 (100.0%) | $78,240 |
Poverty in Palm Beach Shores
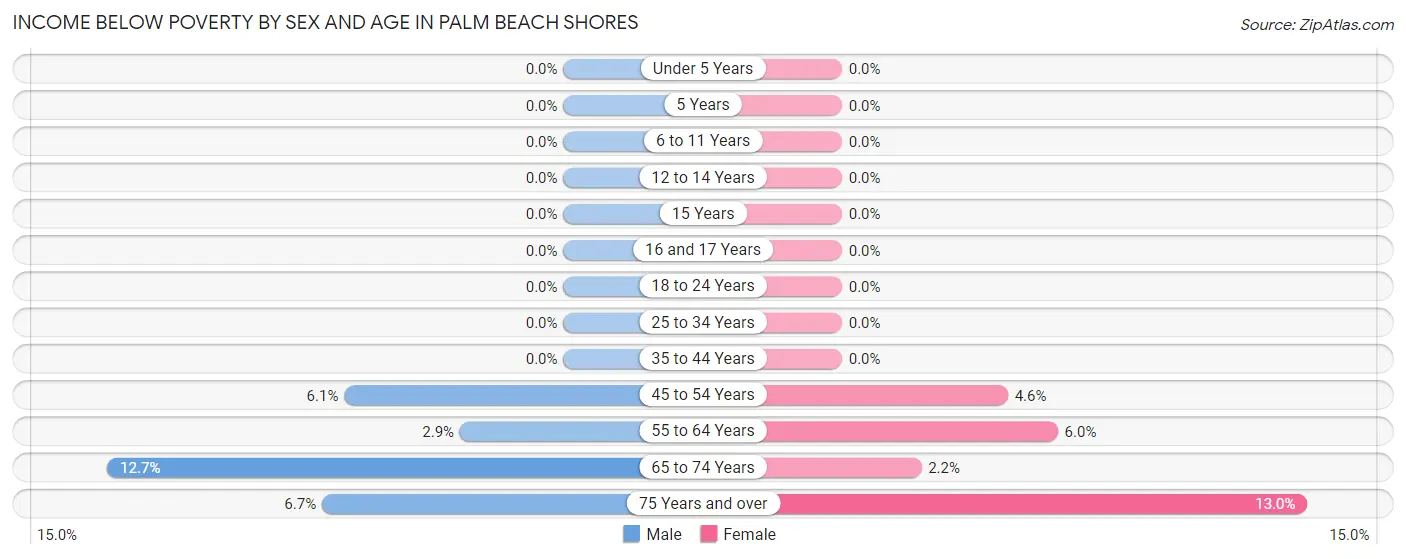
Income Below Poverty by Sex and Age in Palm Beach Shores
With 4.4% poverty level for males and 5.8% for females among the residents of Palm Beach Shores, 65 to 74 year old males and 75 year old and over females are the most vulnerable to poverty, with 8 males (12.7%) and 21 females (13.0%) in their respective age groups living below the poverty level.
| Age Bracket | Male | Female |
| Under 5 Years | 0 (0.0%) | 0 (0.0%) |
| 5 Years | 0 (0.0%) | 0 (0.0%) |
| 6 to 11 Years | 0 (0.0%) | 0 (0.0%) |
| 12 to 14 Years | 0 (0.0%) | 0 (0.0%) |
| 15 Years | 0 (0.0%) | 0 (0.0%) |
| 16 and 17 Years | 0 (0.0%) | 0 (0.0%) |
| 18 to 24 Years | 0 (0.0%) | 0 (0.0%) |
| 25 to 34 Years | 0 (0.0%) | 0 (0.0%) |
| 35 to 44 Years | 0 (0.0%) | 0 (0.0%) |
| 45 to 54 Years | 5 (6.1%) | 3 (4.6%) |
| 55 to 64 Years | 4 (2.9%) | 11 (6.0%) |
| 65 to 74 Years | 8 (12.7%) | 3 (2.2%) |
| 75 Years and over | 8 (6.7%) | 21 (13.0%) |
| Total | 25 (4.4%) | 38 (5.8%) |
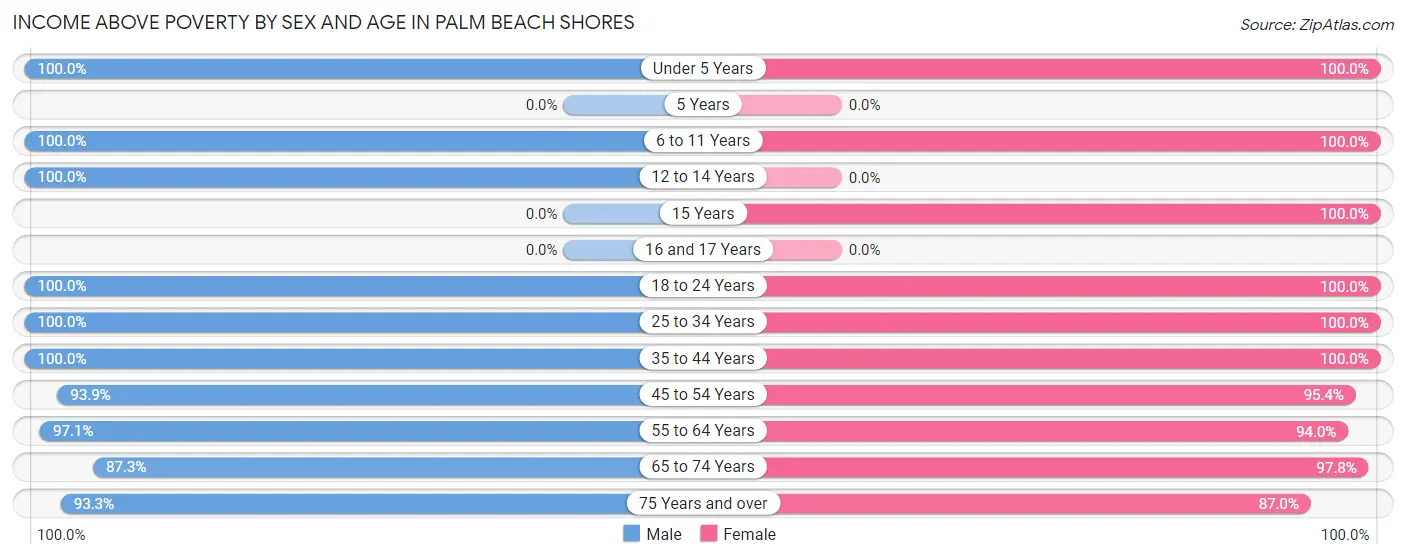
Income Above Poverty by Sex and Age in Palm Beach Shores
According to the poverty statistics in Palm Beach Shores, males aged under 5 years and females aged under 5 years are the age groups that are most secure financially, with 100.0% of males and 100.0% of females in these age groups living above the poverty line.
| Age Bracket | Male | Female |
| Under 5 Years | 8 (100.0%) | 6 (100.0%) |
| 5 Years | 0 (0.0%) | 0 (0.0%) |
| 6 to 11 Years | 18 (100.0%) | 1 (100.0%) |
| 12 to 14 Years | 15 (100.0%) | 0 (0.0%) |
| 15 Years | 0 (0.0%) | 19 (100.0%) |
| 16 and 17 Years | 0 (0.0%) | 0 (0.0%) |
| 18 to 24 Years | 15 (100.0%) | 33 (100.0%) |
| 25 to 34 Years | 54 (100.0%) | 15 (100.0%) |
| 35 to 44 Years | 49 (100.0%) | 35 (100.0%) |
| 45 to 54 Years | 77 (93.9%) | 62 (95.4%) |
| 55 to 64 Years | 135 (97.1%) | 172 (94.0%) |
| 65 to 74 Years | 55 (87.3%) | 133 (97.8%) |
| 75 Years and over | 111 (93.3%) | 141 (87.0%) |
| Total | 537 (95.6%) | 617 (94.2%) |
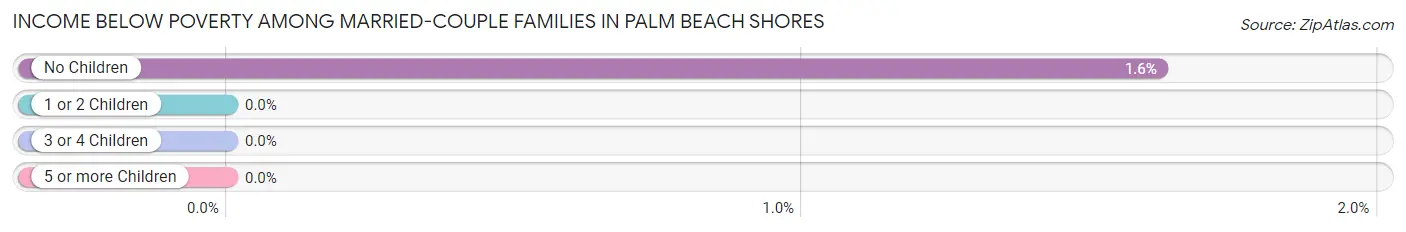
Income Below Poverty Among Married-Couple Families in Palm Beach Shores
The poverty statistics for married-couple families in Palm Beach Shores show that 1.5% or 4 of the total 268 families live below the poverty line. Families with no children have the highest poverty rate of 1.6%, comprising of 4 families. On the other hand, families with 1 or 2 children have the lowest poverty rate of 0.0%, which includes 0 families.
| Children | Above Poverty | Below Poverty |
| No Children | 243 (98.4%) | 4 (1.6%) |
| 1 or 2 Children | 20 (100.0%) | 0 (0.0%) |
| 3 or 4 Children | 1 (100.0%) | 0 (0.0%) |
| 5 or more Children | 0 (0.0%) | 0 (0.0%) |
| Total | 264 (98.5%) | 4 (1.5%) |
Income Below Poverty Among Single-Parent Households in Palm Beach Shores
| Children | Single Father | Single Mother |
| No Children | 0 (0.0%) | 0 (0.0%) |
| 1 or 2 Children | 0 (0.0%) | 0 (0.0%) |
| 3 or 4 Children | 0 (0.0%) | 0 (0.0%) |
| 5 or more Children | 0 (0.0%) | 0 (0.0%) |
| Total | 0 (0.0%) | 0 (0.0%) |
Income Below Poverty Among Married-Couple vs Single-Parent Households in Palm Beach Shores
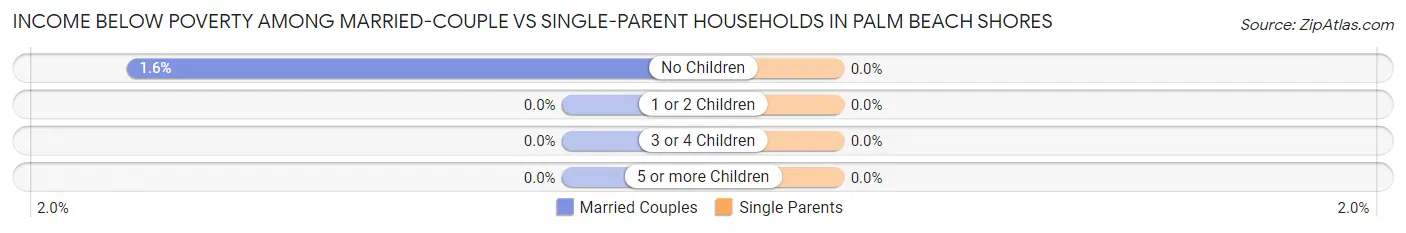
| Children | Married-Couple Families | Single-Parent Households |
| No Children | 4 (1.6%) | 0 (0.0%) |
| 1 or 2 Children | 0 (0.0%) | 0 (0.0%) |
| 3 or 4 Children | 0 (0.0%) | 0 (0.0%) |
| 5 or more Children | 0 (0.0%) | 0 (0.0%) |
| Total | 4 (1.5%) | 0 (0.0%) |
Race in Palm Beach Shores
The most populous races in Palm Beach Shores are White / Caucasian (1,158 | 95.2%), Hispanic or Latino (28 | 2.3%), and Asian (26 | 2.1%).
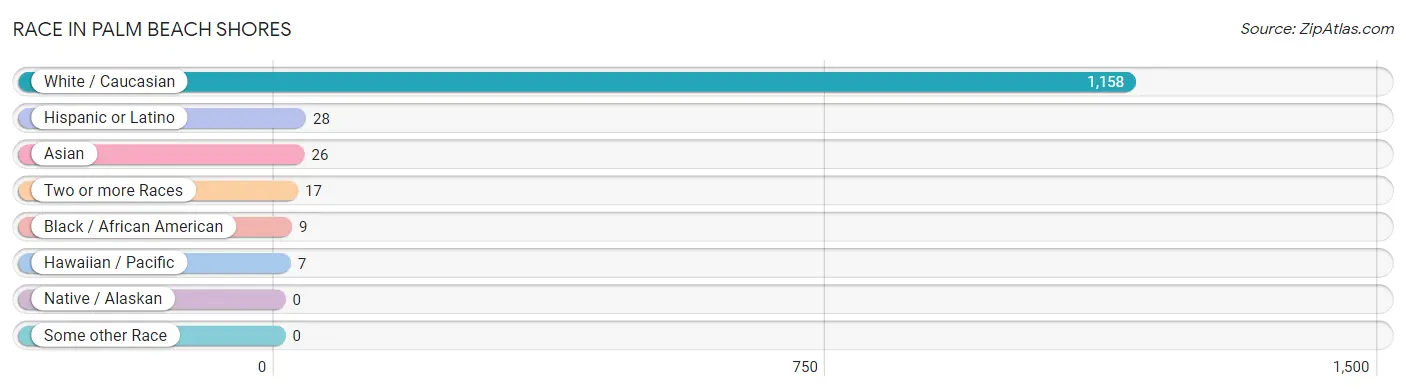
| Race | # Population | % Population |
| Asian | 26 | 2.1% |
| Black / African American | 9 | 0.7% |
| Hawaiian / Pacific | 7 | 0.6% |
| Hispanic or Latino | 28 | 2.3% |
| Native / Alaskan | 0 | 0.0% |
| White / Caucasian | 1,158 | 95.2% |
| Two or more Races | 17 | 1.4% |
| Some other Race | 0 | 0.0% |
| Total | 1,217 | 100.0% |
Ancestry in Palm Beach Shores
The most populous ancestries reported in Palm Beach Shores are Irish (195 | 16.0%), Italian (168 | 13.8%), German (132 | 10.8%), English (106 | 8.7%), and Polish (62 | 5.1%), together accounting for 54.5% of all Palm Beach Shores residents.
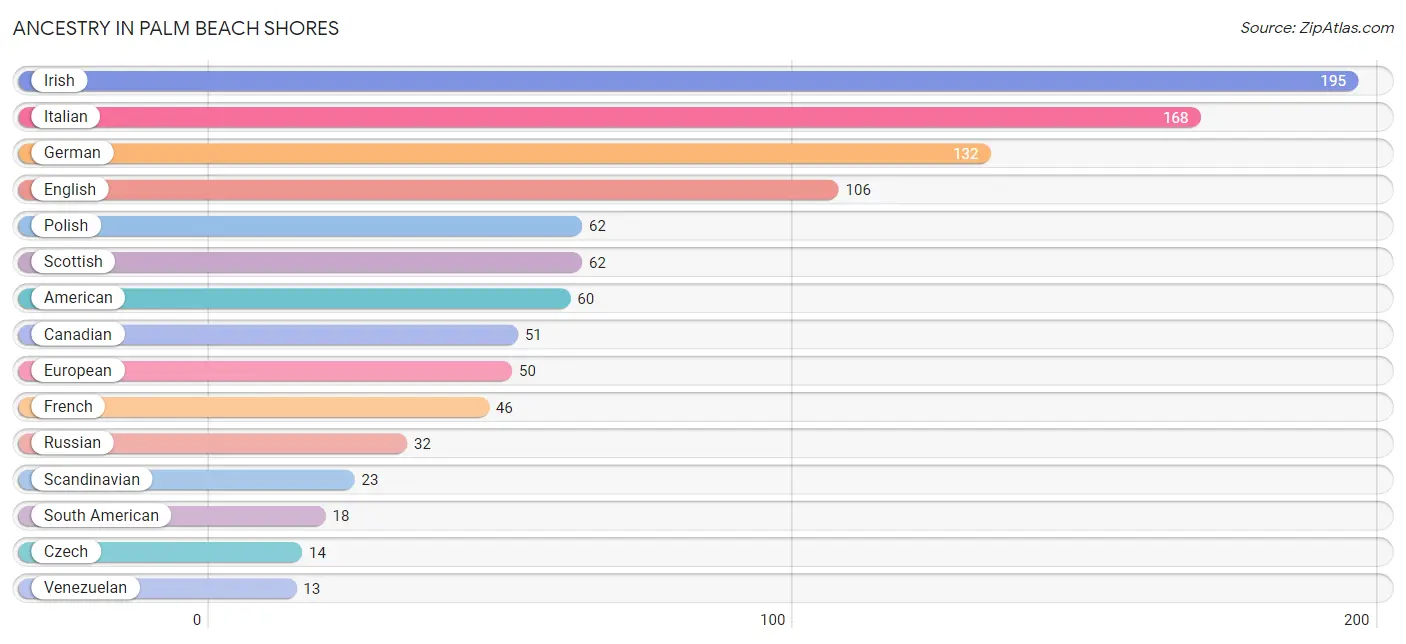
| Ancestry | # Population | % Population |
| American | 60 | 4.9% |
| Arab | 10 | 0.8% |
| Austrian | 7 | 0.6% |
| British | 10 | 0.8% |
| Canadian | 51 | 4.2% |
| Chilean | 5 | 0.4% |
| Choctaw | 3 | 0.3% |
| Cuban | 6 | 0.5% |
| Czech | 14 | 1.1% |
| Czechoslovakian | 7 | 0.6% |
| Danish | 11 | 0.9% |
| Dutch | 11 | 0.9% |
| Eastern European | 10 | 0.8% |
| English | 106 | 8.7% |
| European | 50 | 4.1% |
| French | 46 | 3.8% |
| French Canadian | 4 | 0.3% |
| German | 132 | 10.8% |
| Hungarian | 1 | 0.1% |
| Indian (Asian) | 3 | 0.3% |
| Irish | 195 | 16.0% |
| Israeli | 3 | 0.3% |
| Italian | 168 | 13.8% |
| Korean | 9 | 0.7% |
| Lebanese | 10 | 0.8% |
| Norwegian | 10 | 0.8% |
| Polish | 62 | 5.1% |
| Puerto Rican | 4 | 0.3% |
| Russian | 32 | 2.6% |
| Samoan | 7 | 0.6% |
| Scandinavian | 23 | 1.9% |
| Scotch-Irish | 7 | 0.6% |
| Scottish | 62 | 5.1% |
| South American | 18 | 1.5% |
| Swedish | 8 | 0.7% |
| Ukrainian | 10 | 0.8% |
| Venezuelan | 13 | 1.1% |
| Welsh | 2 | 0.2% |
| Yugoslavian | 7 | 0.6% | View All 39 Rows |
Immigrants in Palm Beach Shores
The most numerous immigrant groups reported in Palm Beach Shores came from Europe (78 | 6.4%), Northern Europe (48 | 3.9%), Canada (34 | 2.8%), Asia (30 | 2.5%), and Eastern Europe (22 | 1.8%), together accounting for 17.4% of all Palm Beach Shores residents.
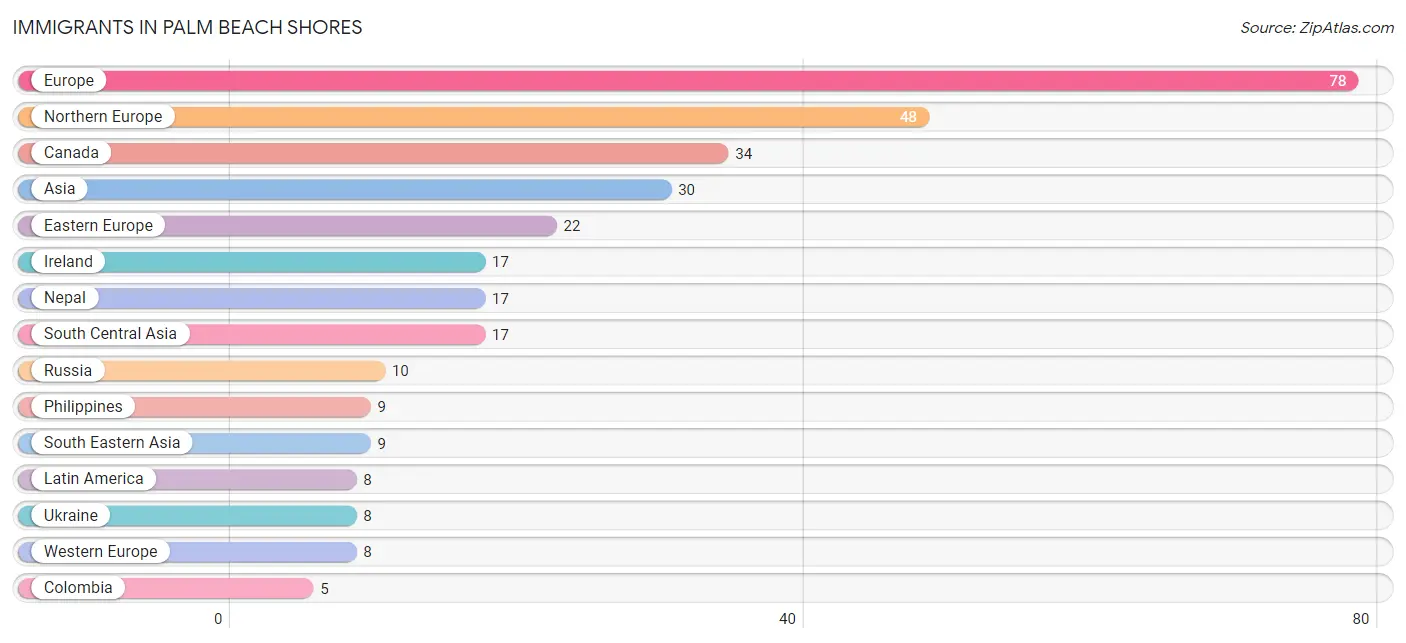
| Immigration Origin | # Population | % Population |
| Asia | 30 | 2.5% |
| Canada | 34 | 2.8% |
| Caribbean | 3 | 0.3% |
| Colombia | 5 | 0.4% |
| Croatia | 4 | 0.3% |
| Cuba | 3 | 0.3% |
| Eastern Europe | 22 | 1.8% |
| Europe | 78 | 6.4% |
| France | 4 | 0.3% |
| Germany | 4 | 0.3% |
| Ireland | 17 | 1.4% |
| Latin America | 8 | 0.7% |
| Lebanon | 4 | 0.3% |
| Nepal | 17 | 1.4% |
| Northern Europe | 48 | 3.9% |
| Philippines | 9 | 0.7% |
| Russia | 10 | 0.8% |
| Scotland | 4 | 0.3% |
| South America | 5 | 0.4% |
| South Central Asia | 17 | 1.4% |
| South Eastern Asia | 9 | 0.7% |
| Ukraine | 8 | 0.7% |
| Western Asia | 4 | 0.3% |
| Western Europe | 8 | 0.7% | View All 24 Rows |
Sex and Age in Palm Beach Shores
Sex and Age in Palm Beach Shores
The most populous age groups in Palm Beach Shores are 55 to 59 Years (80 | 14.2%) for men and 55 to 59 Years (113 | 17.2%) for women.
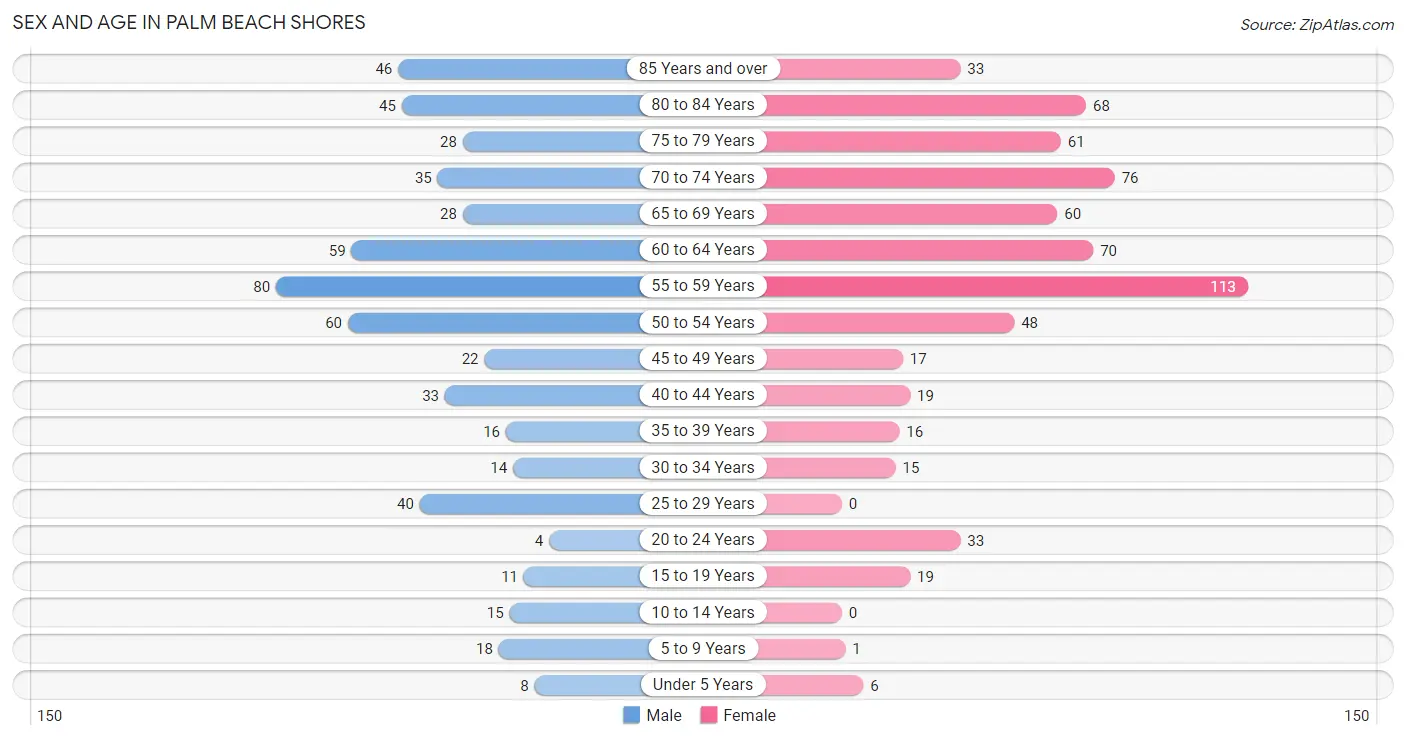
| Age Bracket | Male | Female |
| Under 5 Years | 8 (1.4%) | 6 (0.9%) |
| 5 to 9 Years | 18 (3.2%) | 1 (0.2%) |
| 10 to 14 Years | 15 (2.7%) | 0 (0.0%) |
| 15 to 19 Years | 11 (2.0%) | 19 (2.9%) |
| 20 to 24 Years | 4 (0.7%) | 33 (5.0%) |
| 25 to 29 Years | 40 (7.1%) | 0 (0.0%) |
| 30 to 34 Years | 14 (2.5%) | 15 (2.3%) |
| 35 to 39 Years | 16 (2.9%) | 16 (2.4%) |
| 40 to 44 Years | 33 (5.9%) | 19 (2.9%) |
| 45 to 49 Years | 22 (3.9%) | 17 (2.6%) |
| 50 to 54 Years | 60 (10.7%) | 48 (7.3%) |
| 55 to 59 Years | 80 (14.2%) | 113 (17.2%) |
| 60 to 64 Years | 59 (10.5%) | 70 (10.7%) |
| 65 to 69 Years | 28 (5.0%) | 60 (9.2%) |
| 70 to 74 Years | 35 (6.2%) | 76 (11.6%) |
| 75 to 79 Years | 28 (5.0%) | 61 (9.3%) |
| 80 to 84 Years | 45 (8.0%) | 68 (10.4%) |
| 85 Years and over | 46 (8.2%) | 33 (5.0%) |
| Total | 562 (100.0%) | 655 (100.0%) |
Families and Households in Palm Beach Shores
Median Family Size in Palm Beach Shores
The median family size in Palm Beach Shores is 2.25 persons per family, with single male/father families (5 | 1.5%) accounting for the largest median family size of 2.4 persons per family. On the other hand, single female/mother families (68 | 19.9%) represent the smallest median family size with 2.07 persons per family.
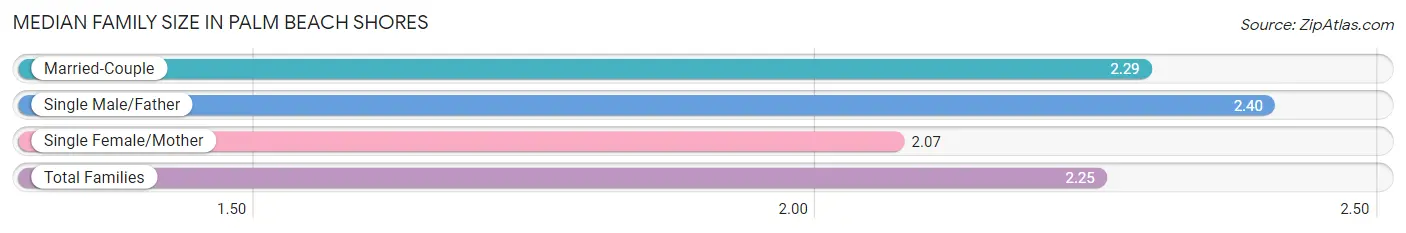
| Family Type | # Families | Family Size |
| Married-Couple | 268 (78.6%) | 2.29 |
| Single Male/Father | 5 (1.5%) | 2.40 |
| Single Female/Mother | 68 (19.9%) | 2.07 |
| Total Families | 341 (100.0%) | 2.25 |
Median Household Size in Palm Beach Shores
The median household size in Palm Beach Shores is 1.64 persons per household, with single male/father households (5 | 0.7%) accounting for the largest median household size of 2.4 persons per household. non-family households (386 | 53.1%) represent the smallest median household size with 1.09 persons per household.
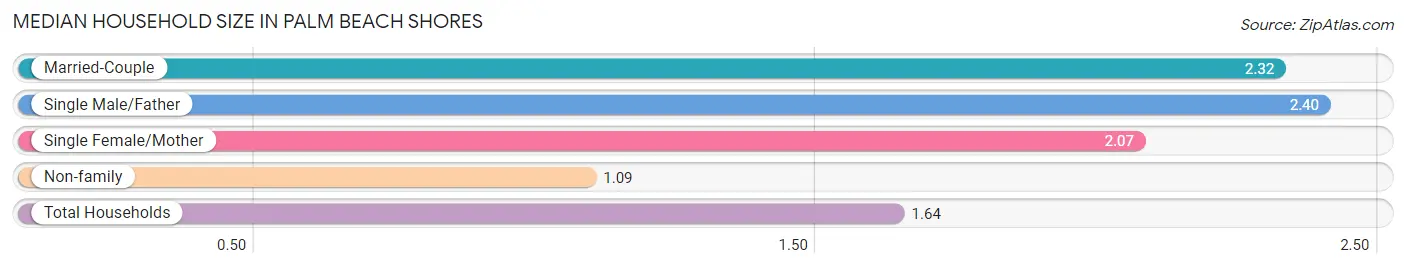
| Household Type | # Households | Household Size |
| Married-Couple | 268 (36.9%) | 2.32 |
| Single Male/Father | 5 (0.7%) | 2.40 |
| Single Female/Mother | 68 (9.3%) | 2.07 |
| Non-family | 386 (53.1%) | 1.09 |
| Total Households | 727 (100.0%) | 1.64 |
Household Size by Marriage Status in Palm Beach Shores
Out of a total of 727 households in Palm Beach Shores, 341 (46.9%) are family households, while 386 (53.1%) are nonfamily households. The most numerous type of family households are 2-person households, comprising 282, and the most common type of nonfamily households are 1-person households, comprising 352.
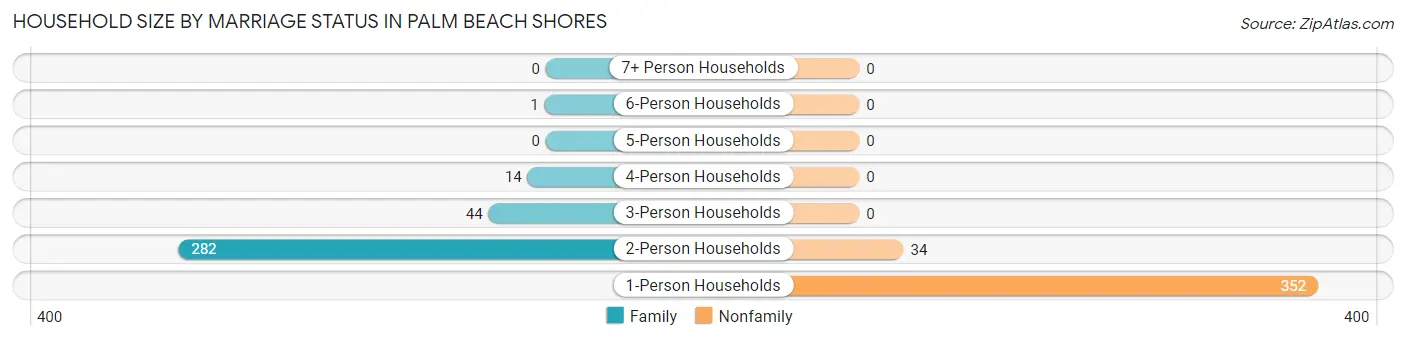
| Household Size | Family Households | Nonfamily Households |
| 1-Person Households | - | 352 (48.4%) |
| 2-Person Households | 282 (38.8%) | 34 (4.7%) |
| 3-Person Households | 44 (6.0%) | 0 (0.0%) |
| 4-Person Households | 14 (1.9%) | 0 (0.0%) |
| 5-Person Households | 0 (0.0%) | 0 (0.0%) |
| 6-Person Households | 1 (0.1%) | 0 (0.0%) |
| 7+ Person Households | 0 (0.0%) | 0 (0.0%) |
| Total | 341 (46.9%) | 386 (53.1%) |
Female Fertility in Palm Beach Shores
Fertility by Age in Palm Beach Shores
Average fertility rate in Palm Beach Shores is 8.0 births per 1,000 women. Women in the age bracket of 35 to 50 years have the highest fertility rate with 19.0 births per 1,000 women. Women in the age bracket of 35 to 50 years acount for 100.0% of all women with births.
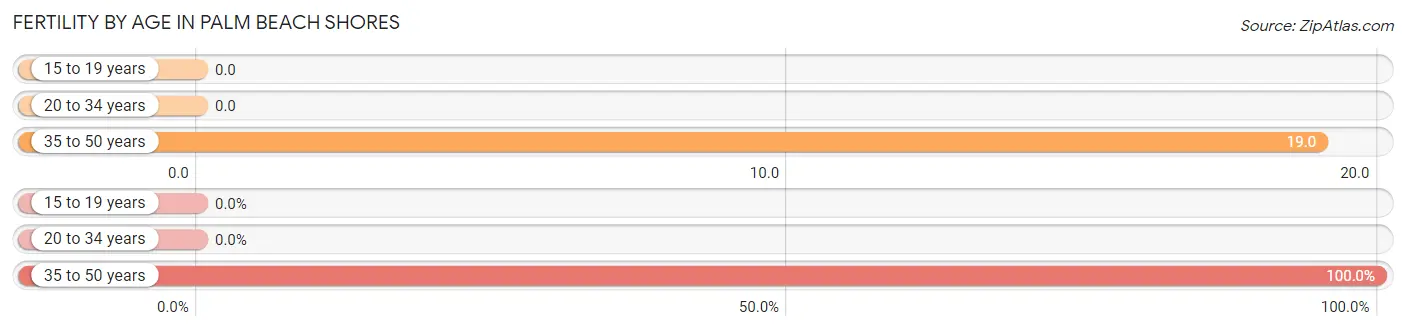
| Age Bracket | Women with Births | Births / 1,000 Women |
| 15 to 19 years | 0 (0.0%) | 0.0 |
| 20 to 34 years | 0 (0.0%) | 0.0 |
| 35 to 50 years | 1 (100.0%) | 19.0 |
| Total | 1 (100.0%) | 8.0 |
Fertility by Age by Marriage Status in Palm Beach Shores
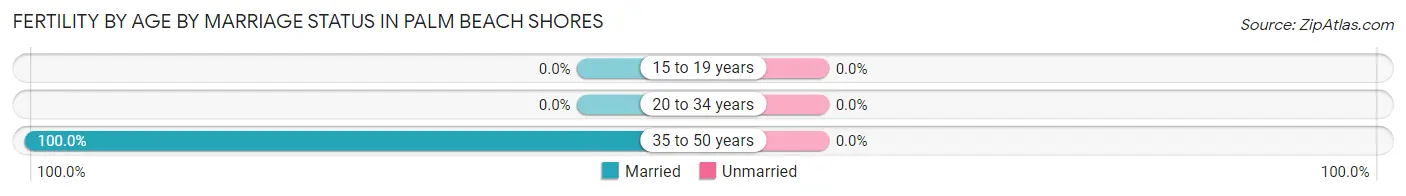
| Age Bracket | Married | Unmarried |
| 15 to 19 years | 0 (0.0%) | 0 (0.0%) |
| 20 to 34 years | 0 (0.0%) | 0 (0.0%) |
| 35 to 50 years | 1 (100.0%) | 0 (0.0%) |
| Total | 1 (100.0%) | 0 (0.0%) |
Fertility by Education in Palm Beach Shores
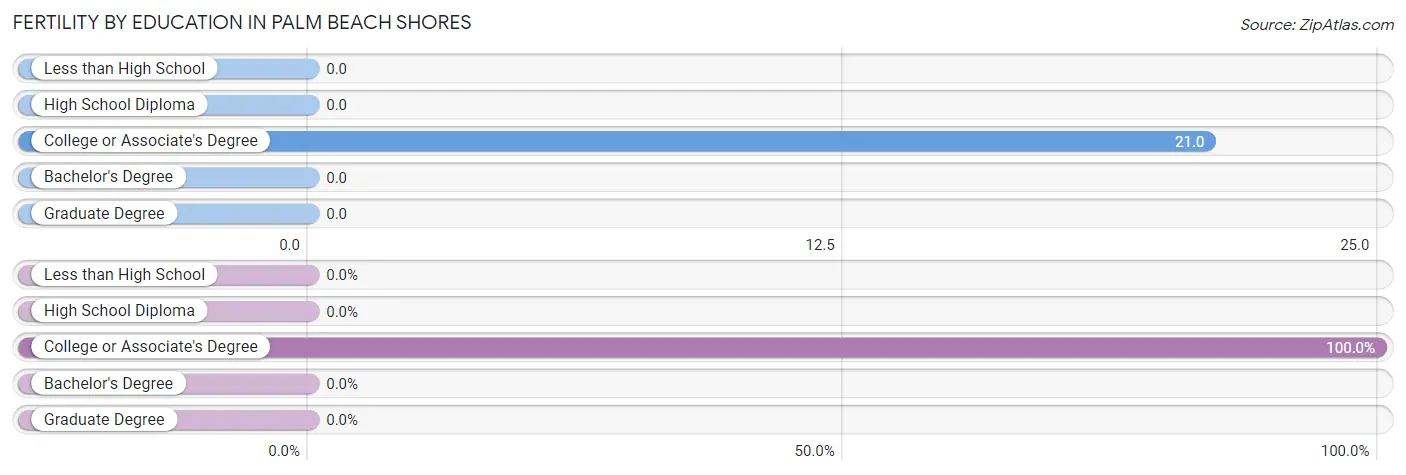
| Educational Attainment | Women with Births | Births / 1,000 Women |
| Less than High School | 0 (0.0%) | 0.0 |
| High School Diploma | 0 (0.0%) | 0.0 |
| College or Associate's Degree | 1 (100.0%) | 21.0 |
| Bachelor's Degree | 0 (0.0%) | 0.0 |
| Graduate Degree | 0 (0.0%) | 0.0 |
| Total | 1 (100.0%) | 8.0 |
Fertility by Education by Marriage Status in Palm Beach Shores
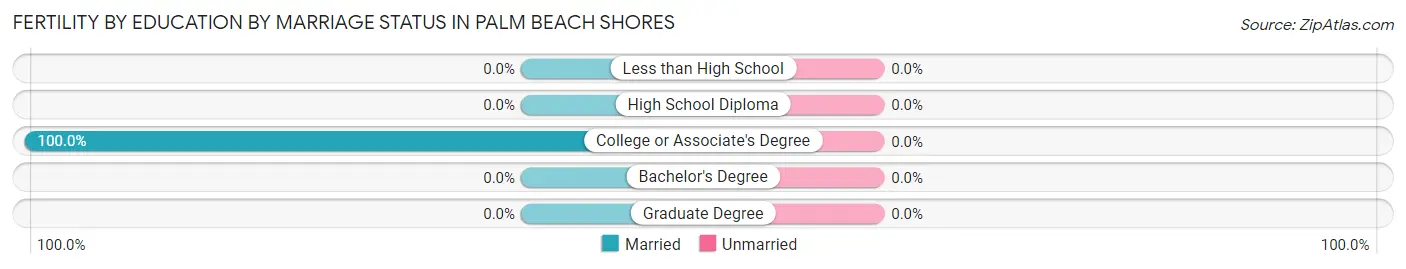
| Educational Attainment | Married | Unmarried |
| Less than High School | 0 (0.0%) | 0 (0.0%) |
| High School Diploma | 0 (0.0%) | 0 (0.0%) |
| College or Associate's Degree | 1 (100.0%) | 0 (0.0%) |
| Bachelor's Degree | 0 (0.0%) | 0 (0.0%) |
| Graduate Degree | 0 (0.0%) | 0 (0.0%) |
| Total | 1 (100.0%) | 0 (0.0%) |
Employment Characteristics in Palm Beach Shores
Employment by Class of Employer in Palm Beach Shores
Among the 485 employed individuals in Palm Beach Shores, private company employees (331 | 68.2%), self-employed (incorporated) (63 | 13.0%), and self-employed (not incorporated) (45 | 9.3%) make up the most common classes of employment.
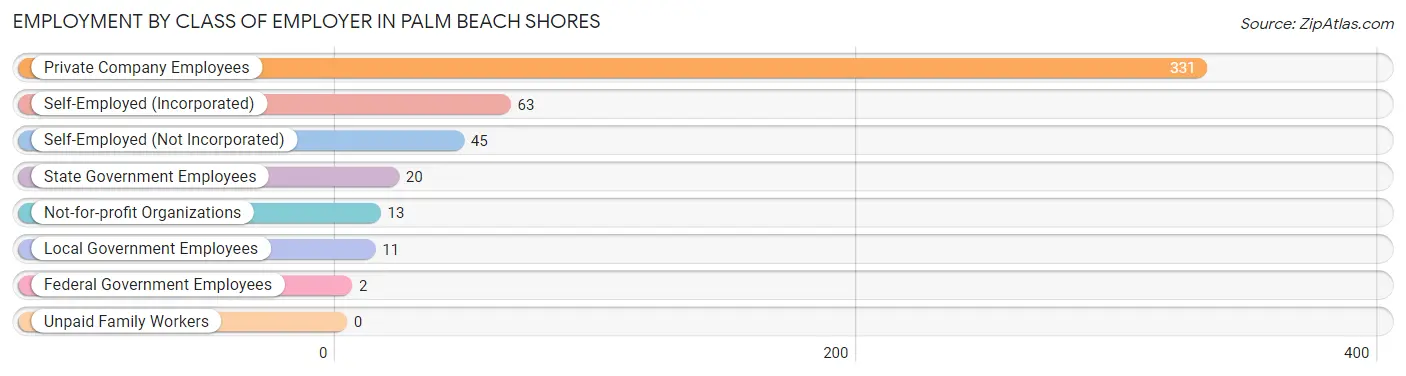
| Employer Class | # Employees | % Employees |
| Private Company Employees | 331 | 68.2% |
| Self-Employed (Incorporated) | 63 | 13.0% |
| Self-Employed (Not Incorporated) | 45 | 9.3% |
| Not-for-profit Organizations | 13 | 2.7% |
| Local Government Employees | 11 | 2.3% |
| State Government Employees | 20 | 4.1% |
| Federal Government Employees | 2 | 0.4% |
| Unpaid Family Workers | 0 | 0.0% |
| Total | 485 | 100.0% |
Employment Status by Age in Palm Beach Shores
According to the labor force statistics for Palm Beach Shores, out of the total population over 16 years of age (1,150), 47.0% or 540 individuals are in the labor force, with 8.9% or 48 of them unemployed. The age group with the highest labor force participation rate is 30 to 34 years, with 100.0% or 29 individuals in the labor force. Within the labor force, the 30 to 34 years age range has the highest percentage of unemployed individuals, with 34.5% or 10 of them being unemployed.
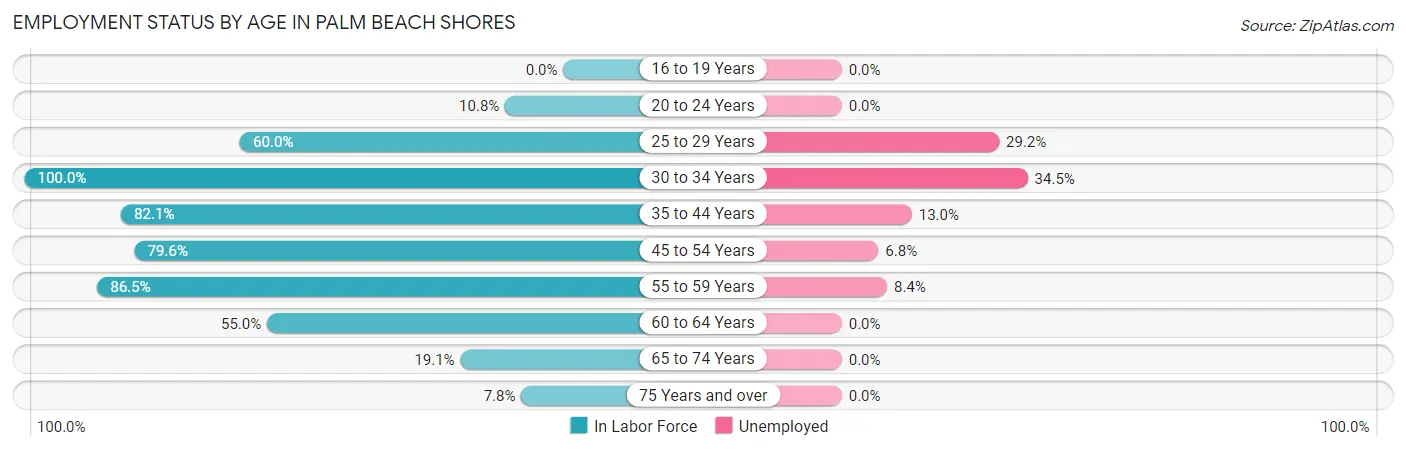
| Age Bracket | In Labor Force | Unemployed |
| 16 to 19 Years | 0 (0.0%) | 0 (0.0%) |
| 20 to 24 Years | 4 (10.8%) | 0 (0.0%) |
| 25 to 29 Years | 24 (60.0%) | 7 (29.2%) |
| 30 to 34 Years | 29 (100.0%) | 10 (34.5%) |
| 35 to 44 Years | 69 (82.1%) | 9 (13.0%) |
| 45 to 54 Years | 117 (79.6%) | 8 (6.8%) |
| 55 to 59 Years | 167 (86.5%) | 14 (8.4%) |
| 60 to 64 Years | 71 (55.0%) | 0 (0.0%) |
| 65 to 74 Years | 38 (19.1%) | 0 (0.0%) |
| 75 Years and over | 22 (7.8%) | 0 (0.0%) |
| Total | 540 (47.0%) | 48 (8.9%) |
Employment Status by Educational Attainment in Palm Beach Shores
According to labor force statistics for Palm Beach Shores, 76.7% of individuals (477) out of the total population between 25 and 64 years of age (622) are in the labor force, with 10.1% or 48 of them being unemployed. The group with the highest labor force participation rate are those with the educational attainment of less than high school, with 90.0% or 45 individuals in the labor force. Within the labor force, individuals with high school diploma education have the highest percentage of unemployment, with 31.4% or 16 of them being unemployed.
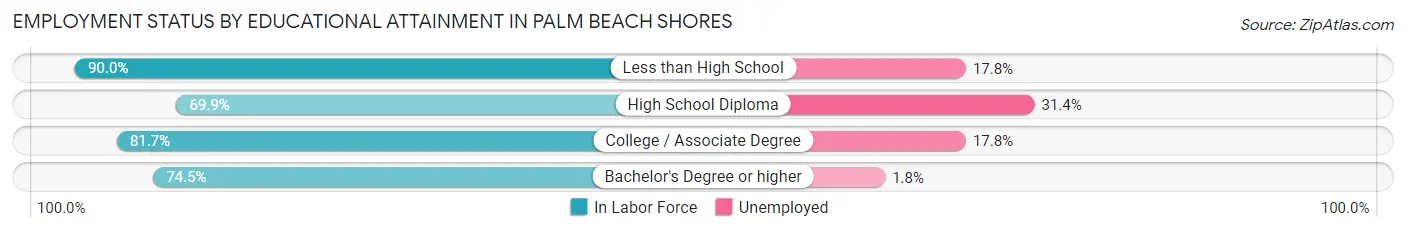
| Educational Attainment | In Labor Force | Unemployed |
| Less than High School | 45 (90.0%) | 9 (17.8%) |
| High School Diploma | 51 (69.9%) | 23 (31.4%) |
| College / Associate Degree | 107 (81.7%) | 23 (17.8%) |
| Bachelor's Degree or higher | 274 (74.5%) | 7 (1.8%) |
| Total | 477 (76.7%) | 63 (10.1%) |
Employment Occupations by Sex in Palm Beach Shores
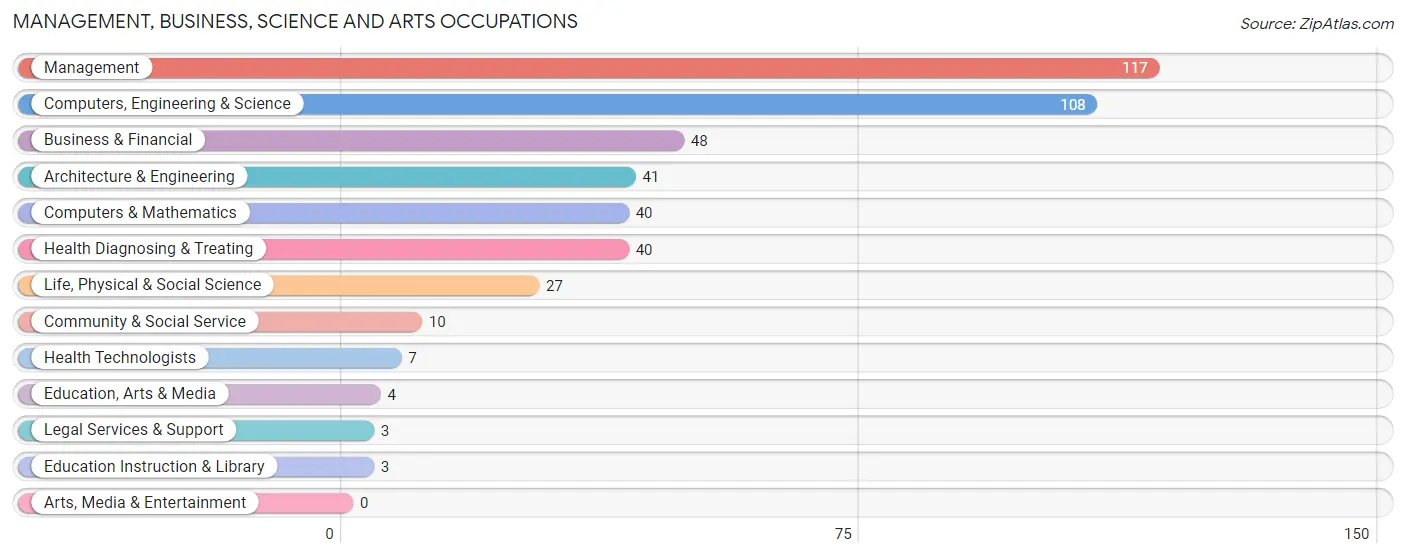
Management, Business, Science and Arts Occupations
The most common Management, Business, Science and Arts occupations in Palm Beach Shores are Management (117 | 23.7%), Computers, Engineering & Science (108 | 21.9%), Business & Financial (48 | 9.7%), Architecture & Engineering (41 | 8.3%), and Computers & Mathematics (40 | 8.1%).
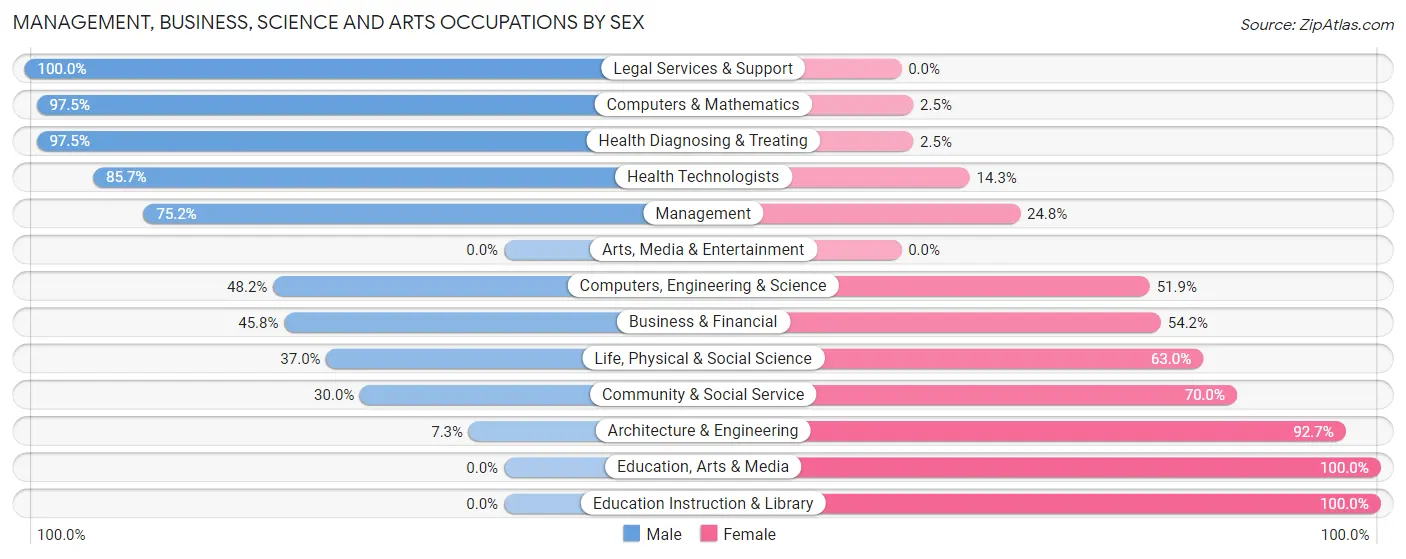
Management, Business, Science and Arts Occupations by Sex
Within the Management, Business, Science and Arts occupations in Palm Beach Shores, the most male-oriented occupations are Legal Services & Support (100.0%), Computers & Mathematics (97.5%), and Health Diagnosing & Treating (97.5%), while the most female-oriented occupations are Education, Arts & Media (100.0%), Education Instruction & Library (100.0%), and Architecture & Engineering (92.7%).
| Occupation | Male | Female |
| Management | 88 (75.2%) | 29 (24.8%) |
| Business & Financial | 22 (45.8%) | 26 (54.2%) |
| Computers, Engineering & Science | 52 (48.1%) | 56 (51.8%) |
| Computers & Mathematics | 39 (97.5%) | 1 (2.5%) |
| Architecture & Engineering | 3 (7.3%) | 38 (92.7%) |
| Life, Physical & Social Science | 10 (37.0%) | 17 (63.0%) |
| Community & Social Service | 3 (30.0%) | 7 (70.0%) |
| Education, Arts & Media | 0 (0.0%) | 4 (100.0%) |
| Legal Services & Support | 3 (100.0%) | 0 (0.0%) |
| Education Instruction & Library | 0 (0.0%) | 3 (100.0%) |
| Arts, Media & Entertainment | 0 (0.0%) | 0 (0.0%) |
| Health Diagnosing & Treating | 39 (97.5%) | 1 (2.5%) |
| Health Technologists | 6 (85.7%) | 1 (14.3%) |
| Total (Category) | 204 (63.2%) | 119 (36.8%) |
| Total (Overall) | 262 (53.1%) | 231 (46.9%) |
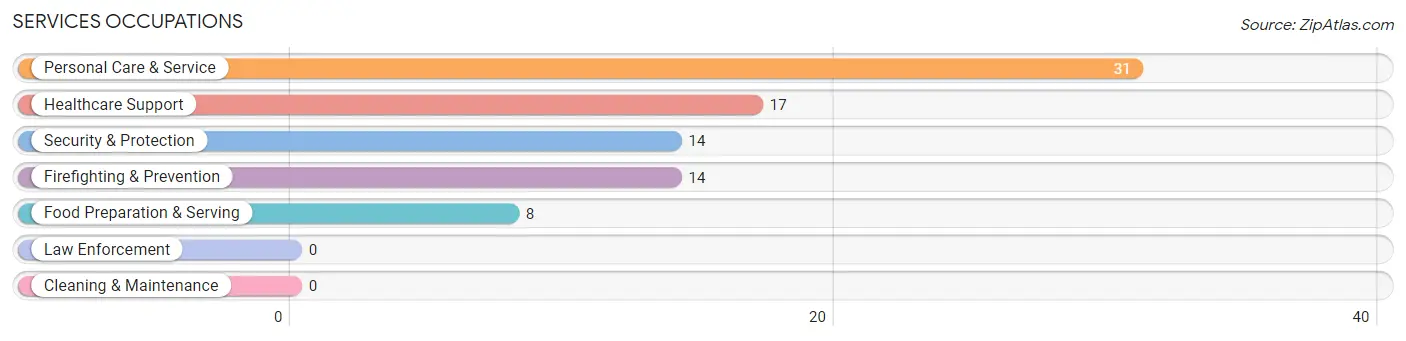
Services Occupations
The most common Services occupations in Palm Beach Shores are Personal Care & Service (31 | 6.3%), Healthcare Support (17 | 3.5%), Security & Protection (14 | 2.8%), Firefighting & Prevention (14 | 2.8%), and Food Preparation & Serving (8 | 1.6%).
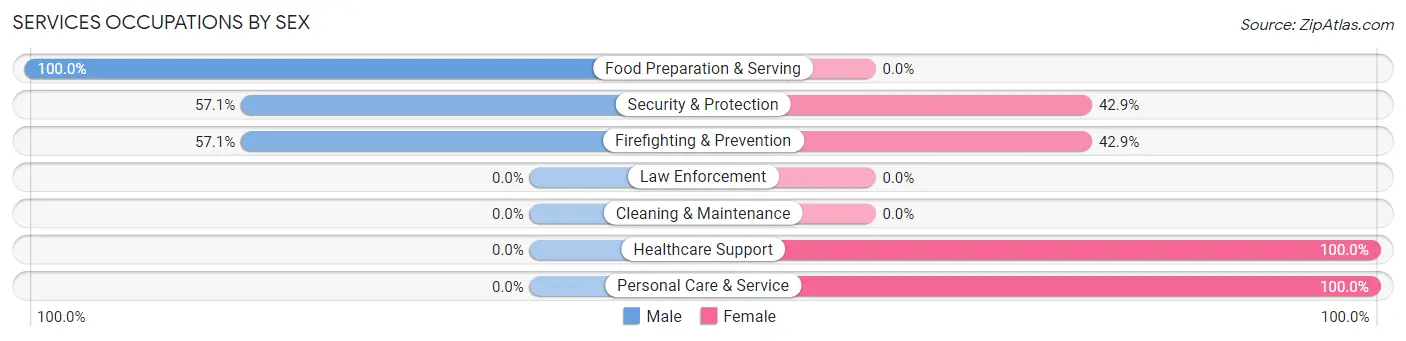
Services Occupations by Sex
Within the Services occupations in Palm Beach Shores, the most male-oriented occupations are Food Preparation & Serving (100.0%), Security & Protection (57.1%), and Firefighting & Prevention (57.1%), while the most female-oriented occupations are Healthcare Support (100.0%), Personal Care & Service (100.0%), and Security & Protection (42.9%).
| Occupation | Male | Female |
| Healthcare Support | 0 (0.0%) | 17 (100.0%) |
| Security & Protection | 8 (57.1%) | 6 (42.9%) |
| Firefighting & Prevention | 8 (57.1%) | 6 (42.9%) |
| Law Enforcement | 0 (0.0%) | 0 (0.0%) |
| Food Preparation & Serving | 8 (100.0%) | 0 (0.0%) |
| Cleaning & Maintenance | 0 (0.0%) | 0 (0.0%) |
| Personal Care & Service | 0 (0.0%) | 31 (100.0%) |
| Total (Category) | 16 (22.9%) | 54 (77.1%) |
| Total (Overall) | 262 (53.1%) | 231 (46.9%) |
Sales and Office Occupations
The most common Sales and Office occupations in Palm Beach Shores are Sales & Related (35 | 7.1%), and Office & Administration (35 | 7.1%).
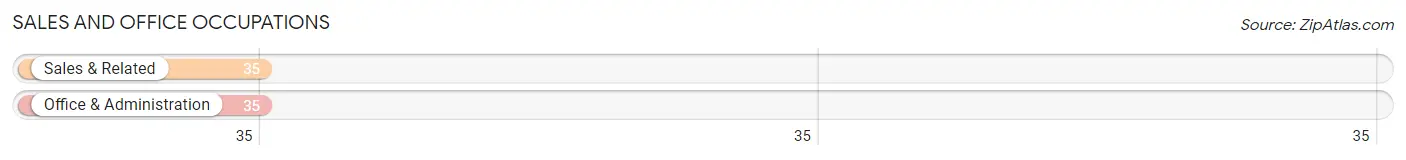
Sales and Office Occupations by Sex
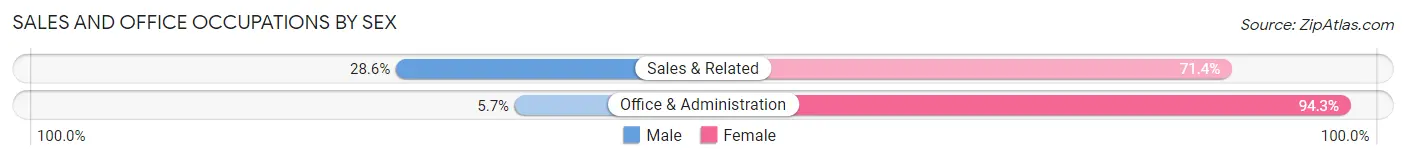
| Occupation | Male | Female |
| Sales & Related | 10 (28.6%) | 25 (71.4%) |
| Office & Administration | 2 (5.7%) | 33 (94.3%) |
| Total (Category) | 12 (17.1%) | 58 (82.9%) |
| Total (Overall) | 262 (53.1%) | 231 (46.9%) |
Natural Resources, Construction and Maintenance Occupations
The most common Natural Resources, Construction and Maintenance occupations in Palm Beach Shores are , and Construction & Extraction (6 | 1.2%).
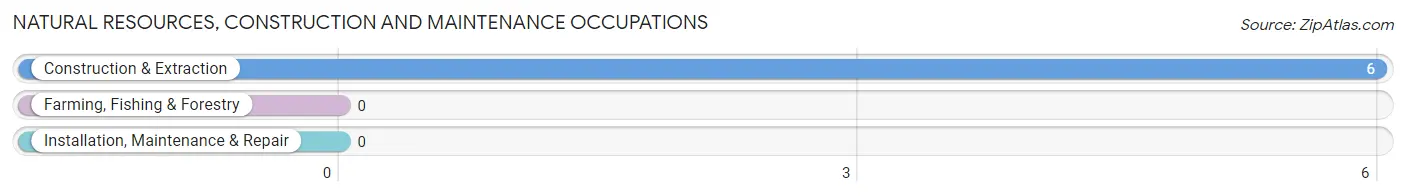
Natural Resources, Construction and Maintenance Occupations by Sex
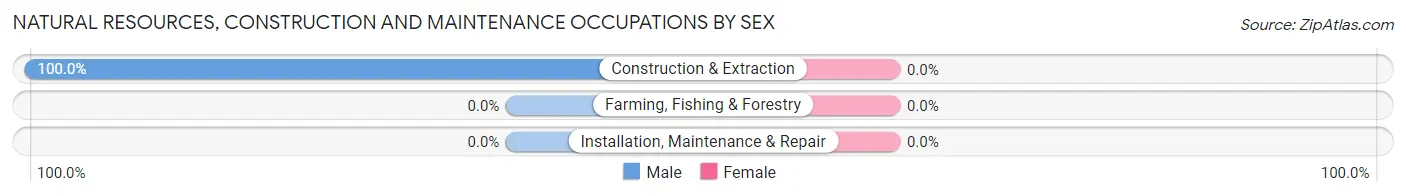
| Occupation | Male | Female |
| Farming, Fishing & Forestry | 0 (0.0%) | 0 (0.0%) |
| Construction & Extraction | 6 (100.0%) | 0 (0.0%) |
| Installation, Maintenance & Repair | 0 (0.0%) | 0 (0.0%) |
| Total (Category) | 6 (100.0%) | 0 (0.0%) |
| Total (Overall) | 262 (53.1%) | 231 (46.9%) |
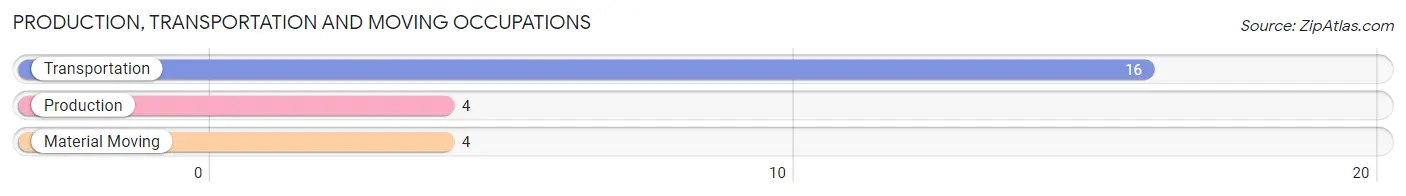
Production, Transportation and Moving Occupations
The most common Production, Transportation and Moving occupations in Palm Beach Shores are Transportation (16 | 3.3%), Production (4 | 0.8%), and Material Moving (4 | 0.8%).
Production, Transportation and Moving Occupations by Sex
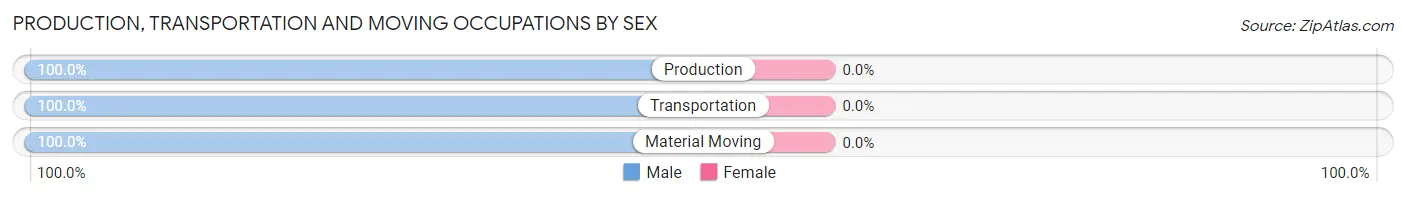
| Occupation | Male | Female |
| Production | 4 (100.0%) | 0 (0.0%) |
| Transportation | 16 (100.0%) | 0 (0.0%) |
| Material Moving | 4 (100.0%) | 0 (0.0%) |
| Total (Category) | 24 (100.0%) | 0 (0.0%) |
| Total (Overall) | 262 (53.1%) | 231 (46.9%) |
Employment Industries by Sex in Palm Beach Shores
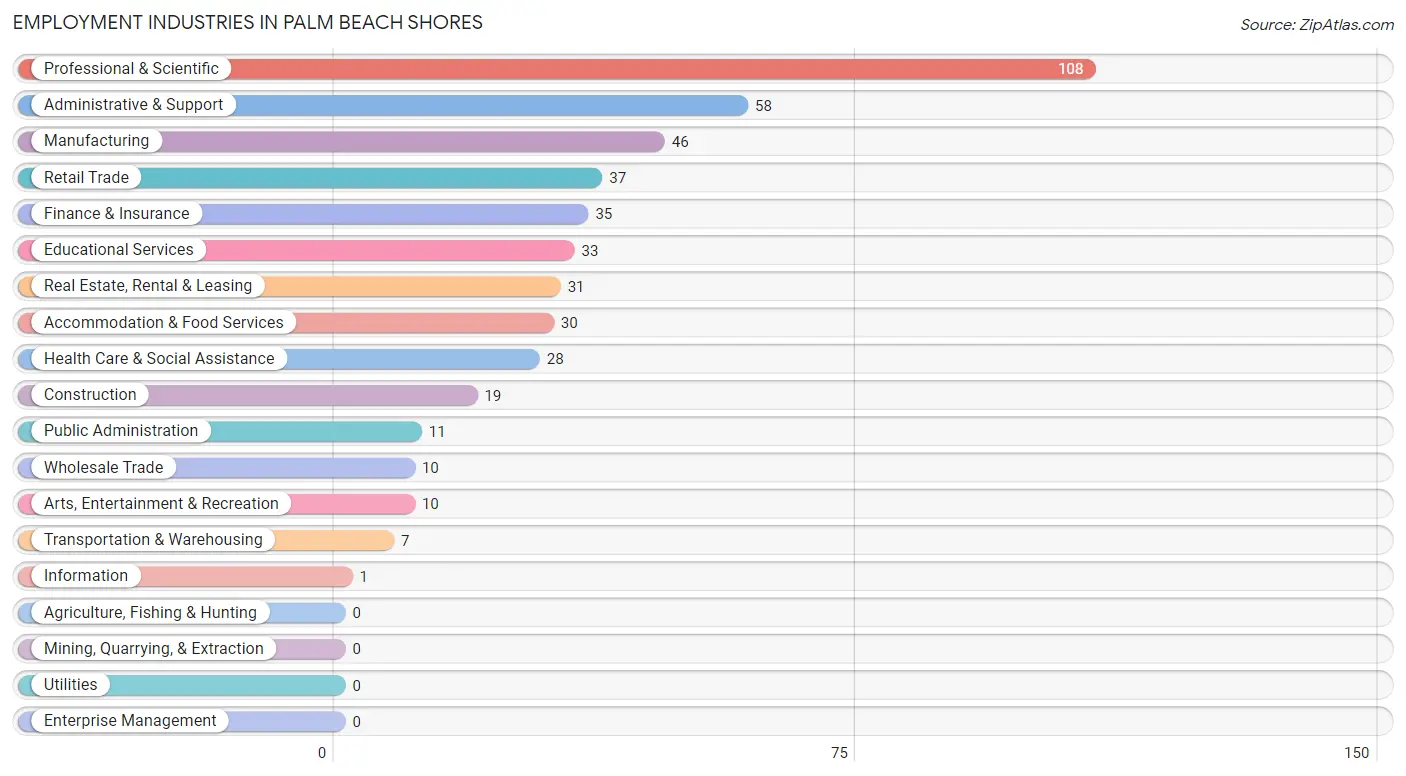
Employment Industries in Palm Beach Shores
The major employment industries in Palm Beach Shores include Professional & Scientific (108 | 21.9%), Administrative & Support (58 | 11.8%), Manufacturing (46 | 9.3%), Retail Trade (37 | 7.5%), and Finance & Insurance (35 | 7.1%).
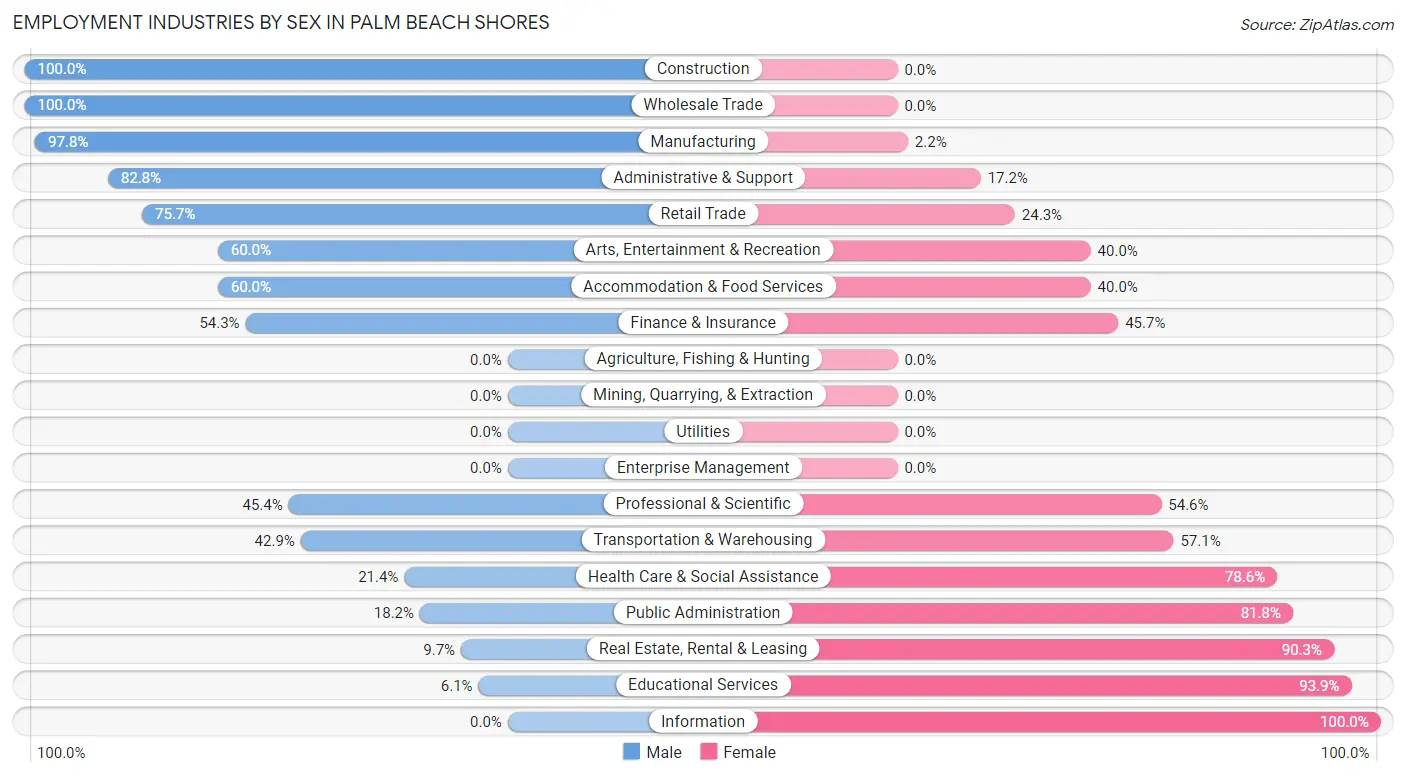
Employment Industries by Sex in Palm Beach Shores
The Palm Beach Shores industries that see more men than women are Construction (100.0%), Wholesale Trade (100.0%), and Manufacturing (97.8%), whereas the industries that tend to have a higher number of women are Information (100.0%), Educational Services (93.9%), and Real Estate, Rental & Leasing (90.3%).
| Industry | Male | Female |
| Agriculture, Fishing & Hunting | 0 (0.0%) | 0 (0.0%) |
| Mining, Quarrying, & Extraction | 0 (0.0%) | 0 (0.0%) |
| Construction | 19 (100.0%) | 0 (0.0%) |
| Manufacturing | 45 (97.8%) | 1 (2.2%) |
| Wholesale Trade | 10 (100.0%) | 0 (0.0%) |
| Retail Trade | 28 (75.7%) | 9 (24.3%) |
| Transportation & Warehousing | 3 (42.9%) | 4 (57.1%) |
| Utilities | 0 (0.0%) | 0 (0.0%) |
| Information | 0 (0.0%) | 1 (100.0%) |
| Finance & Insurance | 19 (54.3%) | 16 (45.7%) |
| Real Estate, Rental & Leasing | 3 (9.7%) | 28 (90.3%) |
| Professional & Scientific | 49 (45.4%) | 59 (54.6%) |
| Enterprise Management | 0 (0.0%) | 0 (0.0%) |
| Administrative & Support | 48 (82.8%) | 10 (17.2%) |
| Educational Services | 2 (6.1%) | 31 (93.9%) |
| Health Care & Social Assistance | 6 (21.4%) | 22 (78.6%) |
| Arts, Entertainment & Recreation | 6 (60.0%) | 4 (40.0%) |
| Accommodation & Food Services | 18 (60.0%) | 12 (40.0%) |
| Public Administration | 2 (18.2%) | 9 (81.8%) |
| Total | 262 (53.1%) | 231 (46.9%) |
Education in Palm Beach Shores
School Enrollment in Palm Beach Shores
The most common levels of schooling among the 95 students in Palm Beach Shores are college / undergraduate (24 | 25.3%), high school (19 | 20.0%), and elementary school (15 | 15.8%).
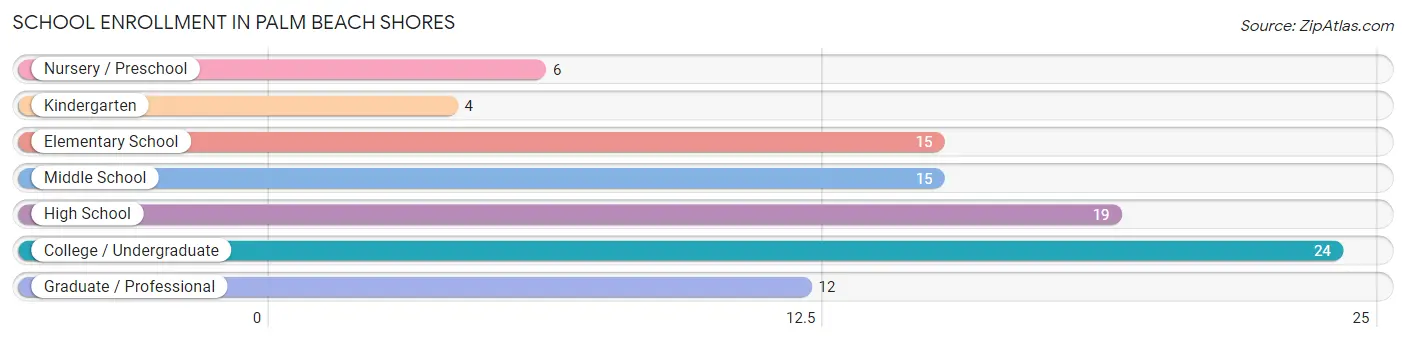
| School Level | # Students | % Students |
| Nursery / Preschool | 6 | 6.3% |
| Kindergarten | 4 | 4.2% |
| Elementary School | 15 | 15.8% |
| Middle School | 15 | 15.8% |
| High School | 19 | 20.0% |
| College / Undergraduate | 24 | 25.3% |
| Graduate / Professional | 12 | 12.6% |
| Total | 95 | 100.0% |
School Enrollment by Age by Funding Source in Palm Beach Shores
Out of a total of 95 students who are enrolled in schools in Palm Beach Shores, 46 (48.4%) attend a private institution, while the remaining 49 (51.6%) are enrolled in public schools. The age group of 3 to 4 year olds has the highest likelihood of being enrolled in private schools, with 6 (100.0% in the age bracket) enrolled. Conversely, the age group of 15 to 17 year olds has the lowest likelihood of being enrolled in a private school, with 19 (100.0% in the age bracket) attending a public institution.
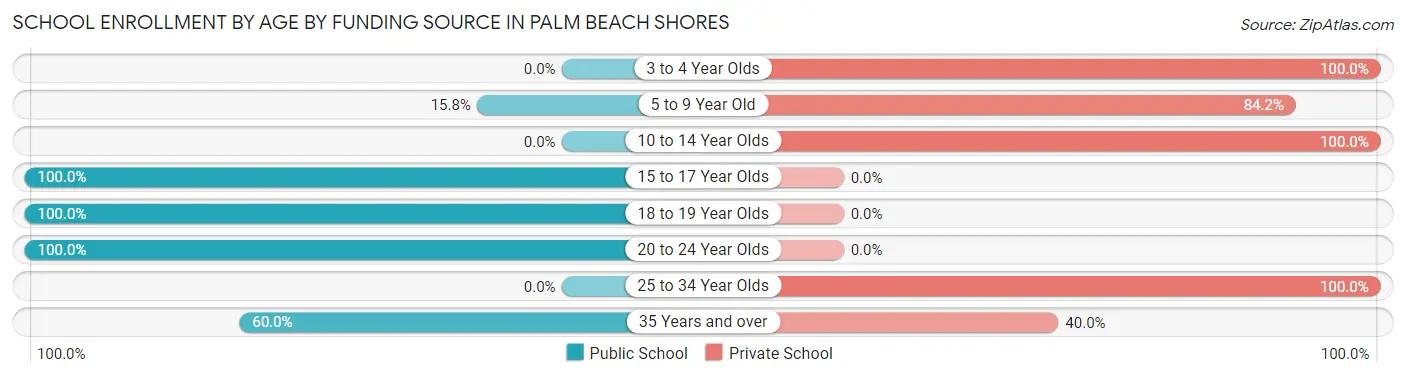
| Age Bracket | Public School | Private School |
| 3 to 4 Year Olds | 0 (0.0%) | 6 (100.0%) |
| 5 to 9 Year Old | 3 (15.8%) | 16 (84.2%) |
| 10 to 14 Year Olds | 0 (0.0%) | 15 (100.0%) |
| 15 to 17 Year Olds | 19 (100.0%) | 0 (0.0%) |
| 18 to 19 Year Olds | 11 (100.0%) | 0 (0.0%) |
| 20 to 24 Year Olds | 10 (100.0%) | 0 (0.0%) |
| 25 to 34 Year Olds | 0 (0.0%) | 5 (100.0%) |
| 35 Years and over | 6 (60.0%) | 4 (40.0%) |
| Total | 49 (51.6%) | 46 (48.4%) |
Educational Attainment by Field of Study in Palm Beach Shores
Business (155 | 25.1%), education (128 | 20.7%), social sciences (55 | 8.9%), engineering (47 | 7.6%), and bio, nature & agricultural (43 | 7.0%) are the most common fields of study among 617 individuals in Palm Beach Shores who have obtained a bachelor's degree or higher.
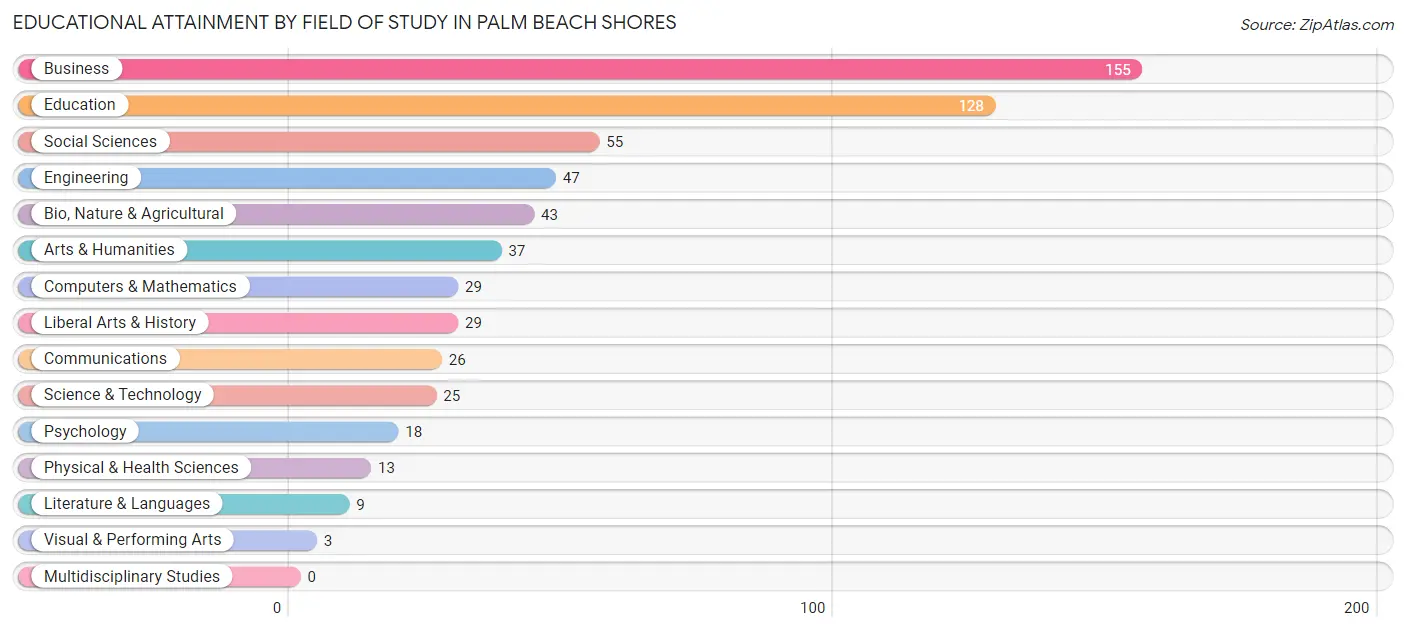
| Field of Study | # Graduates | % Graduates |
| Computers & Mathematics | 29 | 4.7% |
| Bio, Nature & Agricultural | 43 | 7.0% |
| Physical & Health Sciences | 13 | 2.1% |
| Psychology | 18 | 2.9% |
| Social Sciences | 55 | 8.9% |
| Engineering | 47 | 7.6% |
| Multidisciplinary Studies | 0 | 0.0% |
| Science & Technology | 25 | 4.1% |
| Business | 155 | 25.1% |
| Education | 128 | 20.7% |
| Literature & Languages | 9 | 1.5% |
| Liberal Arts & History | 29 | 4.7% |
| Visual & Performing Arts | 3 | 0.5% |
| Communications | 26 | 4.2% |
| Arts & Humanities | 37 | 6.0% |
| Total | 617 | 100.0% |
Transportation & Commute in Palm Beach Shores
Vehicle Availability by Sex in Palm Beach Shores
The most prevalent vehicle ownership categories in Palm Beach Shores are males with 1 vehicle (103, accounting for 39.3%) and females with 1 vehicle (97, making up 46.2%).
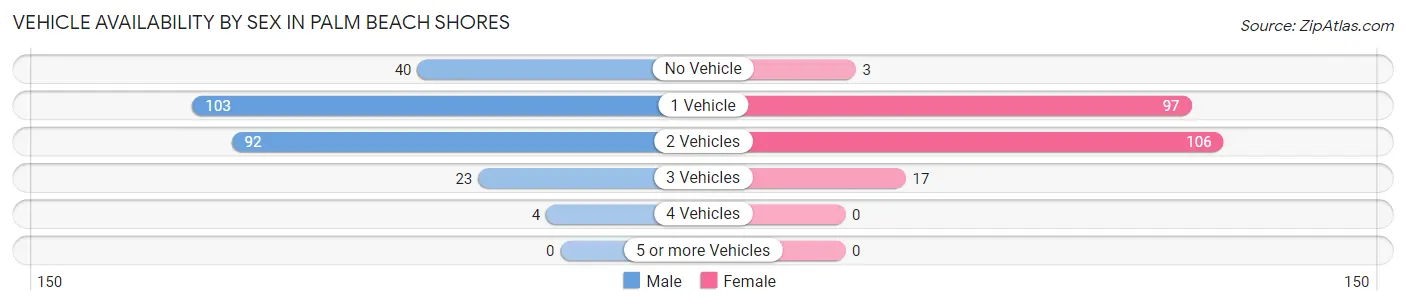
| Vehicles Available | Male | Female |
| No Vehicle | 40 (15.3%) | 3 (1.3%) |
| 1 Vehicle | 103 (39.3%) | 97 (43.5%) |
| 2 Vehicles | 92 (35.1%) | 106 (47.5%) |
| 3 Vehicles | 23 (8.8%) | 17 (7.6%) |
| 4 Vehicles | 4 (1.5%) | 0 (0.0%) |
| 5 or more Vehicles | 0 (0.0%) | 0 (0.0%) |
| Total | 262 (100.0%) | 223 (100.0%) |
Commute Time in Palm Beach Shores
The most frequently occuring commute durations in Palm Beach Shores are 30 to 34 minutes (74 commuters, 19.2%), 15 to 19 minutes (71 commuters, 18.4%), and 5 to 9 minutes (66 commuters, 17.1%).
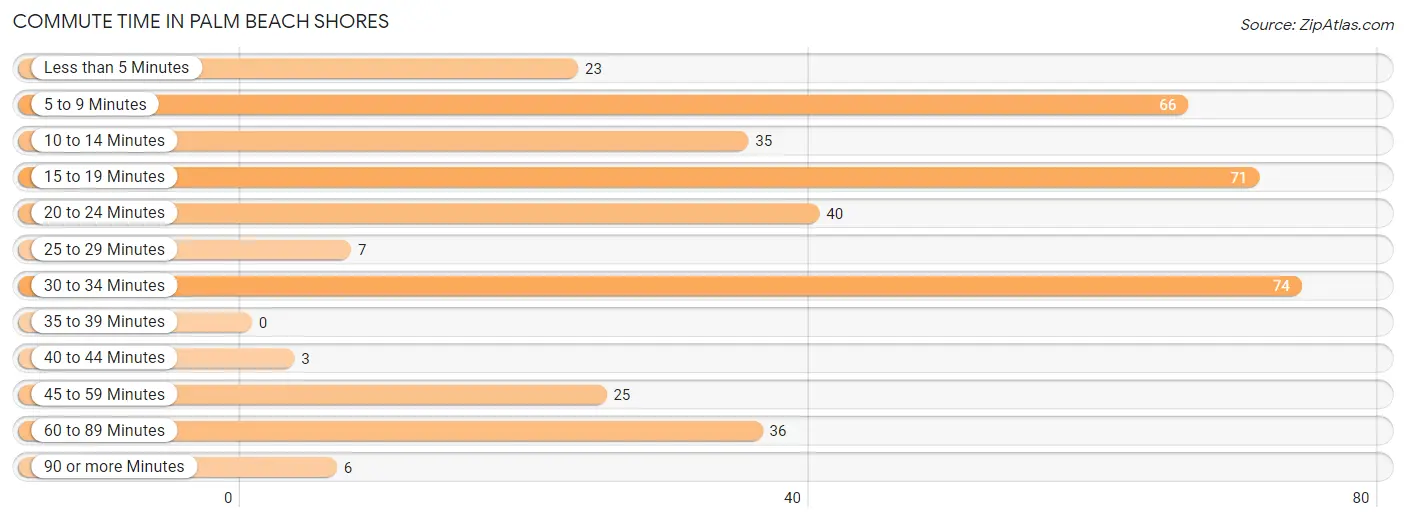
| Commute Time | # Commuters | % Commuters |
| Less than 5 Minutes | 23 | 6.0% |
| 5 to 9 Minutes | 66 | 17.1% |
| 10 to 14 Minutes | 35 | 9.1% |
| 15 to 19 Minutes | 71 | 18.4% |
| 20 to 24 Minutes | 40 | 10.4% |
| 25 to 29 Minutes | 7 | 1.8% |
| 30 to 34 Minutes | 74 | 19.2% |
| 35 to 39 Minutes | 0 | 0.0% |
| 40 to 44 Minutes | 3 | 0.8% |
| 45 to 59 Minutes | 25 | 6.5% |
| 60 to 89 Minutes | 36 | 9.3% |
| 90 or more Minutes | 6 | 1.5% |
Commute Time by Sex in Palm Beach Shores
The most common commute times in Palm Beach Shores are 5 to 9 minutes (43 commuters, 18.4%) for males and 30 to 34 minutes (45 commuters, 29.4%) for females.
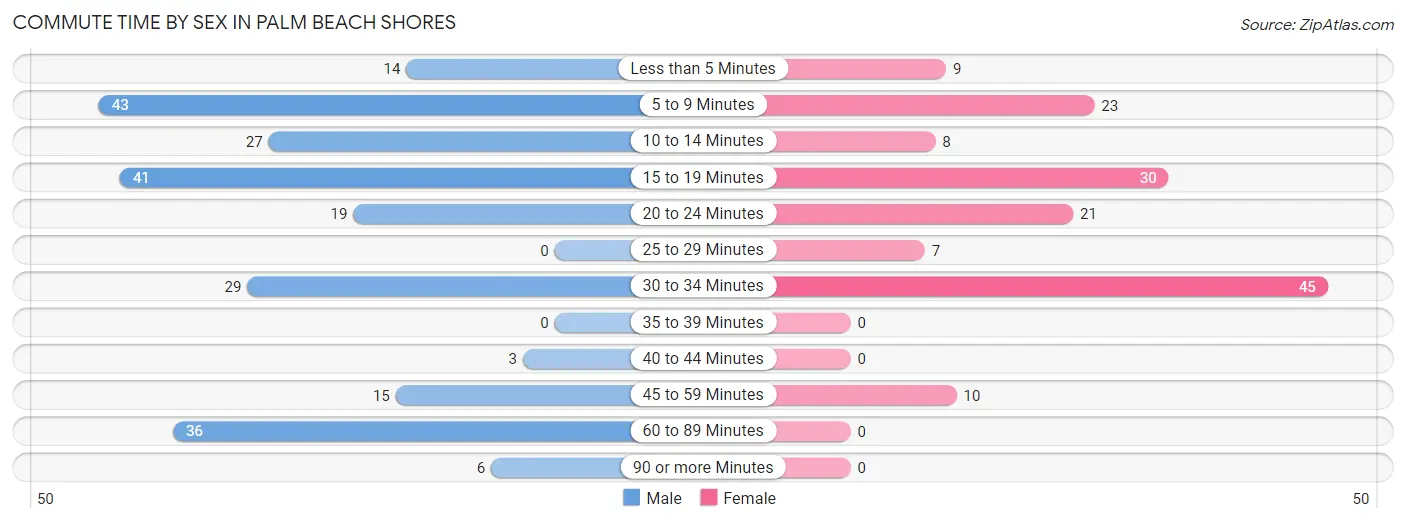
| Commute Time | Male | Female |
| Less than 5 Minutes | 14 (6.0%) | 9 (5.9%) |
| 5 to 9 Minutes | 43 (18.4%) | 23 (15.0%) |
| 10 to 14 Minutes | 27 (11.6%) | 8 (5.2%) |
| 15 to 19 Minutes | 41 (17.6%) | 30 (19.6%) |
| 20 to 24 Minutes | 19 (8.2%) | 21 (13.7%) |
| 25 to 29 Minutes | 0 (0.0%) | 7 (4.6%) |
| 30 to 34 Minutes | 29 (12.4%) | 45 (29.4%) |
| 35 to 39 Minutes | 0 (0.0%) | 0 (0.0%) |
| 40 to 44 Minutes | 3 (1.3%) | 0 (0.0%) |
| 45 to 59 Minutes | 15 (6.4%) | 10 (6.5%) |
| 60 to 89 Minutes | 36 (15.4%) | 0 (0.0%) |
| 90 or more Minutes | 6 (2.6%) | 0 (0.0%) |
Time of Departure to Work by Sex in Palm Beach Shores
The most frequent times of departure to work in Palm Beach Shores are 7:30 AM to 7:59 AM (72, 30.9%) for males and 7:00 AM to 7:29 AM (45, 29.4%) for females.
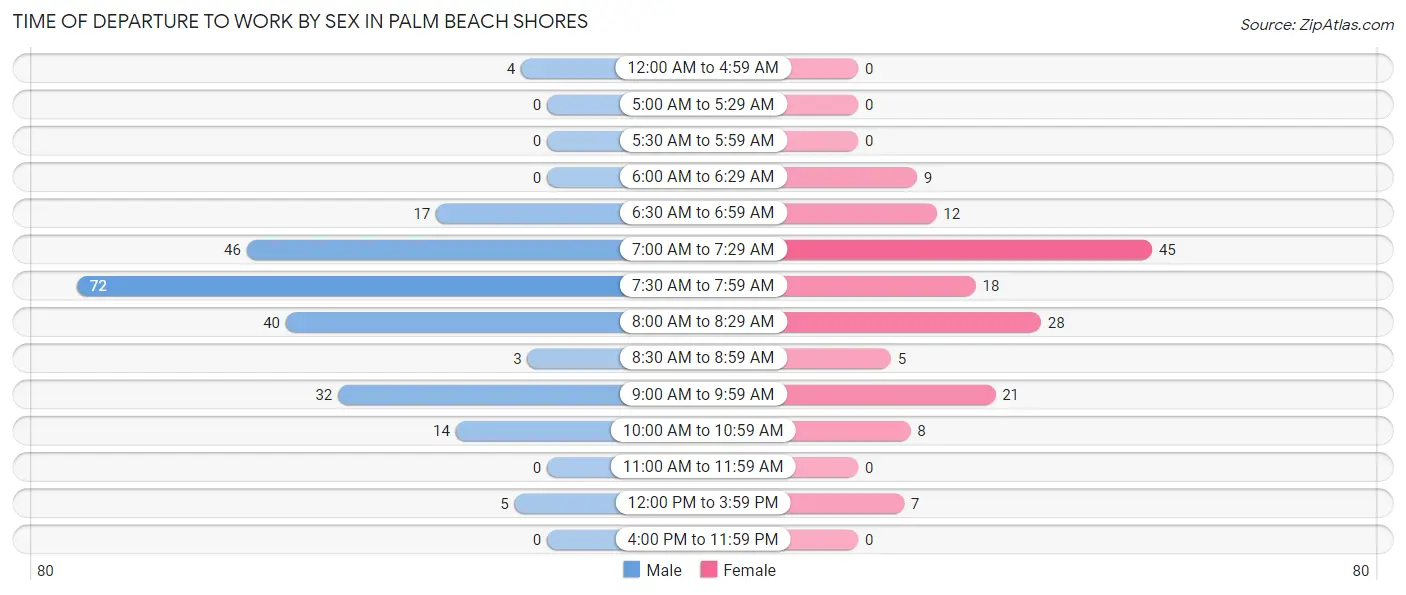
| Time of Departure | Male | Female |
| 12:00 AM to 4:59 AM | 4 (1.7%) | 0 (0.0%) |
| 5:00 AM to 5:29 AM | 0 (0.0%) | 0 (0.0%) |
| 5:30 AM to 5:59 AM | 0 (0.0%) | 0 (0.0%) |
| 6:00 AM to 6:29 AM | 0 (0.0%) | 9 (5.9%) |
| 6:30 AM to 6:59 AM | 17 (7.3%) | 12 (7.8%) |
| 7:00 AM to 7:29 AM | 46 (19.7%) | 45 (29.4%) |
| 7:30 AM to 7:59 AM | 72 (30.9%) | 18 (11.8%) |
| 8:00 AM to 8:29 AM | 40 (17.2%) | 28 (18.3%) |
| 8:30 AM to 8:59 AM | 3 (1.3%) | 5 (3.3%) |
| 9:00 AM to 9:59 AM | 32 (13.7%) | 21 (13.7%) |
| 10:00 AM to 10:59 AM | 14 (6.0%) | 8 (5.2%) |
| 11:00 AM to 11:59 AM | 0 (0.0%) | 0 (0.0%) |
| 12:00 PM to 3:59 PM | 5 (2.1%) | 7 (4.6%) |
| 4:00 PM to 11:59 PM | 0 (0.0%) | 0 (0.0%) |
| Total | 233 (100.0%) | 153 (100.0%) |
Housing Occupancy in Palm Beach Shores
Occupancy by Ownership in Palm Beach Shores
Of the total 727 dwellings in Palm Beach Shores, owner-occupied units account for 424 (58.3%), while renter-occupied units make up 303 (41.7%).
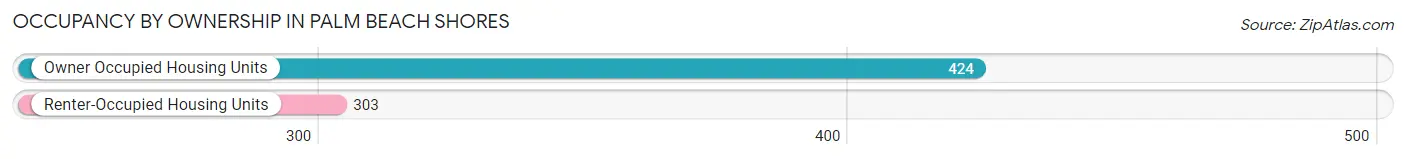
| Occupancy | # Housing Units | % Housing Units |
| Owner Occupied Housing Units | 424 | 58.3% |
| Renter-Occupied Housing Units | 303 | 41.7% |
| Total Occupied Housing Units | 727 | 100.0% |
Occupancy by Household Size in Palm Beach Shores
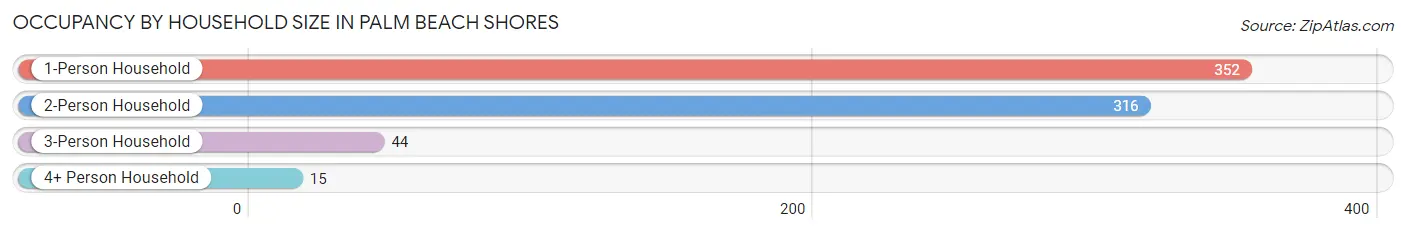
| Household Size | # Housing Units | % Housing Units |
| 1-Person Household | 352 | 48.4% |
| 2-Person Household | 316 | 43.5% |
| 3-Person Household | 44 | 6.0% |
| 4+ Person Household | 15 | 2.1% |
| Total Housing Units | 727 | 100.0% |
Occupancy by Ownership by Household Size in Palm Beach Shores
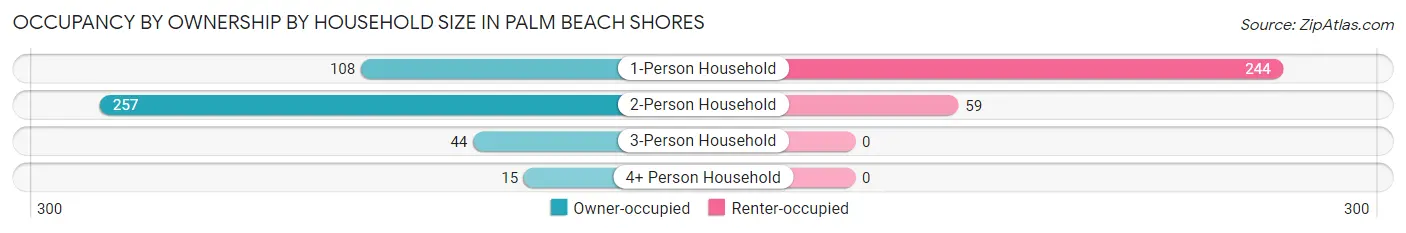
| Household Size | Owner-occupied | Renter-occupied |
| 1-Person Household | 108 (30.7%) | 244 (69.3%) |
| 2-Person Household | 257 (81.3%) | 59 (18.7%) |
| 3-Person Household | 44 (100.0%) | 0 (0.0%) |
| 4+ Person Household | 15 (100.0%) | 0 (0.0%) |
| Total Housing Units | 424 (58.3%) | 303 (41.7%) |
Occupancy by Educational Attainment in Palm Beach Shores
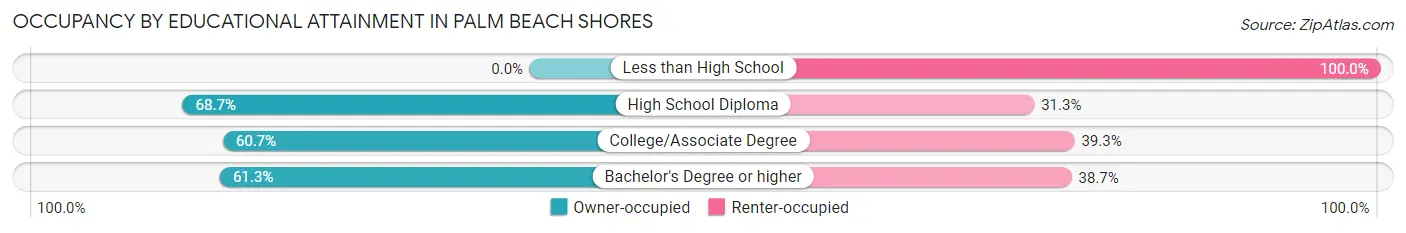
| Household Size | Owner-occupied | Renter-occupied |
| Less than High School | 0 (0.0%) | 41 (100.0%) |
| High School Diploma | 46 (68.7%) | 21 (31.3%) |
| College/Associate Degree | 125 (60.7%) | 81 (39.3%) |
| Bachelor's Degree or higher | 253 (61.3%) | 160 (38.7%) |
Occupancy by Age of Householder in Palm Beach Shores
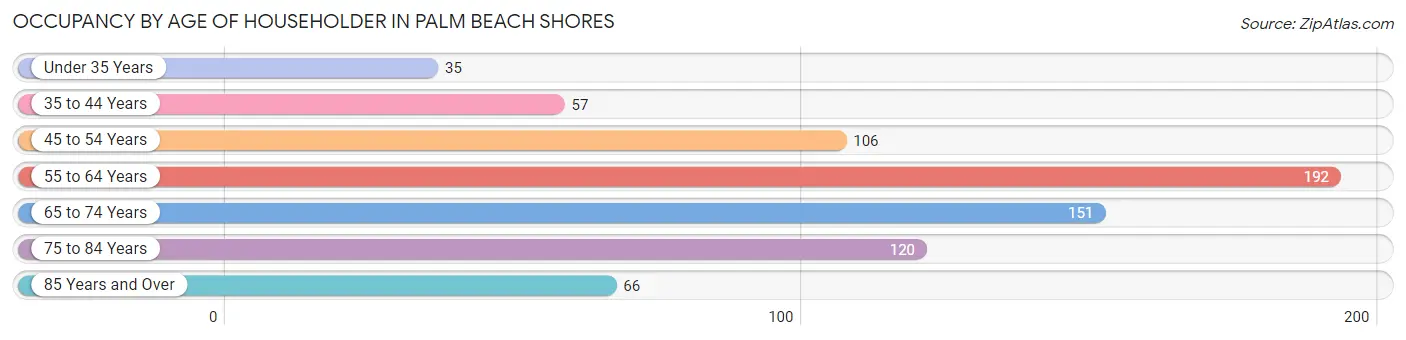
| Age Bracket | # Households | % Households |
| Under 35 Years | 35 | 4.8% |
| 35 to 44 Years | 57 | 7.8% |
| 45 to 54 Years | 106 | 14.6% |
| 55 to 64 Years | 192 | 26.4% |
| 65 to 74 Years | 151 | 20.8% |
| 75 to 84 Years | 120 | 16.5% |
| 85 Years and Over | 66 | 9.1% |
| Total | 727 | 100.0% |
Housing Finances in Palm Beach Shores
Median Income by Occupancy in Palm Beach Shores
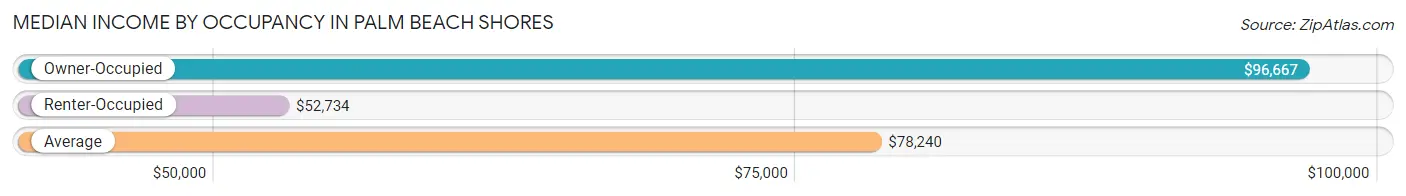
| Occupancy Type | # Households | Median Income |
| Owner-Occupied | 424 (58.3%) | $96,667 |
| Renter-Occupied | 303 (41.7%) | $52,734 |
| Average | 727 (100.0%) | $78,240 |
Occupancy by Householder Income Bracket in Palm Beach Shores
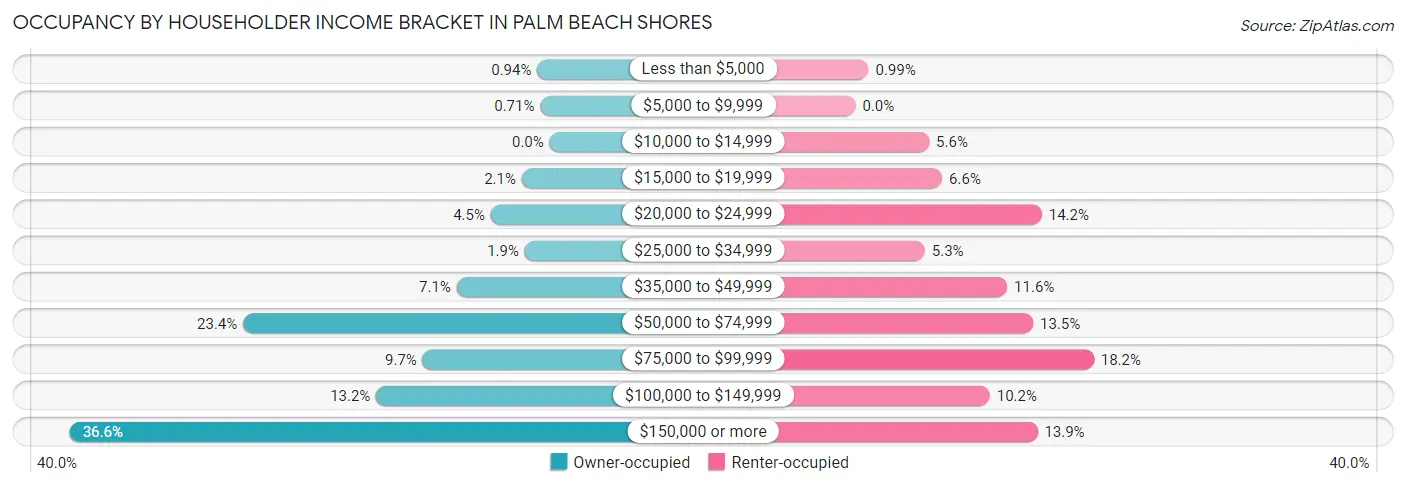
| Income Bracket | Owner-occupied | Renter-occupied |
| Less than $5,000 | 4 (0.9%) | 3 (1.0%) |
| $5,000 to $9,999 | 3 (0.7%) | 0 (0.0%) |
| $10,000 to $14,999 | 0 (0.0%) | 17 (5.6%) |
| $15,000 to $19,999 | 9 (2.1%) | 20 (6.6%) |
| $20,000 to $24,999 | 19 (4.5%) | 43 (14.2%) |
| $25,000 to $34,999 | 8 (1.9%) | 16 (5.3%) |
| $35,000 to $49,999 | 30 (7.1%) | 35 (11.6%) |
| $50,000 to $74,999 | 99 (23.4%) | 41 (13.5%) |
| $75,000 to $99,999 | 41 (9.7%) | 55 (18.1%) |
| $100,000 to $149,999 | 56 (13.2%) | 31 (10.2%) |
| $150,000 or more | 155 (36.6%) | 42 (13.9%) |
| Total | 424 (100.0%) | 303 (100.0%) |
Monthly Housing Cost Tiers in Palm Beach Shores
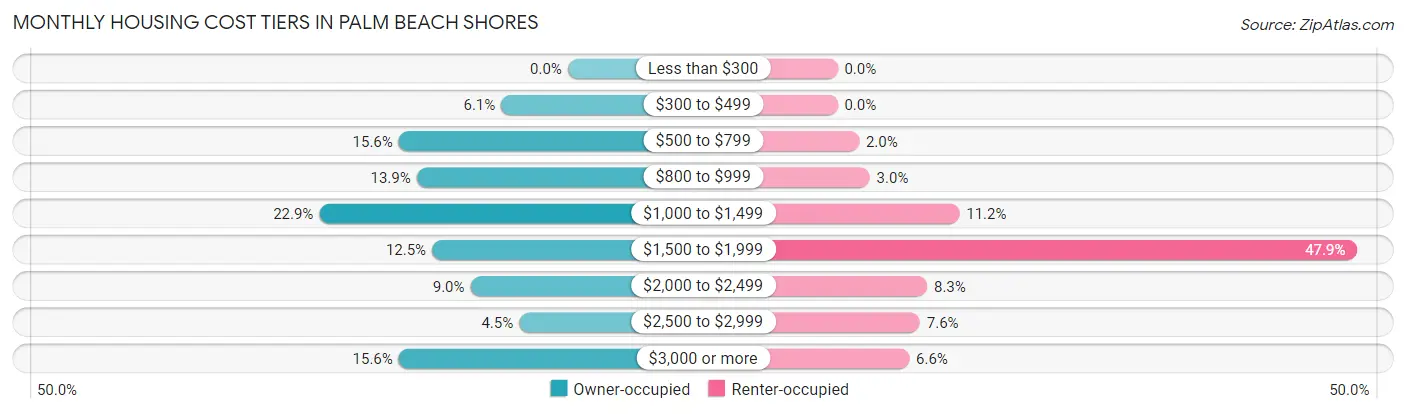
| Monthly Cost | Owner-occupied | Renter-occupied |
| Less than $300 | 0 (0.0%) | 0 (0.0%) |
| $300 to $499 | 26 (6.1%) | 0 (0.0%) |
| $500 to $799 | 66 (15.6%) | 6 (2.0%) |
| $800 to $999 | 59 (13.9%) | 9 (3.0%) |
| $1,000 to $1,499 | 97 (22.9%) | 34 (11.2%) |
| $1,500 to $1,999 | 53 (12.5%) | 145 (47.8%) |
| $2,000 to $2,499 | 38 (9.0%) | 25 (8.3%) |
| $2,500 to $2,999 | 19 (4.5%) | 23 (7.6%) |
| $3,000 or more | 66 (15.6%) | 20 (6.6%) |
| Total | 424 (100.0%) | 303 (100.0%) |
Physical Housing Characteristics in Palm Beach Shores
Housing Structures in Palm Beach Shores
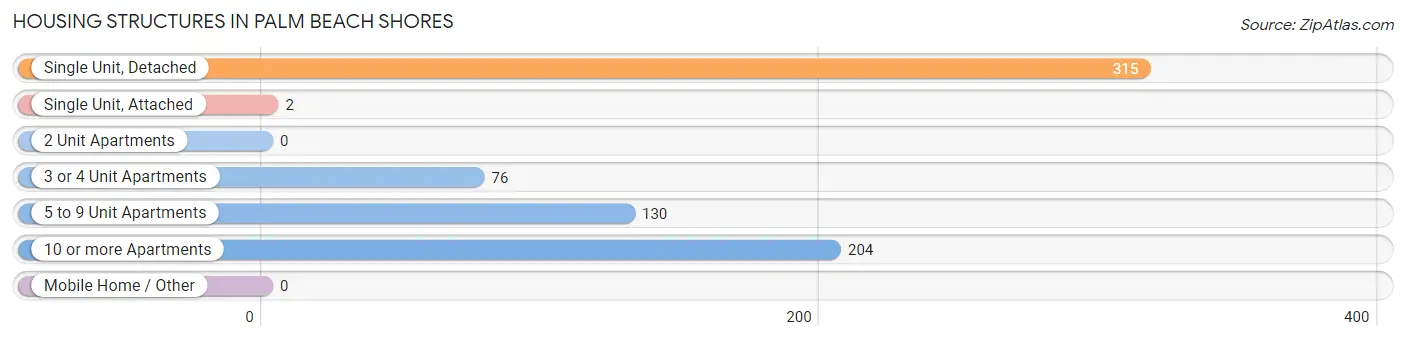
| Structure Type | # Housing Units | % Housing Units |
| Single Unit, Detached | 315 | 43.3% |
| Single Unit, Attached | 2 | 0.3% |
| 2 Unit Apartments | 0 | 0.0% |
| 3 or 4 Unit Apartments | 76 | 10.4% |
| 5 to 9 Unit Apartments | 130 | 17.9% |
| 10 or more Apartments | 204 | 28.1% |
| Mobile Home / Other | 0 | 0.0% |
| Total | 727 | 100.0% |
Housing Structures by Occupancy in Palm Beach Shores
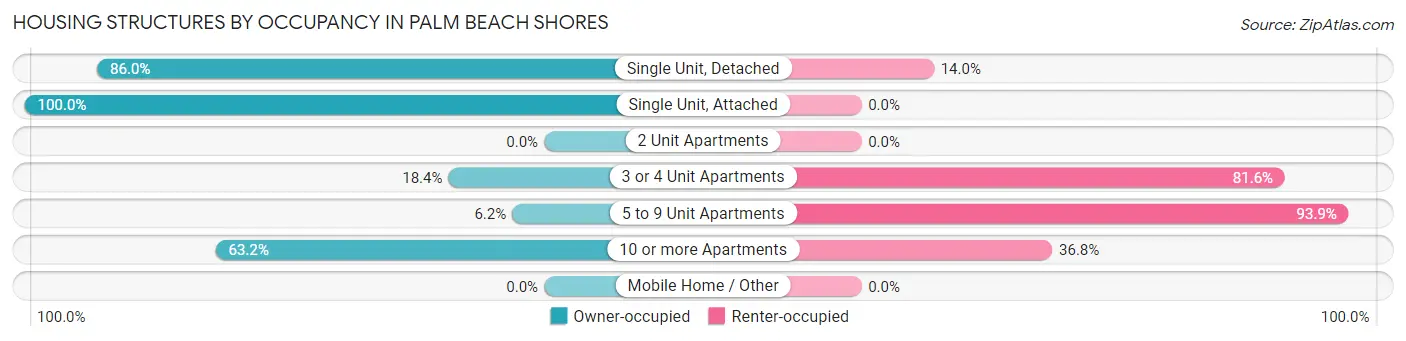
| Structure Type | Owner-occupied | Renter-occupied |
| Single Unit, Detached | 271 (86.0%) | 44 (14.0%) |
| Single Unit, Attached | 2 (100.0%) | 0 (0.0%) |
| 2 Unit Apartments | 0 (0.0%) | 0 (0.0%) |
| 3 or 4 Unit Apartments | 14 (18.4%) | 62 (81.6%) |
| 5 to 9 Unit Apartments | 8 (6.1%) | 122 (93.9%) |
| 10 or more Apartments | 129 (63.2%) | 75 (36.8%) |
| Mobile Home / Other | 0 (0.0%) | 0 (0.0%) |
| Total | 424 (58.3%) | 303 (41.7%) |
Housing Structures by Number of Rooms in Palm Beach Shores
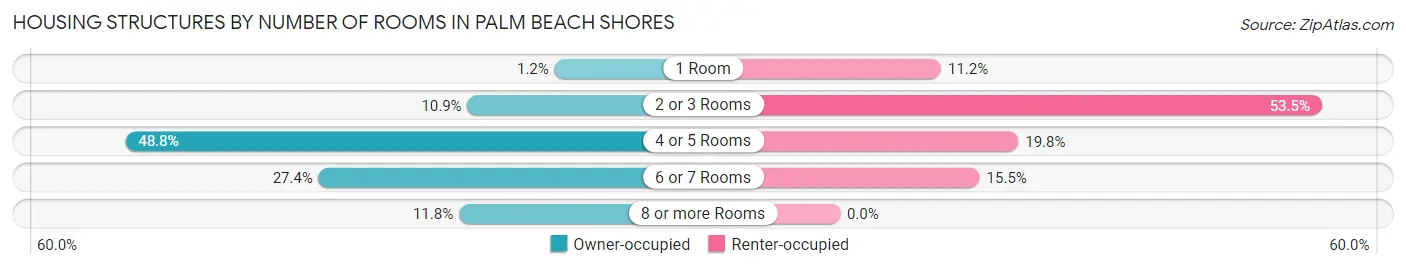
| Number of Rooms | Owner-occupied | Renter-occupied |
| 1 Room | 5 (1.2%) | 34 (11.2%) |
| 2 or 3 Rooms | 46 (10.8%) | 162 (53.5%) |
| 4 or 5 Rooms | 207 (48.8%) | 60 (19.8%) |
| 6 or 7 Rooms | 116 (27.4%) | 47 (15.5%) |
| 8 or more Rooms | 50 (11.8%) | 0 (0.0%) |
| Total | 424 (100.0%) | 303 (100.0%) |
Housing Structure by Heating Type in Palm Beach Shores
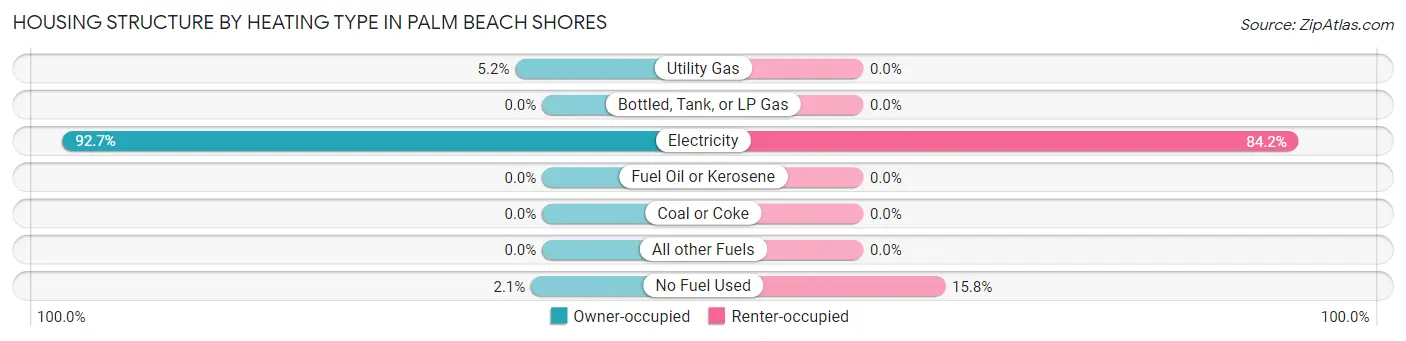
| Heating Type | Owner-occupied | Renter-occupied |
| Utility Gas | 22 (5.2%) | 0 (0.0%) |
| Bottled, Tank, or LP Gas | 0 (0.0%) | 0 (0.0%) |
| Electricity | 393 (92.7%) | 255 (84.2%) |
| Fuel Oil or Kerosene | 0 (0.0%) | 0 (0.0%) |
| Coal or Coke | 0 (0.0%) | 0 (0.0%) |
| All other Fuels | 0 (0.0%) | 0 (0.0%) |
| No Fuel Used | 9 (2.1%) | 48 (15.8%) |
| Total | 424 (100.0%) | 303 (100.0%) |
Household Vehicle Usage in Palm Beach Shores
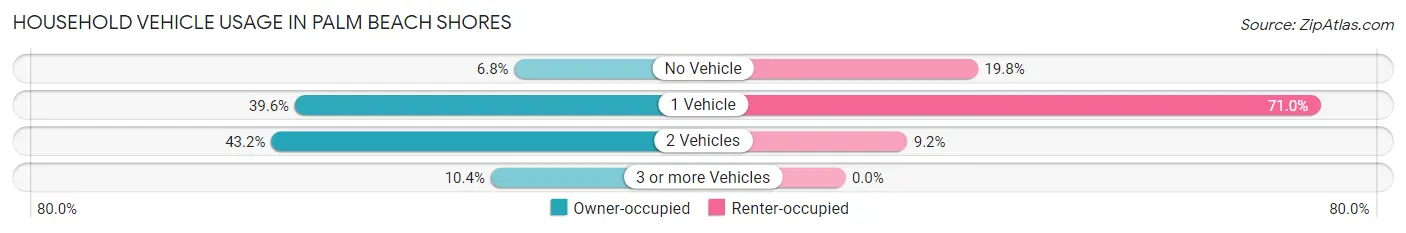
| Vehicles per Household | Owner-occupied | Renter-occupied |
| No Vehicle | 29 (6.8%) | 60 (19.8%) |
| 1 Vehicle | 168 (39.6%) | 215 (71.0%) |
| 2 Vehicles | 183 (43.2%) | 28 (9.2%) |
| 3 or more Vehicles | 44 (10.4%) | 0 (0.0%) |
| Total | 424 (100.0%) | 303 (100.0%) |
Real Estate & Mortgages in Palm Beach Shores
Real Estate and Mortgage Overview in Palm Beach Shores
| Characteristic | Without Mortgage | With Mortgage |
| Housing Units | 290 | 134 |
| Median Property Value | $566,500 | $711,800 |
| Median Household Income | $78,333 | $78 |
| Monthly Housing Costs | $976 | $66 |
| Real Estate Taxes | $5,290 | $0 |
Property Value by Mortgage Status in Palm Beach Shores
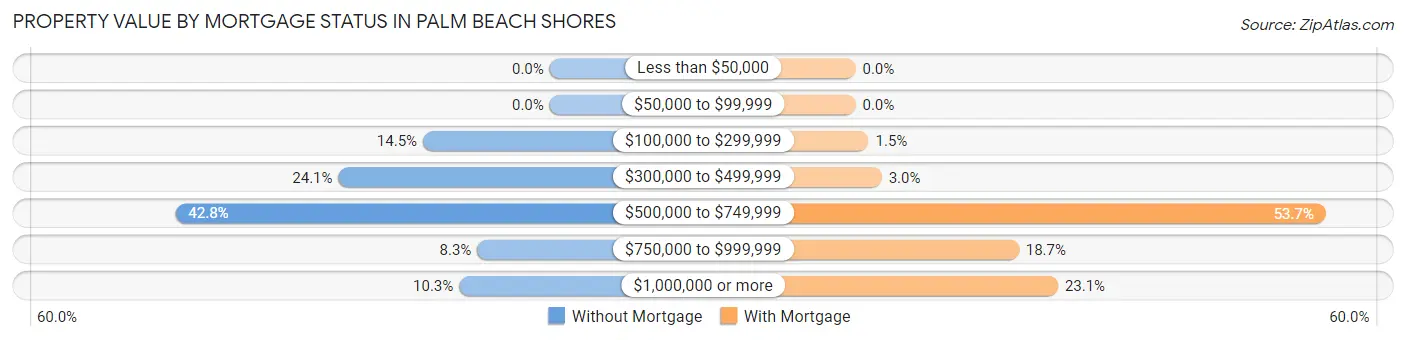
| Property Value | Without Mortgage | With Mortgage |
| Less than $50,000 | 0 (0.0%) | 0 (0.0%) |
| $50,000 to $99,999 | 0 (0.0%) | 0 (0.0%) |
| $100,000 to $299,999 | 42 (14.5%) | 2 (1.5%) |
| $300,000 to $499,999 | 70 (24.1%) | 4 (3.0%) |
| $500,000 to $749,999 | 124 (42.8%) | 72 (53.7%) |
| $750,000 to $999,999 | 24 (8.3%) | 25 (18.7%) |
| $1,000,000 or more | 30 (10.3%) | 31 (23.1%) |
| Total | 290 (100.0%) | 134 (100.0%) |
Household Income by Mortgage Status in Palm Beach Shores
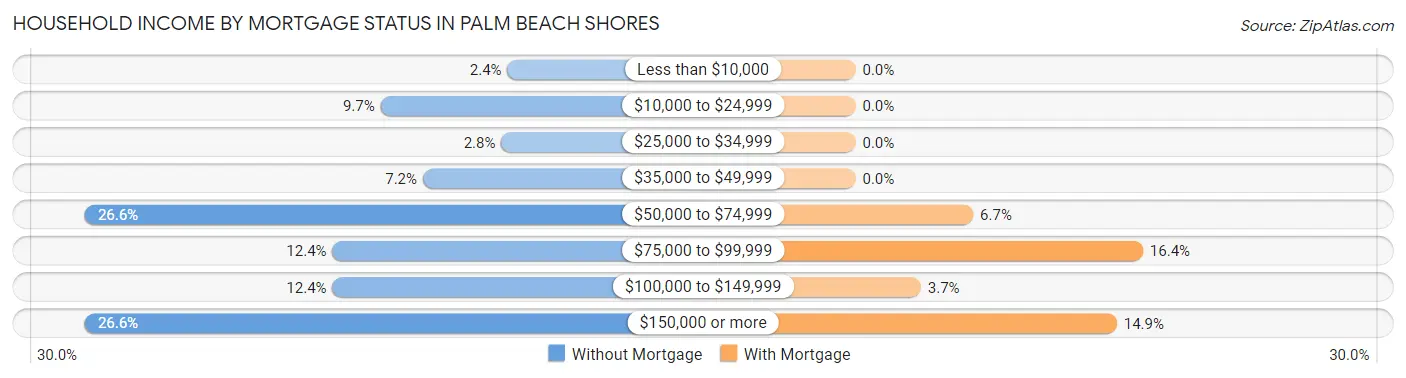
| Household Income | Without Mortgage | With Mortgage |
| Less than $10,000 | 7 (2.4%) | 0 (0.0%) |
| $10,000 to $24,999 | 28 (9.7%) | 0 (0.0%) |
| $25,000 to $34,999 | 8 (2.8%) | 0 (0.0%) |
| $35,000 to $49,999 | 21 (7.2%) | 0 (0.0%) |
| $50,000 to $74,999 | 77 (26.6%) | 9 (6.7%) |
| $75,000 to $99,999 | 36 (12.4%) | 22 (16.4%) |
| $100,000 to $149,999 | 36 (12.4%) | 5 (3.7%) |
| $150,000 or more | 77 (26.6%) | 20 (14.9%) |
| Total | 290 (100.0%) | 134 (100.0%) |
Property Value to Household Income Ratio in Palm Beach Shores
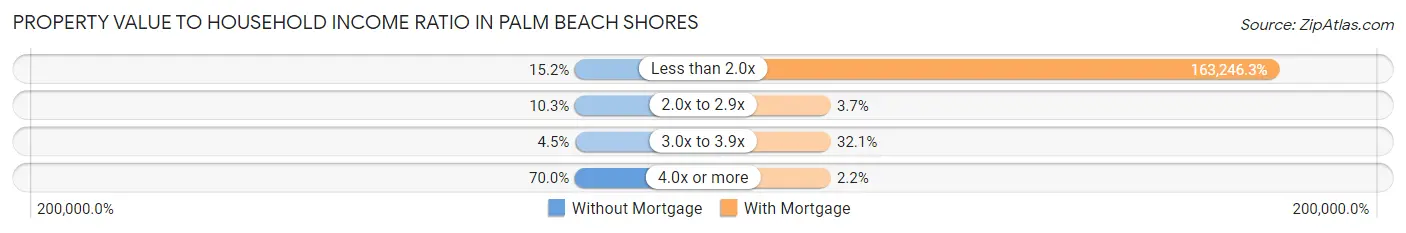
| Value-to-Income Ratio | Without Mortgage | With Mortgage |
| Less than 2.0x | 44 (15.2%) | 218,750 (163,246.3%) |
| 2.0x to 2.9x | 30 (10.3%) | 5 (3.7%) |
| 3.0x to 3.9x | 13 (4.5%) | 43 (32.1%) |
| 4.0x or more | 203 (70.0%) | 3 (2.2%) |
| Total | 290 (100.0%) | 134 (100.0%) |
Real Estate Taxes by Mortgage Status in Palm Beach Shores
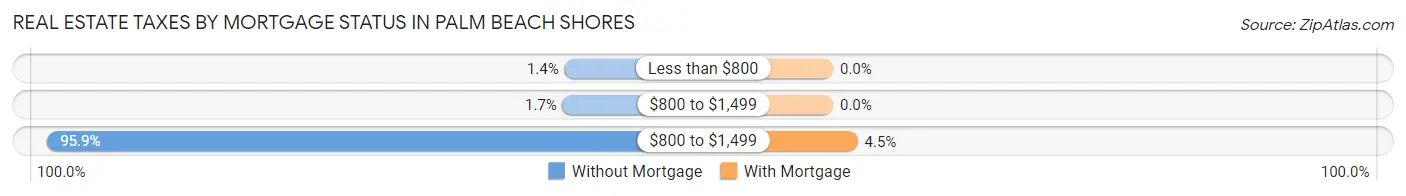
| Property Taxes | Without Mortgage | With Mortgage |
| Less than $800 | 4 (1.4%) | 0 (0.0%) |
| $800 to $1,499 | 5 (1.7%) | 0 (0.0%) |
| $800 to $1,499 | 278 (95.9%) | 6 (4.5%) |
| Total | 290 (100.0%) | 134 (100.0%) |
Health & Disability in Palm Beach Shores
Health Insurance Coverage by Age in Palm Beach Shores
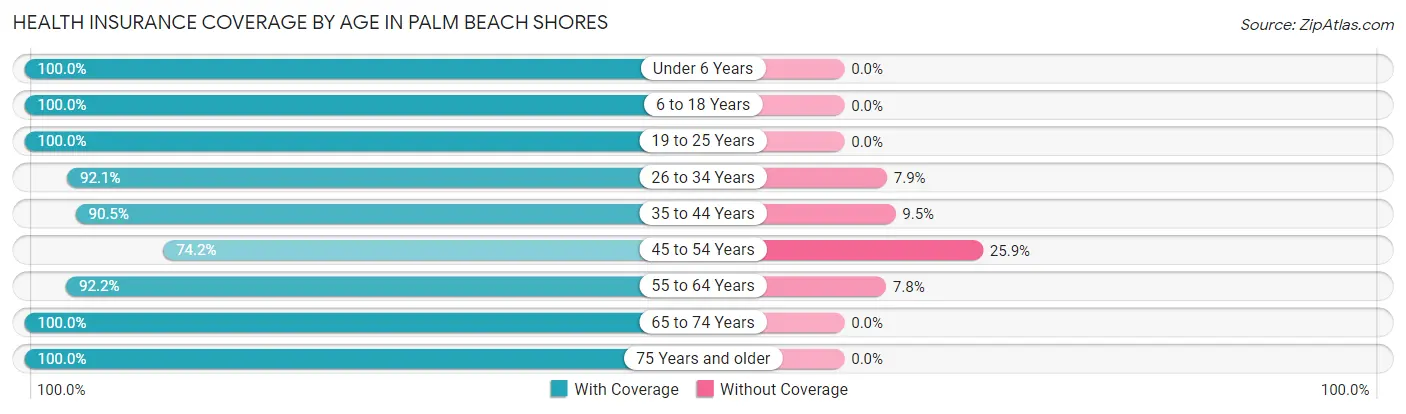
| Age Bracket | With Coverage | Without Coverage |
| Under 6 Years | 14 (100.0%) | 0 (0.0%) |
| 6 to 18 Years | 53 (100.0%) | 0 (0.0%) |
| 19 to 25 Years | 54 (100.0%) | 0 (0.0%) |
| 26 to 34 Years | 58 (92.1%) | 5 (7.9%) |
| 35 to 44 Years | 76 (90.5%) | 8 (9.5%) |
| 45 to 54 Years | 109 (74.2%) | 38 (25.9%) |
| 55 to 64 Years | 297 (92.2%) | 25 (7.8%) |
| 65 to 74 Years | 199 (100.0%) | 0 (0.0%) |
| 75 Years and older | 281 (100.0%) | 0 (0.0%) |
| Total | 1,141 (93.8%) | 76 (6.2%) |
Health Insurance Coverage by Citizenship Status in Palm Beach Shores
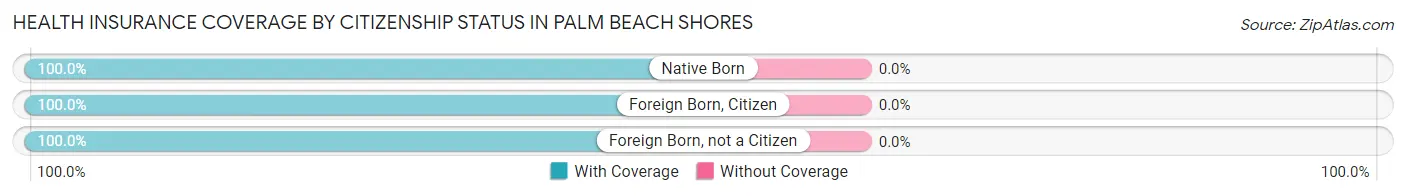
| Citizenship Status | With Coverage | Without Coverage |
| Native Born | 14 (100.0%) | 0 (0.0%) |
| Foreign Born, Citizen | 53 (100.0%) | 0 (0.0%) |
| Foreign Born, not a Citizen | 54 (100.0%) | 0 (0.0%) |
Health Insurance Coverage by Household Income in Palm Beach Shores
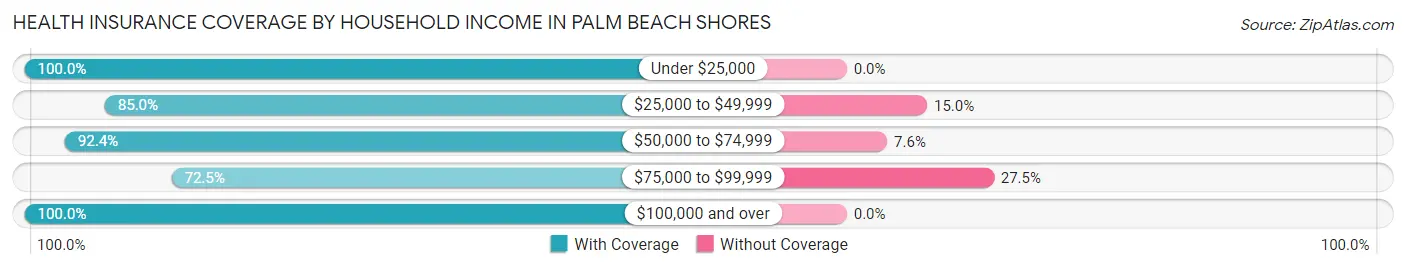
| Household Income | With Coverage | Without Coverage |
| Under $25,000 | 127 (100.0%) | 0 (0.0%) |
| $25,000 to $49,999 | 113 (85.0%) | 20 (15.0%) |
| $50,000 to $74,999 | 220 (92.4%) | 18 (7.6%) |
| $75,000 to $99,999 | 100 (72.5%) | 38 (27.5%) |
| $100,000 and over | 559 (100.0%) | 0 (0.0%) |
Public vs Private Health Insurance Coverage by Age in Palm Beach Shores
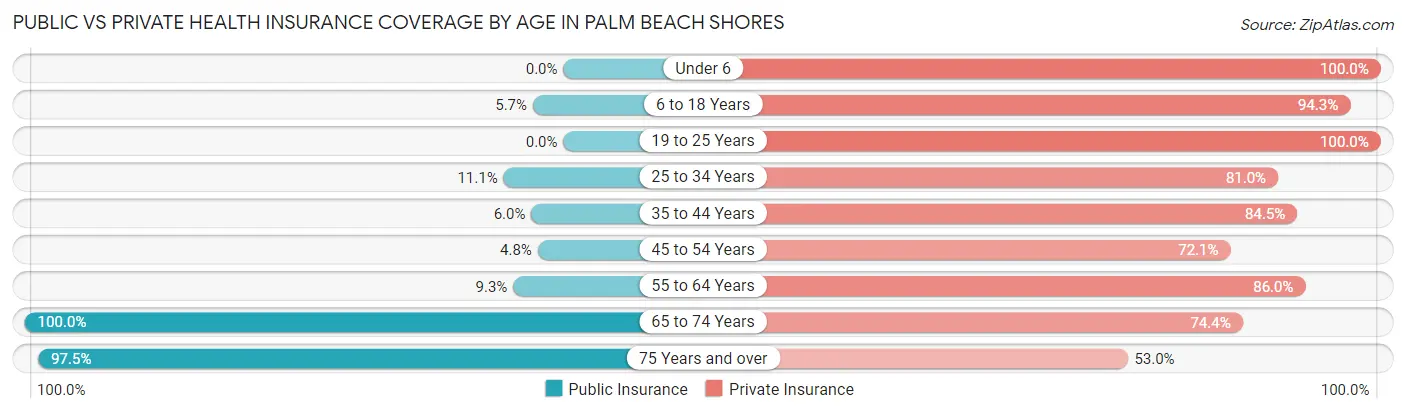
| Age Bracket | Public Insurance | Private Insurance |
| Under 6 | 0 (0.0%) | 14 (100.0%) |
| 6 to 18 Years | 3 (5.7%) | 50 (94.3%) |
| 19 to 25 Years | 0 (0.0%) | 54 (100.0%) |
| 25 to 34 Years | 7 (11.1%) | 51 (80.9%) |
| 35 to 44 Years | 5 (5.9%) | 71 (84.5%) |
| 45 to 54 Years | 7 (4.8%) | 106 (72.1%) |
| 55 to 64 Years | 30 (9.3%) | 277 (86.0%) |
| 65 to 74 Years | 199 (100.0%) | 148 (74.4%) |
| 75 Years and over | 274 (97.5%) | 149 (53.0%) |
| Total | 525 (43.1%) | 920 (75.6%) |
Disability Status by Sex by Age in Palm Beach Shores
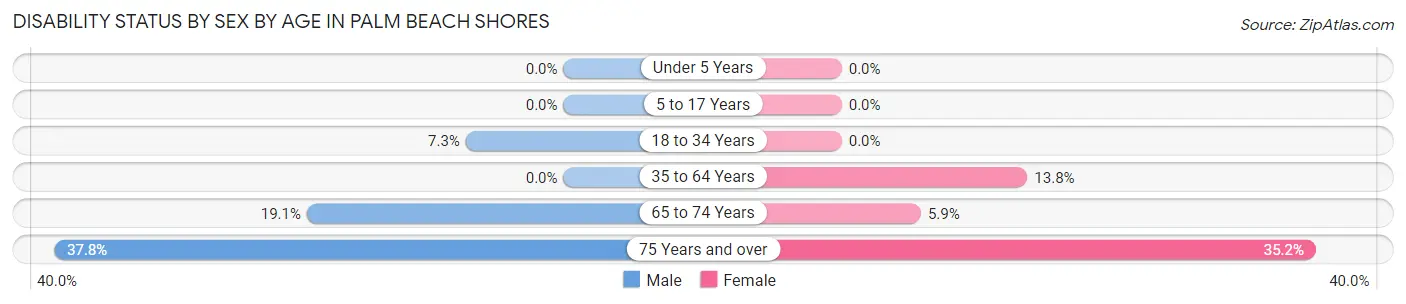
| Age Bracket | Male | Female |
| Under 5 Years | 0 (0.0%) | 0 (0.0%) |
| 5 to 17 Years | 0 (0.0%) | 0 (0.0%) |
| 18 to 34 Years | 5 (7.2%) | 0 (0.0%) |
| 35 to 64 Years | 0 (0.0%) | 39 (13.8%) |
| 65 to 74 Years | 12 (19.1%) | 8 (5.9%) |
| 75 Years and over | 45 (37.8%) | 57 (35.2%) |
Disability Class by Sex by Age in Palm Beach Shores
Disability Class: Hearing Difficulty
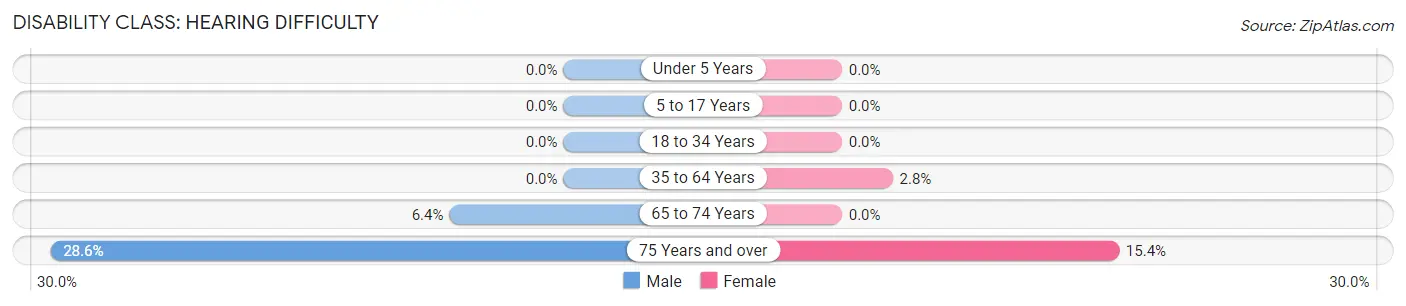
| Age Bracket | Male | Female |
| Under 5 Years | 0 (0.0%) | 0 (0.0%) |
| 5 to 17 Years | 0 (0.0%) | 0 (0.0%) |
| 18 to 34 Years | 0 (0.0%) | 0 (0.0%) |
| 35 to 64 Years | 0 (0.0%) | 8 (2.8%) |
| 65 to 74 Years | 4 (6.4%) | 0 (0.0%) |
| 75 Years and over | 34 (28.6%) | 25 (15.4%) |
Disability Class: Vision Difficulty
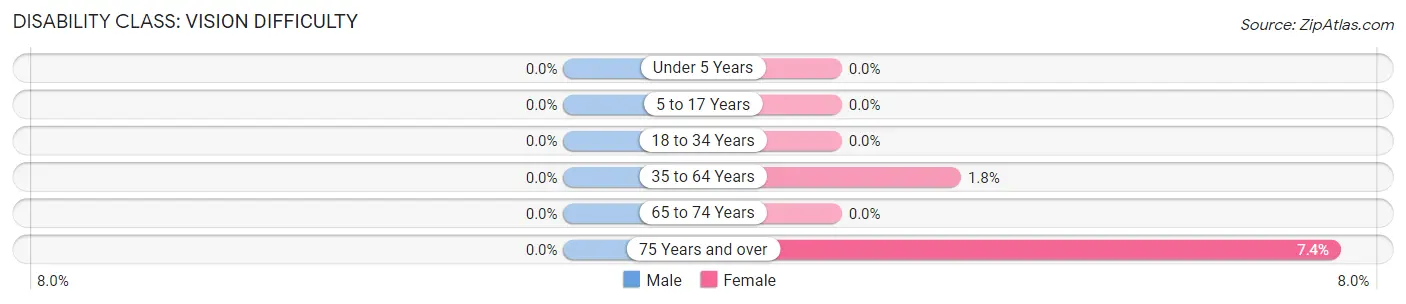
| Age Bracket | Male | Female |
| Under 5 Years | 0 (0.0%) | 0 (0.0%) |
| 5 to 17 Years | 0 (0.0%) | 0 (0.0%) |
| 18 to 34 Years | 0 (0.0%) | 0 (0.0%) |
| 35 to 64 Years | 0 (0.0%) | 5 (1.8%) |
| 65 to 74 Years | 0 (0.0%) | 0 (0.0%) |
| 75 Years and over | 0 (0.0%) | 12 (7.4%) |
Disability Class: Cognitive Difficulty
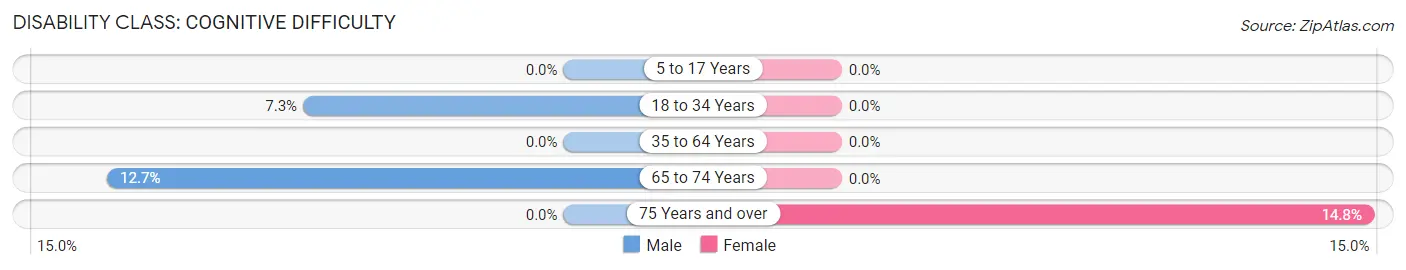
| Age Bracket | Male | Female |
| 5 to 17 Years | 0 (0.0%) | 0 (0.0%) |
| 18 to 34 Years | 5 (7.2%) | 0 (0.0%) |
| 35 to 64 Years | 0 (0.0%) | 0 (0.0%) |
| 65 to 74 Years | 8 (12.7%) | 0 (0.0%) |
| 75 Years and over | 0 (0.0%) | 24 (14.8%) |
Disability Class: Ambulatory Difficulty
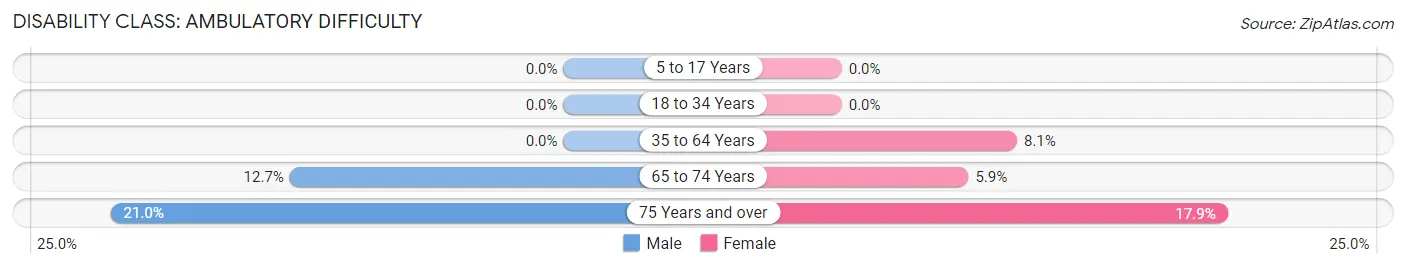
| Age Bracket | Male | Female |
| 5 to 17 Years | 0 (0.0%) | 0 (0.0%) |
| 18 to 34 Years | 0 (0.0%) | 0 (0.0%) |
| 35 to 64 Years | 0 (0.0%) | 23 (8.1%) |
| 65 to 74 Years | 8 (12.7%) | 8 (5.9%) |
| 75 Years and over | 25 (21.0%) | 29 (17.9%) |
Disability Class: Self-Care Difficulty
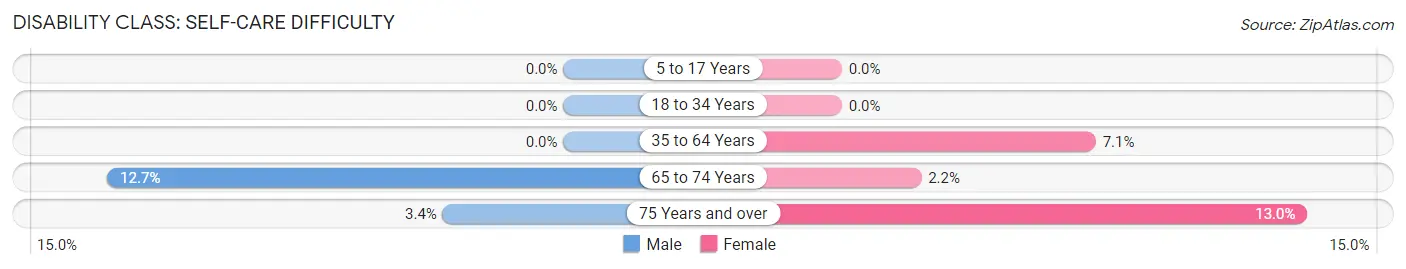
| Age Bracket | Male | Female |
| 5 to 17 Years | 0 (0.0%) | 0 (0.0%) |
| 18 to 34 Years | 0 (0.0%) | 0 (0.0%) |
| 35 to 64 Years | 0 (0.0%) | 20 (7.1%) |
| 65 to 74 Years | 8 (12.7%) | 3 (2.2%) |
| 75 Years and over | 4 (3.4%) | 21 (13.0%) |
Technology Access in Palm Beach Shores
Computing Device Access in Palm Beach Shores
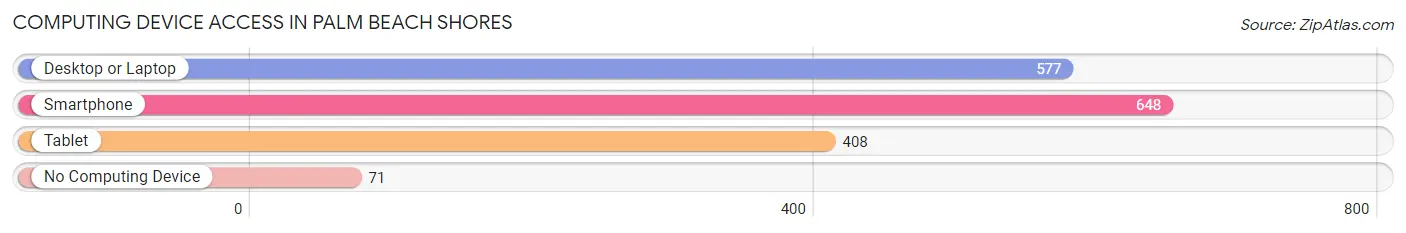
| Device Type | # Households | % Households |
| Desktop or Laptop | 577 | 79.4% |
| Smartphone | 648 | 89.1% |
| Tablet | 408 | 56.1% |
| No Computing Device | 71 | 9.8% |
| Total | 727 | 100.0% |
Internet Access in Palm Beach Shores
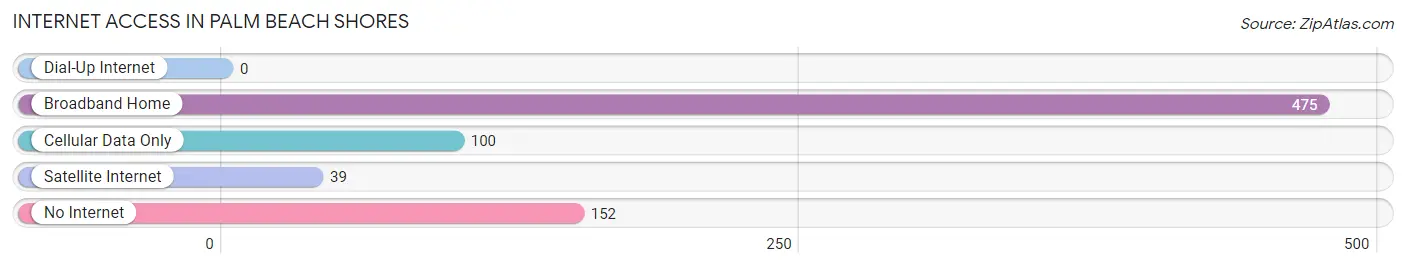
| Internet Type | # Households | % Households |
| Dial-Up Internet | 0 | 0.0% |
| Broadband Home | 475 | 65.3% |
| Cellular Data Only | 100 | 13.8% |
| Satellite Internet | 39 | 5.4% |
| No Internet | 152 | 20.9% |
| Total | 727 | 100.0% |
Palm Beach Shores Summary
Palm Beach Shores is a small town located in Palm Beach County, Florida. It is situated on the eastern coast of the state, just south of West Palm Beach. The town has a population of just over 1,000 people and covers an area of 0.7 square miles.
History
Palm Beach Shores was first settled in the late 1800s by a group of fishermen from the Bahamas. The town was originally known as “Fisherman’s Point” and was a popular spot for fishing and other recreational activities. In the early 1900s, the town was renamed “Palm Beach Shores” and began to attract more visitors.
In the 1920s, the town was incorporated and began to develop into a resort destination. The town was home to several hotels, restaurants, and other businesses. In the 1950s, the town was further developed with the construction of a marina and a golf course.
In the 1970s, the town was hit hard by the recession and many businesses closed. However, the town was able to recover and today it is a popular destination for tourists and locals alike.
Geography
Palm Beach Shores is located on the eastern coast of Florida, just south of West Palm Beach. The town is situated on a barrier island, which is separated from the mainland by the Intracoastal Waterway. The town is bordered by the Atlantic Ocean to the east and the Lake Worth Lagoon to the west.
The town has a tropical climate, with hot and humid summers and mild winters. The average temperature in the summer is around 90 degrees Fahrenheit, while the average temperature in the winter is around 70 degrees Fahrenheit.
Economy
The economy of Palm Beach Shores is largely based on tourism. The town is home to several hotels, restaurants, and other businesses that cater to tourists. The town also has a marina and a golf course, which attract visitors from all over the world.
In addition to tourism, the town is also home to several small businesses, such as retail stores, auto repair shops, and other services. The town also has a few manufacturing companies, which produce items such as furniture and clothing.
Demographics
As of the 2010 census, the population of Palm Beach Shores was 1,039. The town has a diverse population, with people from all over the world. The majority of the population is white (77.3%), followed by African American (14.2%), Hispanic (4.2%), and Asian (2.3%).
The median household income in the town is $50,000, which is slightly higher than the national average. The median age of the population is 55, which is higher than the national average. The town has a low unemployment rate of 3.2%, which is lower than the national average.
Conclusion
Palm Beach Shores is a small town located in Palm Beach County, Florida. It is situated on the eastern coast of the state, just south of West Palm Beach. The town has a population of just over 1,000 people and covers an area of 0.7 square miles. The town has a diverse population and a strong economy based on tourism. The town also has a few manufacturing companies, which produce items such as furniture and clothing. The median household income in the town is $50,000, which is slightly higher than the national average. The town has a low unemployment rate of 3.2%, which is lower than the national average.
Common Questions
What is Per Capita Income in Palm Beach Shores?
Per Capita income in Palm Beach Shores is $79,379.
What is the Median Family Income in Palm Beach Shores?
Median Family Income in Palm Beach Shores is $111,875.
What is the Median Household income in Palm Beach Shores?
Median Household Income in Palm Beach Shores is $78,240.
What is Income or Wage Gap in Palm Beach Shores?
Income or Wage Gap in Palm Beach Shores is 31.9%.
Women in Palm Beach Shores earn 68.1 cents for every dollar earned by a man.
What is Inequality or Gini Index in Palm Beach Shores?
Inequality or Gini Index in Palm Beach Shores is 0.52.
What is the Total Population of Palm Beach Shores?
Total Population of Palm Beach Shores is 1,217.
What is the Total Male Population of Palm Beach Shores?
Total Male Population of Palm Beach Shores is 562.
What is the Total Female Population of Palm Beach Shores?
Total Female Population of Palm Beach Shores is 655.
What is the Ratio of Males per 100 Females in Palm Beach Shores?
There are 85.80 Males per 100 Females in Palm Beach Shores.
What is the Ratio of Females per 100 Males in Palm Beach Shores?
There are 116.55 Females per 100 Males in Palm Beach Shores.
What is the Median Population Age in Palm Beach Shores?
Median Population Age in Palm Beach Shores is 60.0 Years.
What is the Average Family Size in Palm Beach Shores
Average Family Size in Palm Beach Shores is 2.2 People.
What is the Average Household Size in Palm Beach Shores
Average Household Size in Palm Beach Shores is 1.6 People.
How Large is the Labor Force in Palm Beach Shores?
There are 540 People in the Labor Forcein in Palm Beach Shores.
What is the Percentage of People in the Labor Force in Palm Beach Shores?
47.0% of People are in the Labor Force in Palm Beach Shores.
What is the Unemployment Rate in Palm Beach Shores?
Unemployment Rate in Palm Beach Shores is 8.9%.