Palm City, FL Map & Demographics
Palm City Map
Palm City Overview
$62,234
PER CAPITA INCOME
$130,813
AVG FAMILY INCOME
$111,394
AVG HOUSEHOLD INCOME
58.5%
WAGE / INCOME GAP [ % ]
41.5¢/ $1
WAGE / INCOME GAP [ $ ]
0.46
INEQUALITY / GINI INDEX
25,957
TOTAL POPULATION
12,297
MALE POPULATION
13,660
FEMALE POPULATION
90.02
MALES / 100 FEMALES
111.08
FEMALES / 100 MALES
51.0
MEDIAN AGE
3.0
AVG FAMILY SIZE
2.5
AVG HOUSEHOLD SIZE
12,509
LABOR FORCE [ PEOPLE ]
57.5%
PERCENT IN LABOR FORCE
6.0%
UNEMPLOYMENT RATE
Palm City Zip Codes
Palm City Area Codes
Income in Palm City
Income Overview in Palm City
Per Capita Income in Palm City is $62,234, while median incomes of families and households are $130,813 and $111,394 respectively.
| Characteristic | Number | Measure |
| Per Capita Income | 25,957 | $62,234 |
| Median Family Income | 7,506 | $130,813 |
| Mean Family Income | 7,506 | $171,954 |
| Median Household Income | 10,289 | $111,394 |
| Mean Household Income | 10,289 | $150,456 |
| Income Deficit | 7,506 | $0 |
| Wage / Income Gap (%) | 25,957 | 58.52% |
| Wage / Income Gap ($) | 25,957 | 41.48¢ per $1 |
| Gini / Inequality Index | 25,957 | 0.46 |
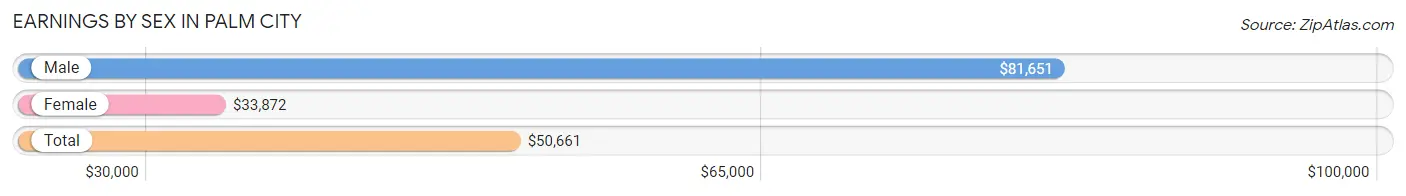
Earnings by Sex in Palm City
Average Earnings in Palm City are $50,661, $81,651 for men and $33,872 for women, a difference of 58.5%.
| Sex | Number | Average Earnings |
| Male | 6,925 (54.3%) | $81,651 |
| Female | 5,819 (45.7%) | $33,872 |
| Total | 12,744 (100.0%) | $50,661 |
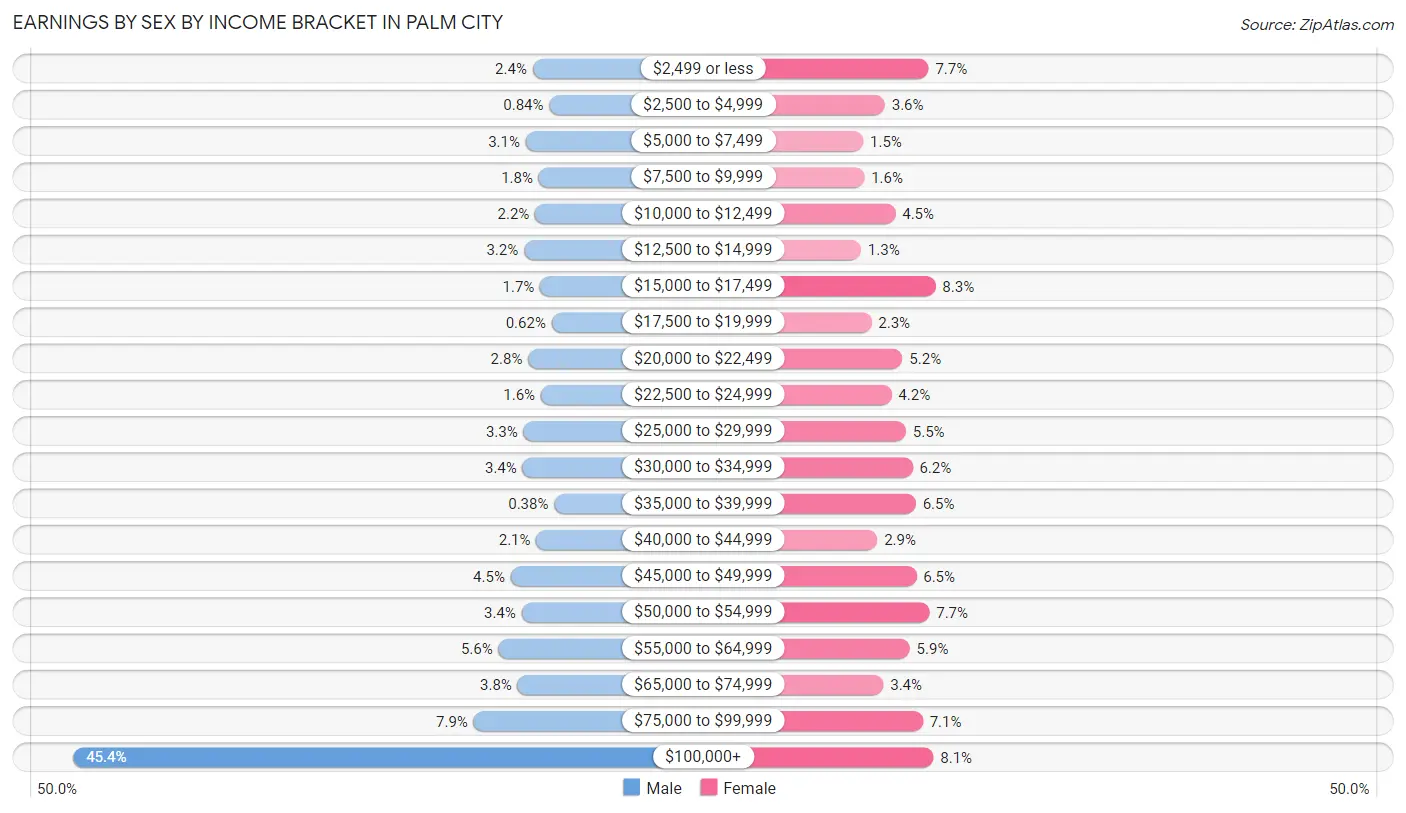
Earnings by Sex by Income Bracket in Palm City
The most common earnings brackets in Palm City are $100,000+ for men (3,147 | 45.4%) and $15,000 to $17,499 for women (483 | 8.3%).
| Income | Male | Female |
| $2,499 or less | 166 (2.4%) | 445 (7.6%) |
| $2,500 to $4,999 | 58 (0.8%) | 207 (3.6%) |
| $5,000 to $7,499 | 211 (3.0%) | 89 (1.5%) |
| $7,500 to $9,999 | 127 (1.8%) | 95 (1.6%) |
| $10,000 to $12,499 | 150 (2.2%) | 264 (4.5%) |
| $12,500 to $14,999 | 222 (3.2%) | 77 (1.3%) |
| $15,000 to $17,499 | 118 (1.7%) | 483 (8.3%) |
| $17,500 to $19,999 | 43 (0.6%) | 134 (2.3%) |
| $20,000 to $22,499 | 195 (2.8%) | 303 (5.2%) |
| $22,500 to $24,999 | 113 (1.6%) | 243 (4.2%) |
| $25,000 to $29,999 | 226 (3.3%) | 322 (5.5%) |
| $30,000 to $34,999 | 232 (3.4%) | 358 (6.1%) |
| $35,000 to $39,999 | 26 (0.4%) | 376 (6.5%) |
| $40,000 to $44,999 | 143 (2.1%) | 166 (2.9%) |
| $45,000 to $49,999 | 309 (4.5%) | 379 (6.5%) |
| $50,000 to $54,999 | 238 (3.4%) | 450 (7.7%) |
| $55,000 to $64,999 | 388 (5.6%) | 343 (5.9%) |
| $65,000 to $74,999 | 264 (3.8%) | 199 (3.4%) |
| $75,000 to $99,999 | 549 (7.9%) | 414 (7.1%) |
| $100,000+ | 3,147 (45.4%) | 472 (8.1%) |
| Total | 6,925 (100.0%) | 5,819 (100.0%) |
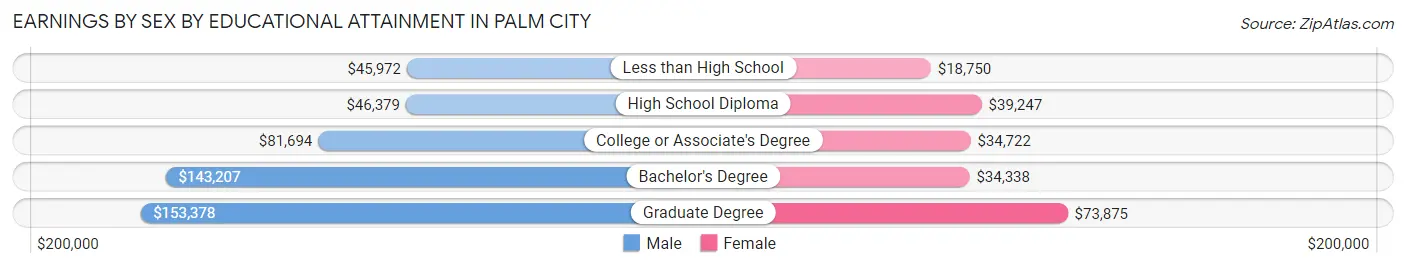
Earnings by Sex by Educational Attainment in Palm City
Average earnings in Palm City are $104,722 for men and $38,916 for women, a difference of 62.8%. Men with an educational attainment of graduate degree enjoy the highest average annual earnings of $153,378, while those with less than high school education earn the least with $45,972. Women with an educational attainment of graduate degree earn the most with the average annual earnings of $73,875, while those with less than high school education have the smallest earnings of $18,750.
| Educational Attainment | Male Income | Female Income |
| Less than High School | $45,972 | $18,750 |
| High School Diploma | $46,379 | $39,247 |
| College or Associate's Degree | $81,694 | $34,722 |
| Bachelor's Degree | $143,207 | $34,338 |
| Graduate Degree | $153,378 | $73,875 |
| Total | $104,722 | $38,916 |
Family Income in Palm City
Family Income Brackets in Palm City
According to the Palm City family income data, there are 1,869 families falling into the $200,000+ income range, which is the most common income bracket and makes up 24.9% of all families. Conversely, the less than $10,000 income bracket is the least frequent group with only 83 families (1.1%) belonging to this category.
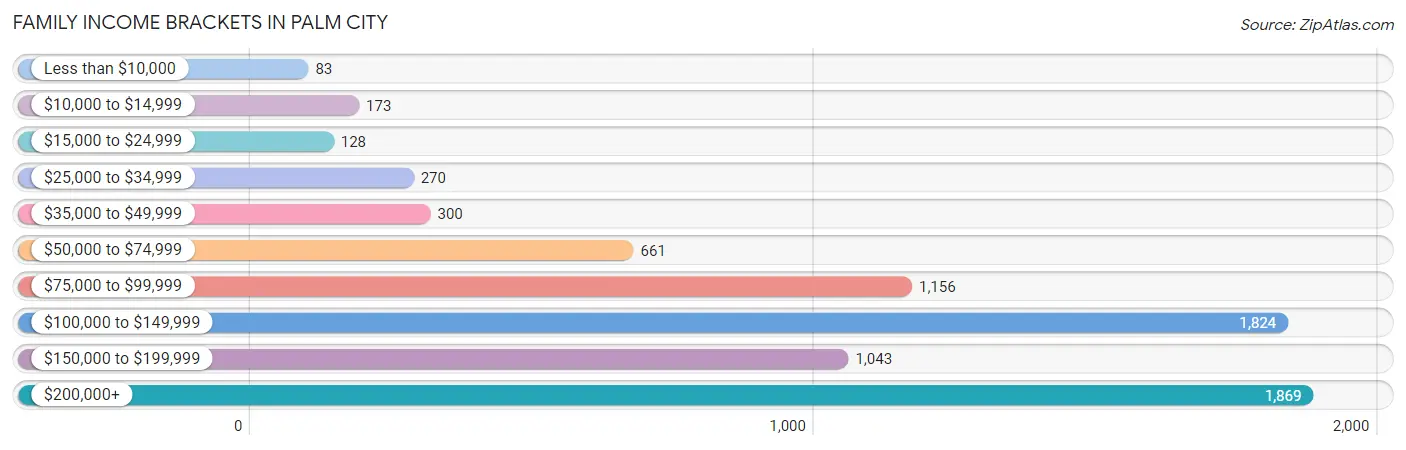
| Income Bracket | # Families | % Families |
| Less than $10,000 | 83 | 1.1% |
| $10,000 to $14,999 | 173 | 2.3% |
| $15,000 to $24,999 | 128 | 1.7% |
| $25,000 to $34,999 | 270 | 3.6% |
| $35,000 to $49,999 | 300 | 4.0% |
| $50,000 to $74,999 | 661 | 8.8% |
| $75,000 to $99,999 | 1,156 | 15.4% |
| $100,000 to $149,999 | 1,824 | 24.3% |
| $150,000 to $199,999 | 1,043 | 13.9% |
| $200,000+ | 1,869 | 24.9% |
Family Income by Famaliy Size in Palm City
6-person families (48 | 0.6%) account for the highest median family income in Palm City with $250,001 per family, while 2-person families (4,140 | 55.2%) have the highest median income of $57,608 per family member.
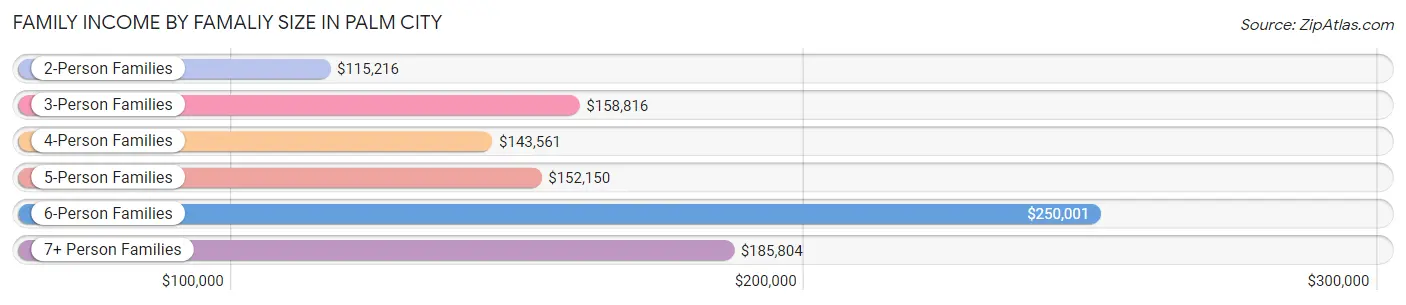
| Income Bracket | # Families | Median Income |
| 2-Person Families | 4,140 (55.2%) | $115,216 |
| 3-Person Families | 1,428 (19.0%) | $158,816 |
| 4-Person Families | 1,340 (17.8%) | $143,561 |
| 5-Person Families | 503 (6.7%) | $152,150 |
| 6-Person Families | 48 (0.6%) | $250,001 |
| 7+ Person Families | 47 (0.6%) | $185,804 |
| Total | 7,506 (100.0%) | $130,813 |
Family Income by Number of Earners in Palm City
The median family income in Palm City is $130,813, with families comprising 3+ earners (790) having the highest median family income of $188,537, while families with no earners (1,756) have the lowest median family income of $93,058, accounting for 10.5% and 23.4% of families, respectively.
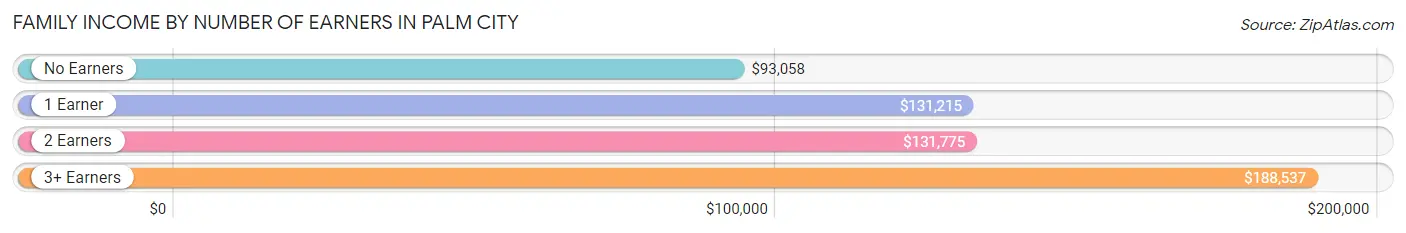
| Number of Earners | # Families | Median Income |
| No Earners | 1,756 (23.4%) | $93,058 |
| 1 Earner | 2,138 (28.5%) | $131,215 |
| 2 Earners | 2,822 (37.6%) | $131,775 |
| 3+ Earners | 790 (10.5%) | $188,537 |
| Total | 7,506 (100.0%) | $130,813 |
Household Income in Palm City
Household Income Brackets in Palm City
With 2,274 households falling in the category, the $100,000 to $149,999 income range is the most frequent in Palm City, accounting for 22.1% of all households. In contrast, only 134 households (1.3%) fall into the less than $10,000 income bracket, making it the least populous group.
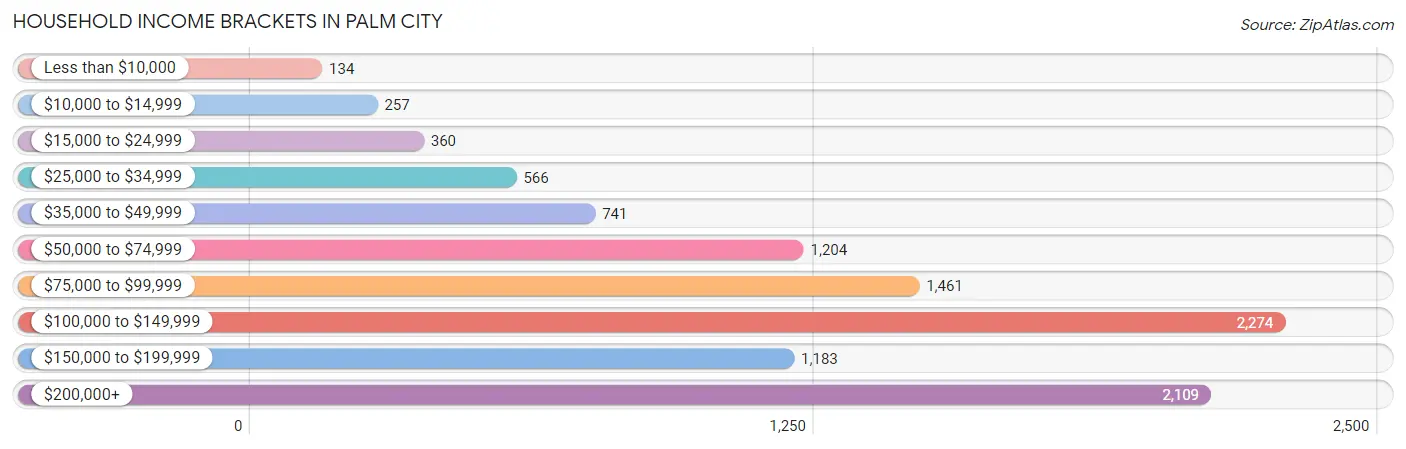
| Income Bracket | # Households | % Households |
| Less than $10,000 | 134 | 1.3% |
| $10,000 to $14,999 | 257 | 2.5% |
| $15,000 to $24,999 | 360 | 3.5% |
| $25,000 to $34,999 | 566 | 5.5% |
| $35,000 to $49,999 | 741 | 7.2% |
| $50,000 to $74,999 | 1,204 | 11.7% |
| $75,000 to $99,999 | 1,461 | 14.2% |
| $100,000 to $149,999 | 2,274 | 22.1% |
| $150,000 to $199,999 | 1,183 | 11.5% |
| $200,000+ | 2,109 | 20.5% |
Household Income by Householder Age in Palm City
The median household income in Palm City is $111,394, with the highest median household income of $148,094 found in the 45 to 64 years age bracket for the primary householder. A total of 3,739 households (36.3%) fall into this category. Meanwhile, the 15 to 24 years age bracket for the primary householder has the lowest median household income of $0, with 129 households (1.3%) in this group.
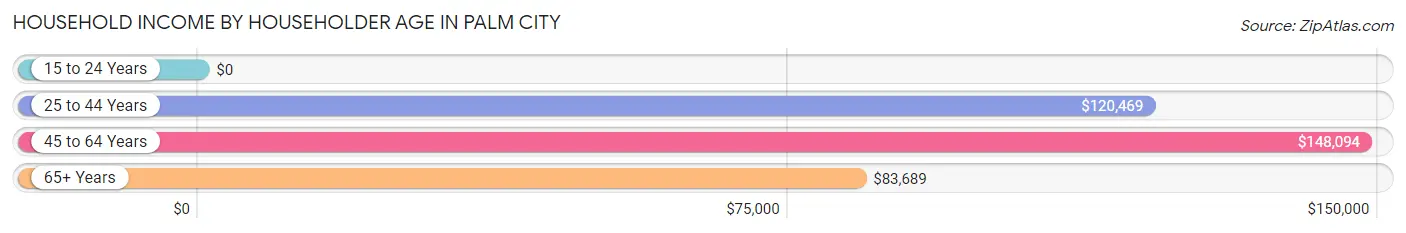
| Income Bracket | # Households | Median Income |
| 15 to 24 Years | 129 (1.3%) | $0 |
| 25 to 44 Years | 2,039 (19.8%) | $120,469 |
| 45 to 64 Years | 3,739 (36.3%) | $148,094 |
| 65+ Years | 4,382 (42.6%) | $83,689 |
| Total | 10,289 (100.0%) | $111,394 |
Poverty in Palm City
Income Below Poverty by Sex and Age in Palm City
With 5.7% poverty level for males and 3.9% for females among the residents of Palm City, 5 year old males and under 5 year old females are the most vulnerable to poverty, with 32 males (31.4%) and 39 females (8.6%) in their respective age groups living below the poverty level.
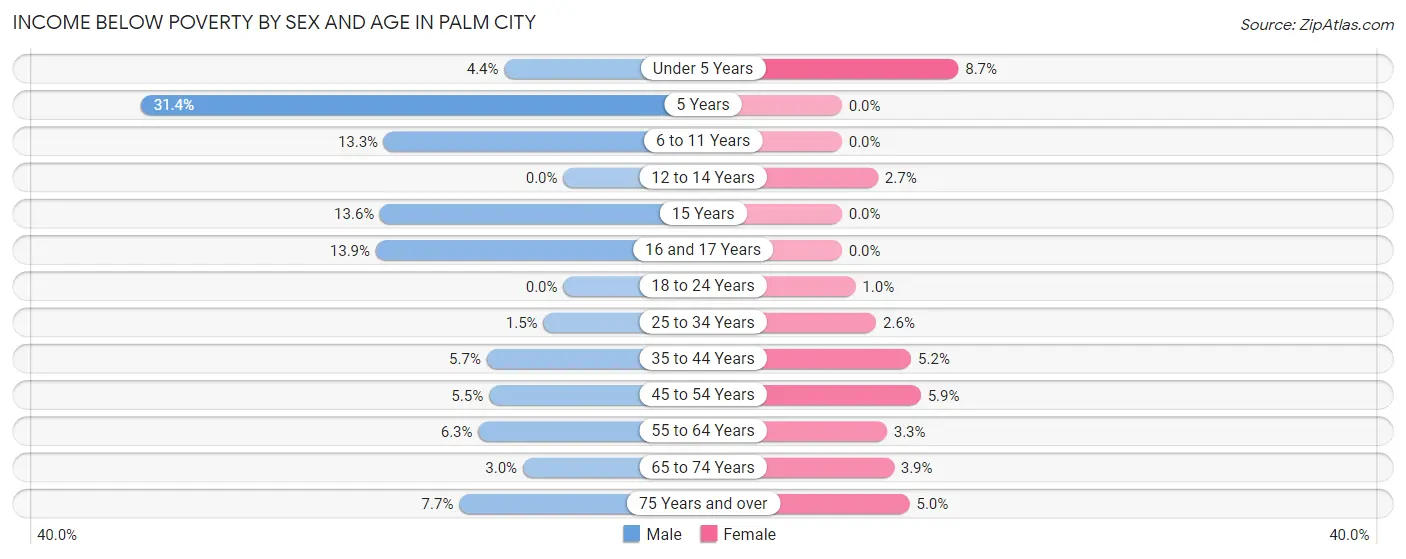
| Age Bracket | Male | Female |
| Under 5 Years | 18 (4.4%) | 39 (8.6%) |
| 5 Years | 32 (31.4%) | 0 (0.0%) |
| 6 to 11 Years | 97 (13.3%) | 0 (0.0%) |
| 12 to 14 Years | 0 (0.0%) | 15 (2.7%) |
| 15 Years | 37 (13.6%) | 0 (0.0%) |
| 16 and 17 Years | 27 (13.9%) | 0 (0.0%) |
| 18 to 24 Years | 0 (0.0%) | 9 (1.0%) |
| 25 to 34 Years | 8 (1.5%) | 19 (2.5%) |
| 35 to 44 Years | 75 (5.7%) | 97 (5.1%) |
| 45 to 54 Years | 102 (5.5%) | 106 (5.9%) |
| 55 to 64 Years | 129 (6.3%) | 58 (3.3%) |
| 65 to 74 Years | 49 (3.0%) | 66 (3.9%) |
| 75 Years and over | 130 (7.7%) | 119 (5.0%) |
| Total | 704 (5.7%) | 528 (3.9%) |
Income Above Poverty by Sex and Age in Palm City
According to the poverty statistics in Palm City, males aged 12 to 14 years and females aged 5 years are the age groups that are most secure financially, with 100.0% of males and 100.0% of females in these age groups living above the poverty line.
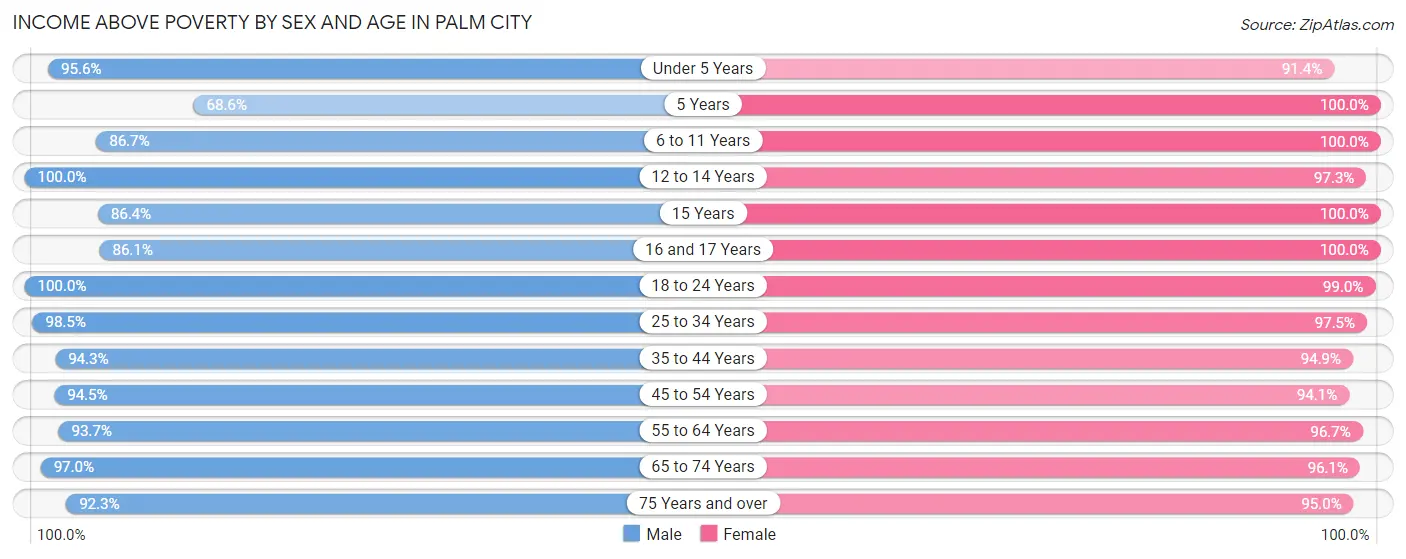
| Age Bracket | Male | Female |
| Under 5 Years | 393 (95.6%) | 412 (91.3%) |
| 5 Years | 70 (68.6%) | 234 (100.0%) |
| 6 to 11 Years | 631 (86.7%) | 753 (100.0%) |
| 12 to 14 Years | 527 (100.0%) | 544 (97.3%) |
| 15 Years | 235 (86.4%) | 148 (100.0%) |
| 16 and 17 Years | 167 (86.1%) | 192 (100.0%) |
| 18 to 24 Years | 966 (100.0%) | 883 (99.0%) |
| 25 to 34 Years | 533 (98.5%) | 727 (97.5%) |
| 35 to 44 Years | 1,242 (94.3%) | 1,788 (94.9%) |
| 45 to 54 Years | 1,746 (94.5%) | 1,704 (94.1%) |
| 55 to 64 Years | 1,914 (93.7%) | 1,678 (96.7%) |
| 65 to 74 Years | 1,583 (97.0%) | 1,644 (96.1%) |
| 75 Years and over | 1,551 (92.3%) | 2,247 (95.0%) |
| Total | 11,558 (94.3%) | 12,954 (96.1%) |
Income Below Poverty Among Married-Couple Families in Palm City
The poverty statistics for married-couple families in Palm City show that 2.8% or 187 of the total 6,690 families live below the poverty line. Families with 3 or 4 children have the highest poverty rate of 5.6%, comprising of 19 families. On the other hand, families with 1 or 2 children have the lowest poverty rate of 0.0%, which includes 0 families.
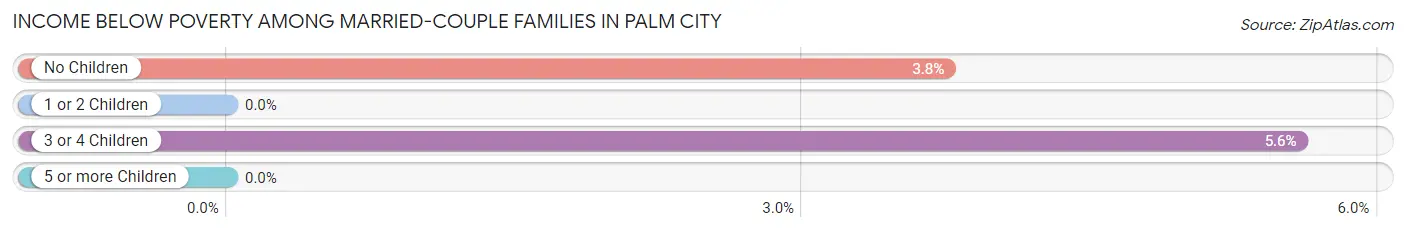
| Children | Above Poverty | Below Poverty |
| No Children | 4,307 (96.3%) | 168 (3.7%) |
| 1 or 2 Children | 1,861 (100.0%) | 0 (0.0%) |
| 3 or 4 Children | 321 (94.4%) | 19 (5.6%) |
| 5 or more Children | 14 (100.0%) | 0 (0.0%) |
| Total | 6,503 (97.2%) | 187 (2.8%) |
Income Below Poverty Among Single-Parent Households in Palm City
According to the poverty data in Palm City, 32.3% or 65 single-father households and 15.4% or 95 single-mother households are living below the poverty line. Among single-father households, those with no children have the highest poverty rate, with 65 households (36.9%) experiencing poverty. Likewise, among single-mother households, those with 3 or 4 children have the highest poverty rate, with 37 households (60.7%) falling below the poverty line.
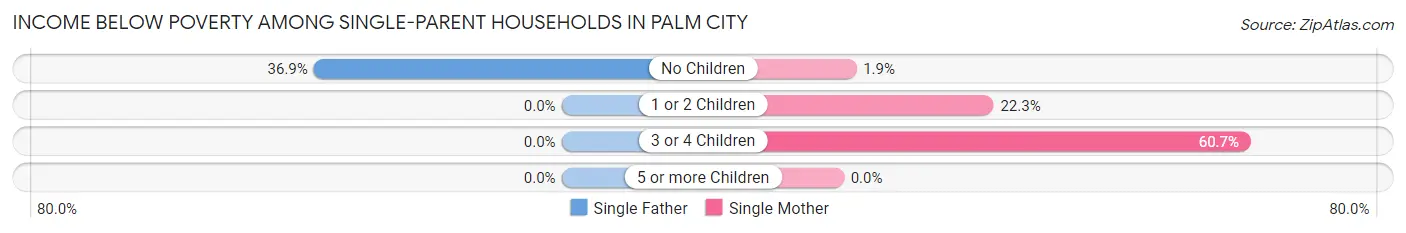
| Children | Single Father | Single Mother |
| No Children | 65 (36.9%) | 6 (1.9%) |
| 1 or 2 Children | 0 (0.0%) | 52 (22.3%) |
| 3 or 4 Children | 0 (0.0%) | 37 (60.7%) |
| 5 or more Children | 0 (0.0%) | 0 (0.0%) |
| Total | 65 (32.3%) | 95 (15.4%) |
Income Below Poverty Among Married-Couple vs Single-Parent Households in Palm City
The poverty data for Palm City shows that 187 of the married-couple family households (2.8%) and 160 of the single-parent households (19.6%) are living below the poverty level. Within the married-couple family households, those with 3 or 4 children have the highest poverty rate, with 19 households (5.6%) falling below the poverty line. Among the single-parent households, those with 3 or 4 children have the highest poverty rate, with 37 household (60.7%) living below poverty.
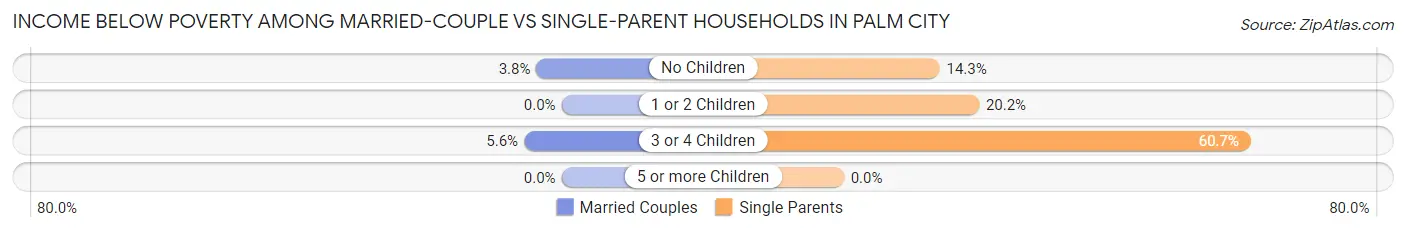
| Children | Married-Couple Families | Single-Parent Households |
| No Children | 168 (3.7%) | 71 (14.3%) |
| 1 or 2 Children | 0 (0.0%) | 52 (20.2%) |
| 3 or 4 Children | 19 (5.6%) | 37 (60.7%) |
| 5 or more Children | 0 (0.0%) | 0 (0.0%) |
| Total | 187 (2.8%) | 160 (19.6%) |
Race in Palm City
The most populous races in Palm City are White / Caucasian (22,773 | 87.7%), Hispanic or Latino (1,961 | 7.5%), and Two or more Races (1,582 | 6.1%).
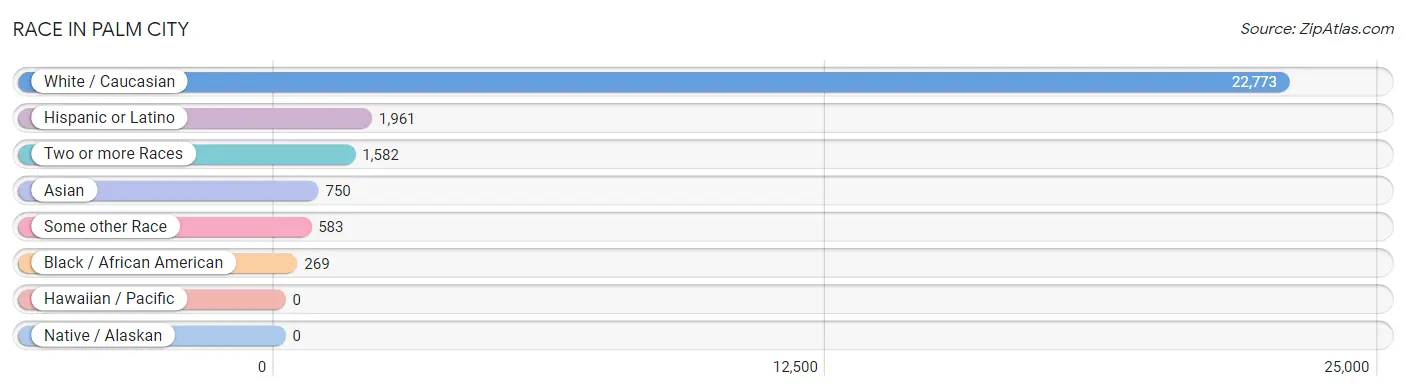
| Race | # Population | % Population |
| Asian | 750 | 2.9% |
| Black / African American | 269 | 1.0% |
| Hawaiian / Pacific | 0 | 0.0% |
| Hispanic or Latino | 1,961 | 7.5% |
| Native / Alaskan | 0 | 0.0% |
| White / Caucasian | 22,773 | 87.7% |
| Two or more Races | 1,582 | 6.1% |
| Some other Race | 583 | 2.2% |
| Total | 25,957 | 100.0% |
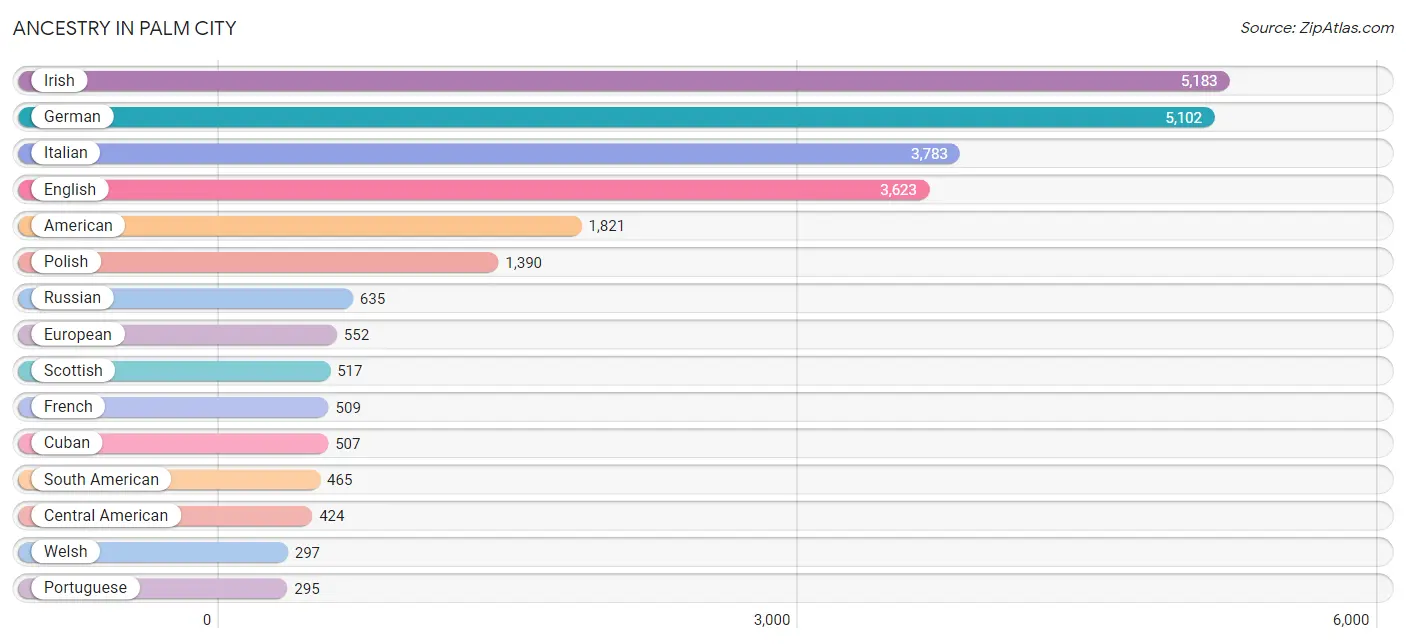
Ancestry in Palm City
The most populous ancestries reported in Palm City are Irish (5,183 | 20.0%), German (5,102 | 19.7%), Italian (3,783 | 14.6%), English (3,623 | 14.0%), and American (1,821 | 7.0%), together accounting for 75.2% of all Palm City residents.
| Ancestry | # Population | % Population |
| Albanian | 17 | 0.1% |
| American | 1,821 | 7.0% |
| Arab | 7 | 0.0% |
| Armenian | 103 | 0.4% |
| Austrian | 85 | 0.3% |
| Belgian | 45 | 0.2% |
| Bhutanese | 7 | 0.0% |
| Brazilian | 102 | 0.4% |
| British | 135 | 0.5% |
| Canadian | 50 | 0.2% |
| Celtic | 14 | 0.1% |
| Central American | 424 | 1.6% |
| Central American Indian | 20 | 0.1% |
| Cherokee | 37 | 0.1% |
| Colombian | 161 | 0.6% |
| Costa Rican | 71 | 0.3% |
| Croatian | 17 | 0.1% |
| Cuban | 507 | 1.9% |
| Czech | 56 | 0.2% |
| Czechoslovakian | 205 | 0.8% |
| Danish | 182 | 0.7% |
| Dutch | 220 | 0.9% |
| Eastern European | 142 | 0.5% |
| Ecuadorian | 113 | 0.4% |
| English | 3,623 | 14.0% |
| Estonian | 9 | 0.0% |
| European | 552 | 2.1% |
| Finnish | 70 | 0.3% |
| French | 509 | 2.0% |
| French Canadian | 230 | 0.9% |
| German | 5,102 | 19.7% |
| Greek | 197 | 0.8% |
| Guatemalan | 274 | 1.1% |
| Haitian | 40 | 0.2% |
| Hungarian | 70 | 0.3% |
| Icelander | 62 | 0.2% |
| Indian (Asian) | 181 | 0.7% |
| Iranian | 18 | 0.1% |
| Irish | 5,183 | 20.0% |
| Italian | 3,783 | 14.6% |
| Jamaican | 45 | 0.2% |
| Korean | 215 | 0.8% |
| Lebanese | 7 | 0.0% |
| Lithuanian | 70 | 0.3% |
| Luxembourger | 19 | 0.1% |
| Mexican | 185 | 0.7% |
| Nigerian | 27 | 0.1% |
| Northern European | 89 | 0.3% |
| Norwegian | 264 | 1.0% |
| Pakistani | 36 | 0.1% |
| Panamanian | 42 | 0.2% |
| Polish | 1,390 | 5.4% |
| Portuguese | 295 | 1.1% |
| Puerto Rican | 153 | 0.6% |
| Romanian | 28 | 0.1% |
| Russian | 635 | 2.5% |
| Salvadoran | 37 | 0.1% |
| Scandinavian | 31 | 0.1% |
| Scotch-Irish | 260 | 1.0% |
| Scottish | 517 | 2.0% |
| Sioux | 11 | 0.0% |
| Slavic | 22 | 0.1% |
| Slovak | 91 | 0.4% |
| South American | 465 | 1.8% |
| Spanish | 111 | 0.4% |
| Sri Lankan | 236 | 0.9% |
| Subsaharan African | 27 | 0.1% |
| Swedish | 241 | 0.9% |
| Swiss | 115 | 0.4% |
| Thai | 257 | 1.0% |
| Turkish | 24 | 0.1% |
| U.S. Virgin Islander | 9 | 0.0% |
| Ukrainian | 227 | 0.9% |
| Uruguayan | 172 | 0.7% |
| Venezuelan | 19 | 0.1% |
| Welsh | 297 | 1.1% |
| West Indian | 16 | 0.1% | View All 77 Rows |
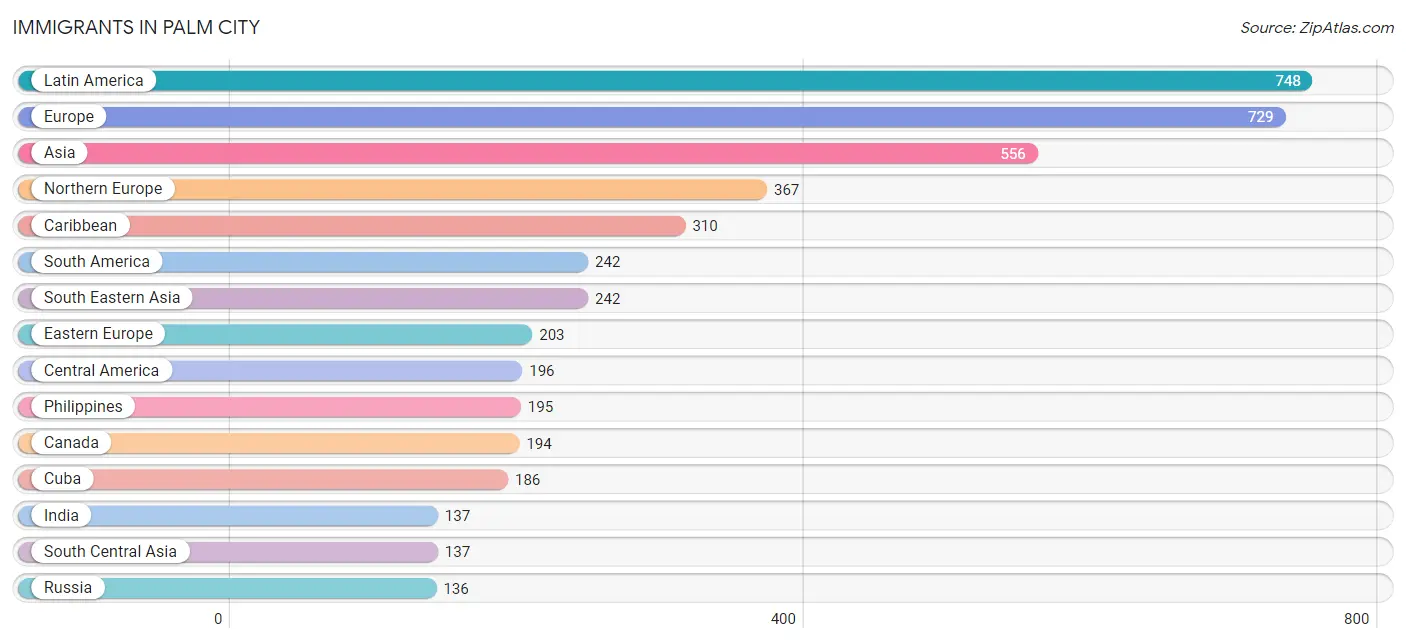
Immigrants in Palm City
The most numerous immigrant groups reported in Palm City came from Latin America (748 | 2.9%), Europe (729 | 2.8%), Asia (556 | 2.1%), Northern Europe (367 | 1.4%), and Caribbean (310 | 1.2%), together accounting for 10.4% of all Palm City residents.
| Immigration Origin | # Population | % Population |
| Africa | 49 | 0.2% |
| Asia | 556 | 2.1% |
| Belgium | 45 | 0.2% |
| Brazil | 76 | 0.3% |
| Canada | 194 | 0.7% |
| Caribbean | 310 | 1.2% |
| Central America | 196 | 0.8% |
| China | 131 | 0.5% |
| Colombia | 87 | 0.3% |
| Costa Rica | 71 | 0.3% |
| Cuba | 186 | 0.7% |
| Czechoslovakia | 16 | 0.1% |
| Denmark | 24 | 0.1% |
| Dominican Republic | 41 | 0.2% |
| Eastern Asia | 131 | 0.5% |
| Eastern Europe | 203 | 0.8% |
| Ecuador | 28 | 0.1% |
| El Salvador | 14 | 0.1% |
| England | 67 | 0.3% |
| Europe | 729 | 2.8% |
| France | 16 | 0.1% |
| Germany | 43 | 0.2% |
| Guatemala | 91 | 0.4% |
| Hong Kong | 62 | 0.2% |
| India | 137 | 0.5% |
| Ireland | 115 | 0.4% |
| Israel | 46 | 0.2% |
| Italy | 45 | 0.2% |
| Latin America | 748 | 2.9% |
| Latvia | 22 | 0.1% |
| Nigeria | 19 | 0.1% |
| Northern Europe | 367 | 1.4% |
| Panama | 20 | 0.1% |
| Philippines | 195 | 0.7% |
| Poland | 29 | 0.1% |
| Russia | 136 | 0.5% |
| Scotland | 33 | 0.1% |
| South Africa | 30 | 0.1% |
| South America | 242 | 0.9% |
| South Central Asia | 137 | 0.5% |
| South Eastern Asia | 242 | 0.9% |
| Southern Europe | 45 | 0.2% |
| Sweden | 17 | 0.1% |
| Switzerland | 10 | 0.0% |
| Thailand | 36 | 0.1% |
| Trinidad and Tobago | 34 | 0.1% |
| Uruguay | 51 | 0.2% |
| Vietnam | 11 | 0.0% |
| Western Africa | 19 | 0.1% |
| Western Asia | 46 | 0.2% |
| Western Europe | 114 | 0.4% | View All 51 Rows |
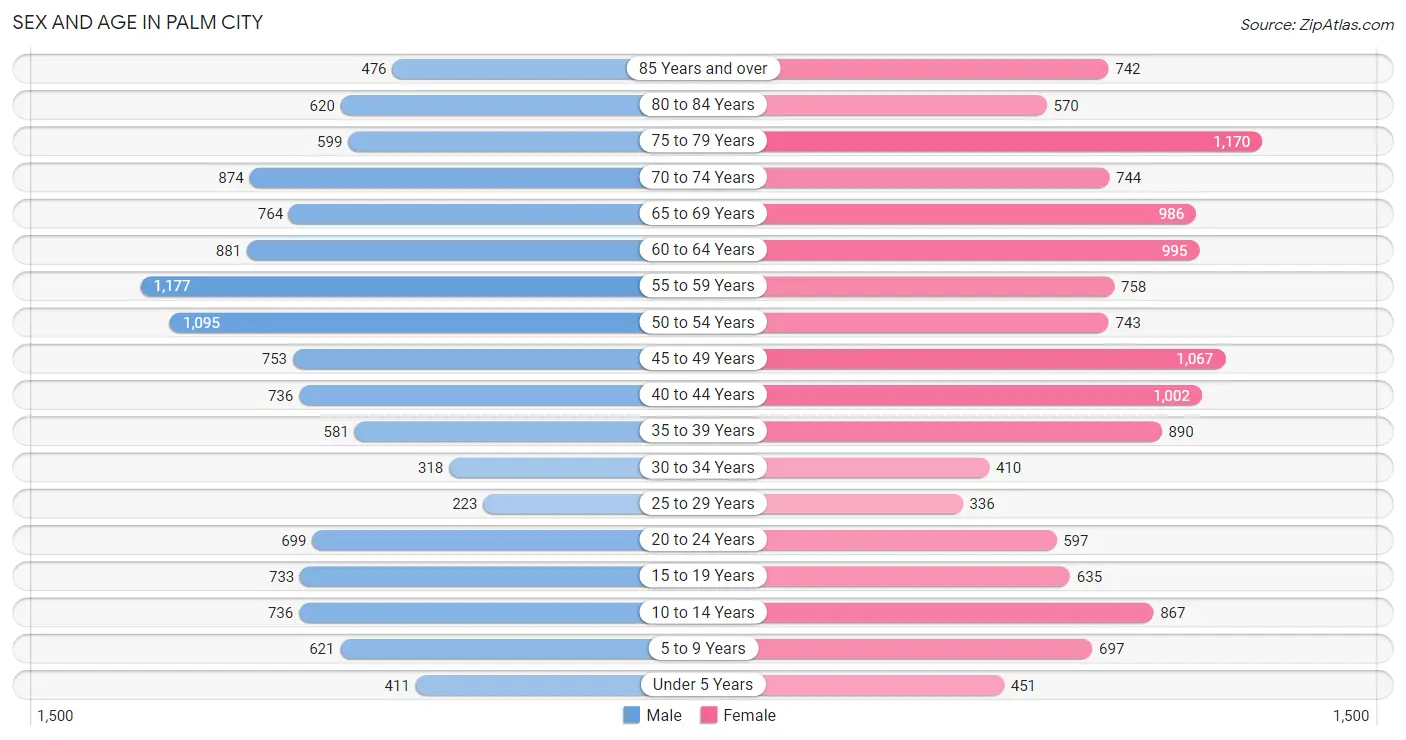
Sex and Age in Palm City
Sex and Age in Palm City
The most populous age groups in Palm City are 55 to 59 Years (1,177 | 9.6%) for men and 75 to 79 Years (1,170 | 8.6%) for women.
| Age Bracket | Male | Female |
| Under 5 Years | 411 (3.3%) | 451 (3.3%) |
| 5 to 9 Years | 621 (5.1%) | 697 (5.1%) |
| 10 to 14 Years | 736 (6.0%) | 867 (6.4%) |
| 15 to 19 Years | 733 (6.0%) | 635 (4.6%) |
| 20 to 24 Years | 699 (5.7%) | 597 (4.4%) |
| 25 to 29 Years | 223 (1.8%) | 336 (2.5%) |
| 30 to 34 Years | 318 (2.6%) | 410 (3.0%) |
| 35 to 39 Years | 581 (4.7%) | 890 (6.5%) |
| 40 to 44 Years | 736 (6.0%) | 1,002 (7.3%) |
| 45 to 49 Years | 753 (6.1%) | 1,067 (7.8%) |
| 50 to 54 Years | 1,095 (8.9%) | 743 (5.4%) |
| 55 to 59 Years | 1,177 (9.6%) | 758 (5.6%) |
| 60 to 64 Years | 881 (7.2%) | 995 (7.3%) |
| 65 to 69 Years | 764 (6.2%) | 986 (7.2%) |
| 70 to 74 Years | 874 (7.1%) | 744 (5.4%) |
| 75 to 79 Years | 599 (4.9%) | 1,170 (8.6%) |
| 80 to 84 Years | 620 (5.0%) | 570 (4.2%) |
| 85 Years and over | 476 (3.9%) | 742 (5.4%) |
| Total | 12,297 (100.0%) | 13,660 (100.0%) |
Families and Households in Palm City
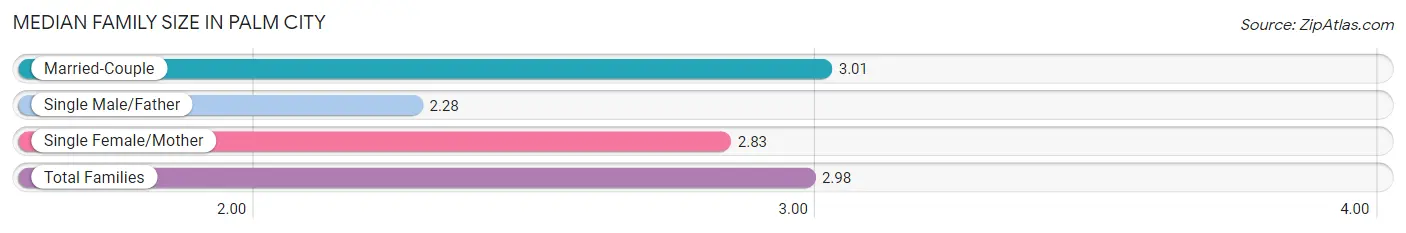
Median Family Size in Palm City
The median family size in Palm City is 2.98 persons per family, with married-couple families (6,690 | 89.1%) accounting for the largest median family size of 3.01 persons per family. On the other hand, single male/father families (201 | 2.7%) represent the smallest median family size with 2.28 persons per family.
| Family Type | # Families | Family Size |
| Married-Couple | 6,690 (89.1%) | 3.01 |
| Single Male/Father | 201 (2.7%) | 2.28 |
| Single Female/Mother | 615 (8.2%) | 2.83 |
| Total Families | 7,506 (100.0%) | 2.98 |
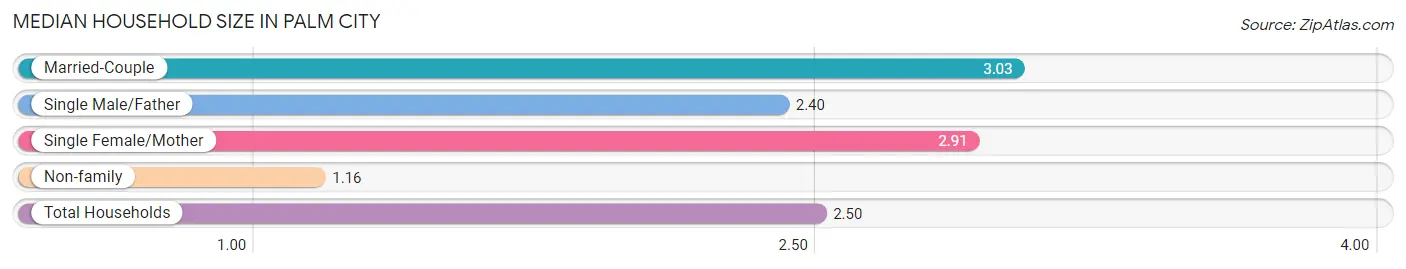
Median Household Size in Palm City
The median household size in Palm City is 2.50 persons per household, with married-couple households (6,690 | 65.0%) accounting for the largest median household size of 3.03 persons per household. non-family households (2,783 | 27.1%) represent the smallest median household size with 1.16 persons per household.
| Household Type | # Households | Household Size |
| Married-Couple | 6,690 (65.0%) | 3.03 |
| Single Male/Father | 201 (1.9%) | 2.40 |
| Single Female/Mother | 615 (6.0%) | 2.91 |
| Non-family | 2,783 (27.1%) | 1.16 |
| Total Households | 10,289 (100.0%) | 2.50 |
Household Size by Marriage Status in Palm City
Out of a total of 10,289 households in Palm City, 7,506 (73.0%) are family households, while 2,783 (27.1%) are nonfamily households. The most numerous type of family households are 2-person households, comprising 4,115, and the most common type of nonfamily households are 1-person households, comprising 2,457.
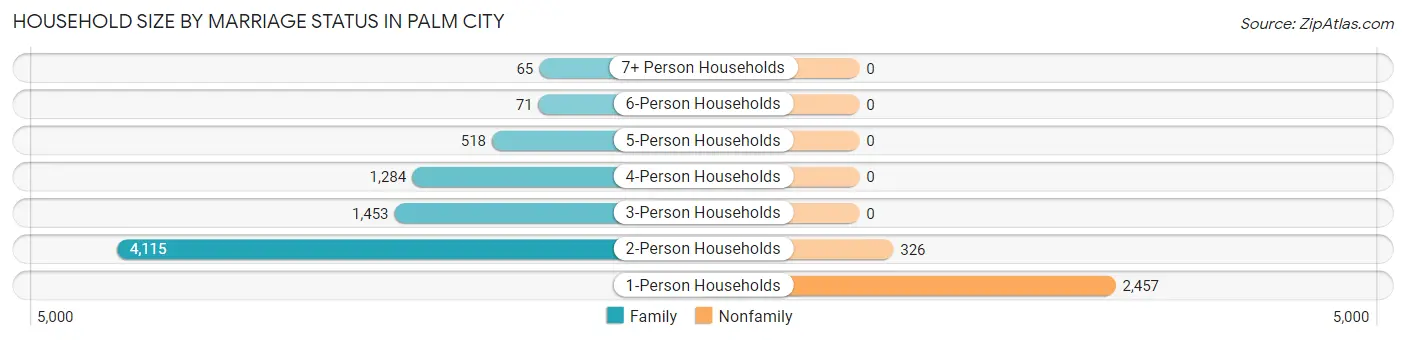
| Household Size | Family Households | Nonfamily Households |
| 1-Person Households | - | 2,457 (23.9%) |
| 2-Person Households | 4,115 (40.0%) | 326 (3.2%) |
| 3-Person Households | 1,453 (14.1%) | 0 (0.0%) |
| 4-Person Households | 1,284 (12.5%) | 0 (0.0%) |
| 5-Person Households | 518 (5.0%) | 0 (0.0%) |
| 6-Person Households | 71 (0.7%) | 0 (0.0%) |
| 7+ Person Households | 65 (0.6%) | 0 (0.0%) |
| Total | 7,506 (73.0%) | 2,783 (27.1%) |
Female Fertility in Palm City
Fertility by Age in Palm City
Average fertility rate in Palm City is 49.0 births per 1,000 women. Women in the age bracket of 20 to 34 years have the highest fertility rate with 145.0 births per 1,000 women. Women in the age bracket of 20 to 34 years acount for 79.3% of all women with births.
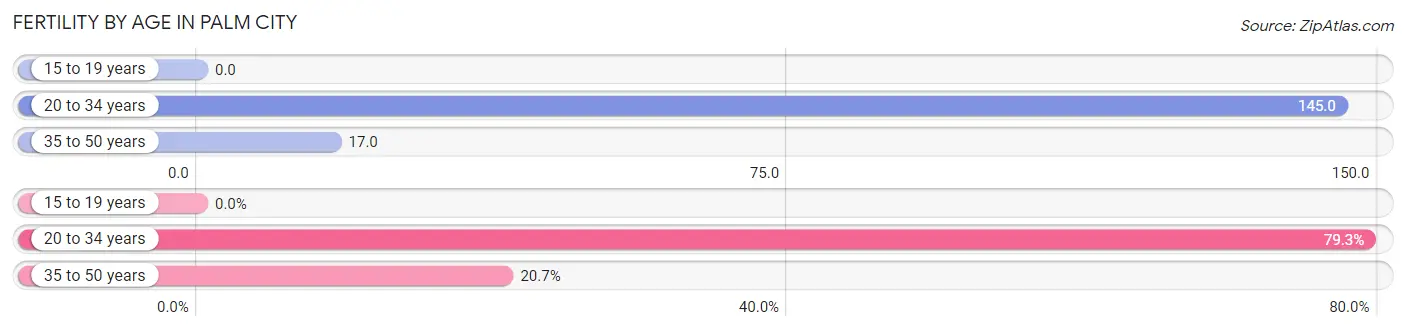
| Age Bracket | Women with Births | Births / 1,000 Women |
| 15 to 19 years | 0 (0.0%) | 0.0 |
| 20 to 34 years | 195 (79.3%) | 145.0 |
| 35 to 50 years | 51 (20.7%) | 17.0 |
| Total | 246 (100.0%) | 49.0 |
Fertility by Age by Marriage Status in Palm City
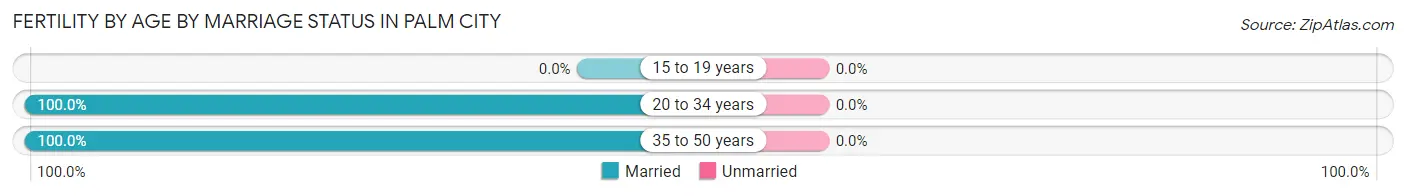
| Age Bracket | Married | Unmarried |
| 15 to 19 years | 0 (0.0%) | 0 (0.0%) |
| 20 to 34 years | 195 (100.0%) | 0 (0.0%) |
| 35 to 50 years | 51 (100.0%) | 0 (0.0%) |
| Total | 246 (100.0%) | 0 (0.0%) |
Fertility by Education in Palm City
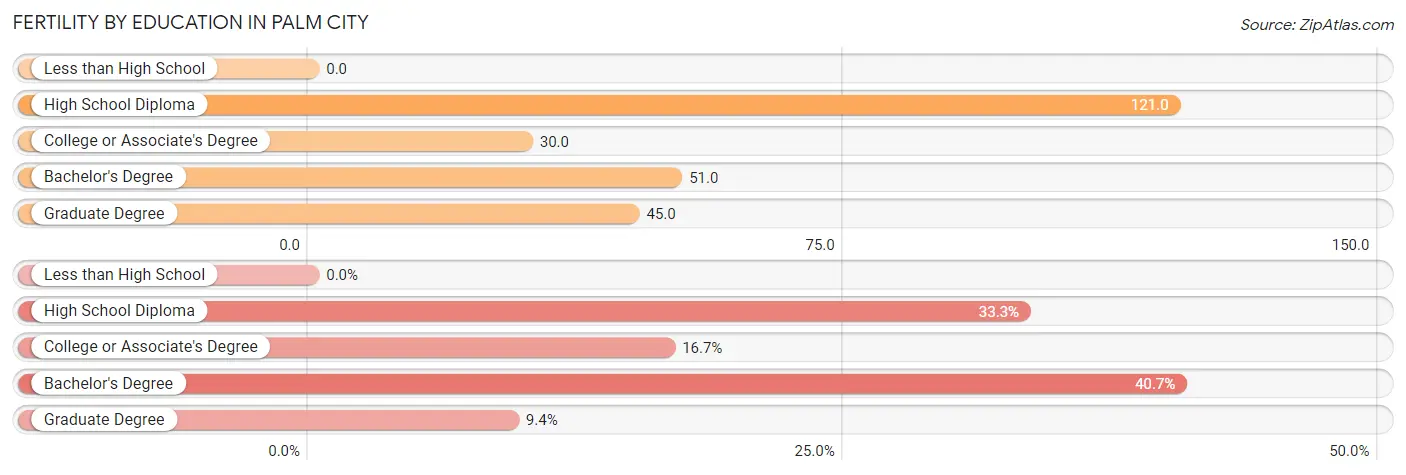
| Educational Attainment | Women with Births | Births / 1,000 Women |
| Less than High School | 0 (0.0%) | 0.0 |
| High School Diploma | 82 (33.3%) | 121.0 |
| College or Associate's Degree | 41 (16.7%) | 30.0 |
| Bachelor's Degree | 100 (40.6%) | 51.0 |
| Graduate Degree | 23 (9.3%) | 45.0 |
| Total | 246 (100.0%) | 49.0 |
Fertility by Education by Marriage Status in Palm City
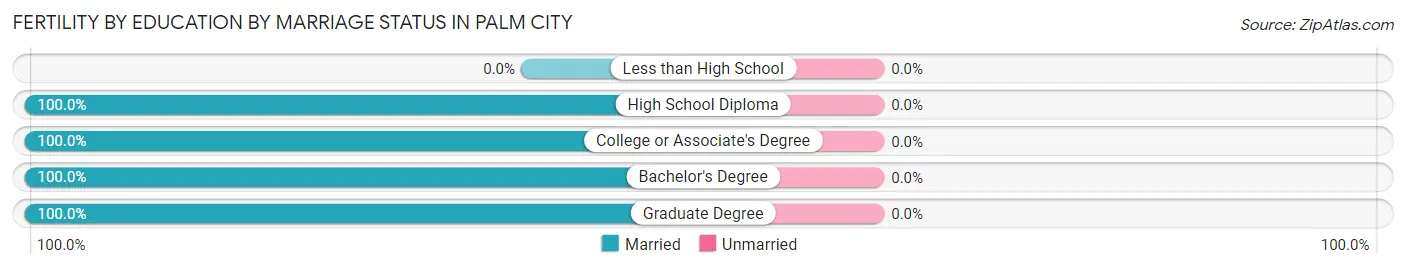
| Educational Attainment | Married | Unmarried |
| Less than High School | 0 (0.0%) | 0 (0.0%) |
| High School Diploma | 82 (100.0%) | 0 (0.0%) |
| College or Associate's Degree | 41 (100.0%) | 0 (0.0%) |
| Bachelor's Degree | 100 (100.0%) | 0 (0.0%) |
| Graduate Degree | 23 (100.0%) | 0 (0.0%) |
| Total | 246 (100.0%) | 0 (0.0%) |
Employment Characteristics in Palm City
Employment by Class of Employer in Palm City
Among the 11,366 employed individuals in Palm City, private company employees (7,714 | 67.9%), local government employees (1,179 | 10.4%), and self-employed (incorporated) (973 | 8.6%) make up the most common classes of employment.
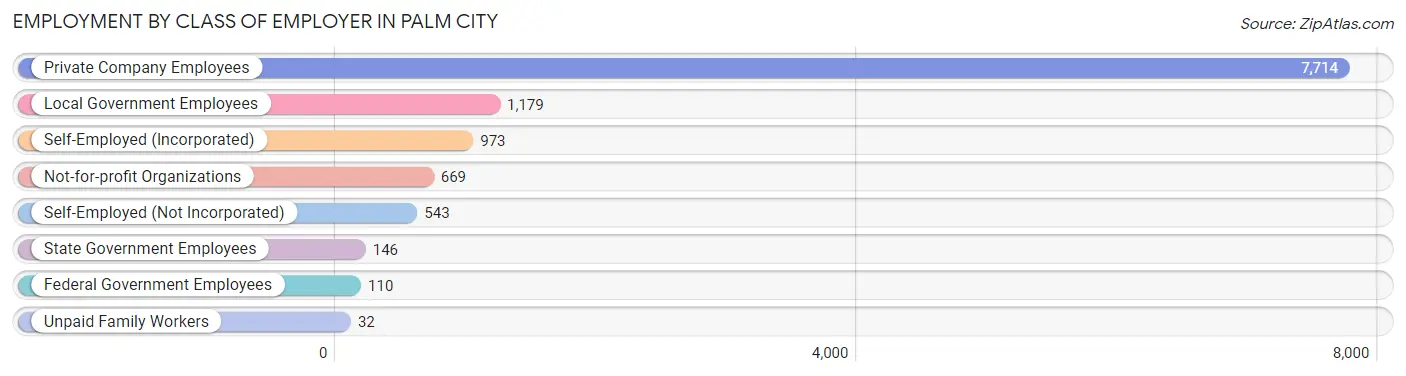
| Employer Class | # Employees | % Employees |
| Private Company Employees | 7,714 | 67.9% |
| Self-Employed (Incorporated) | 973 | 8.6% |
| Self-Employed (Not Incorporated) | 543 | 4.8% |
| Not-for-profit Organizations | 669 | 5.9% |
| Local Government Employees | 1,179 | 10.4% |
| State Government Employees | 146 | 1.3% |
| Federal Government Employees | 110 | 1.0% |
| Unpaid Family Workers | 32 | 0.3% |
| Total | 11,366 | 100.0% |
Employment Status by Age in Palm City
According to the labor force statistics for Palm City, out of the total population over 16 years of age (21,754), 57.5% or 12,509 individuals are in the labor force, with 6.0% or 751 of them unemployed. The age group with the highest labor force participation rate is 25 to 29 years, with 86.4% or 483 individuals in the labor force. Within the labor force, the 16 to 19 years age range has the highest percentage of unemployed individuals, with 16.4% or 86 of them being unemployed.
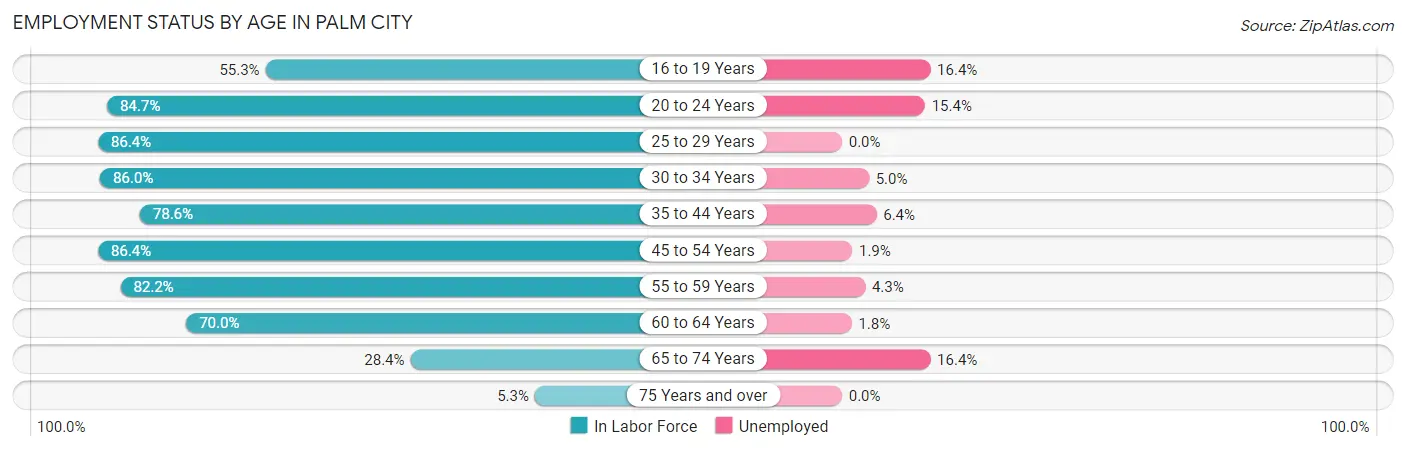
| Age Bracket | In Labor Force | Unemployed |
| 16 to 19 Years | 524 (55.3%) | 86 (16.4%) |
| 20 to 24 Years | 1,098 (84.7%) | 169 (15.4%) |
| 25 to 29 Years | 483 (86.4%) | 0 (0.0%) |
| 30 to 34 Years | 626 (86.0%) | 31 (5.0%) |
| 35 to 44 Years | 2,522 (78.6%) | 161 (6.4%) |
| 45 to 54 Years | 3,161 (86.4%) | 60 (1.9%) |
| 55 to 59 Years | 1,591 (82.2%) | 68 (4.3%) |
| 60 to 64 Years | 1,313 (70.0%) | 24 (1.8%) |
| 65 to 74 Years | 957 (28.4%) | 157 (16.4%) |
| 75 Years and over | 221 (5.3%) | 0 (0.0%) |
| Total | 12,509 (57.5%) | 751 (6.0%) |
Employment Status by Educational Attainment in Palm City
According to labor force statistics for Palm City, 81.1% of individuals (9,704) out of the total population between 25 and 64 years of age (11,965) are in the labor force, with 3.5% or 340 of them being unemployed. The group with the highest labor force participation rate are those with the educational attainment of college / associate degree, with 83.9% or 3,211 individuals in the labor force. Within the labor force, individuals with high school diploma education have the highest percentage of unemployment, with 9.7% or 134 of them being unemployed.
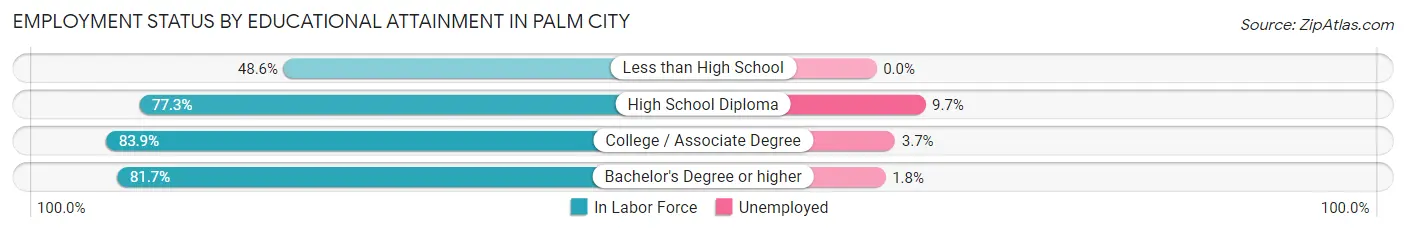
| Educational Attainment | In Labor Force | Unemployed |
| Less than High School | 120 (48.6%) | 0 (0.0%) |
| High School Diploma | 1,384 (77.3%) | 174 (9.7%) |
| College / Associate Degree | 3,211 (83.9%) | 142 (3.7%) |
| Bachelor's Degree or higher | 4,984 (81.7%) | 110 (1.8%) |
| Total | 9,704 (81.1%) | 419 (3.5%) |
Employment Occupations by Sex in Palm City
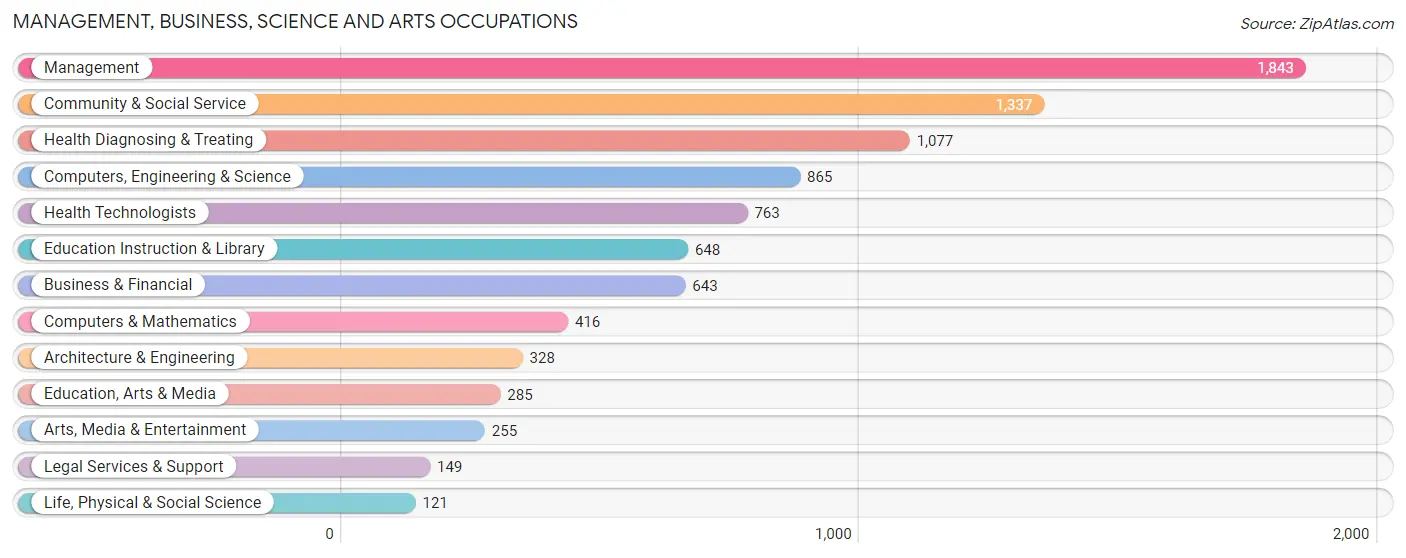
Management, Business, Science and Arts Occupations
The most common Management, Business, Science and Arts occupations in Palm City are Management (1,843 | 15.7%), Community & Social Service (1,337 | 11.4%), Health Diagnosing & Treating (1,077 | 9.2%), Computers, Engineering & Science (865 | 7.4%), and Health Technologists (763 | 6.5%).
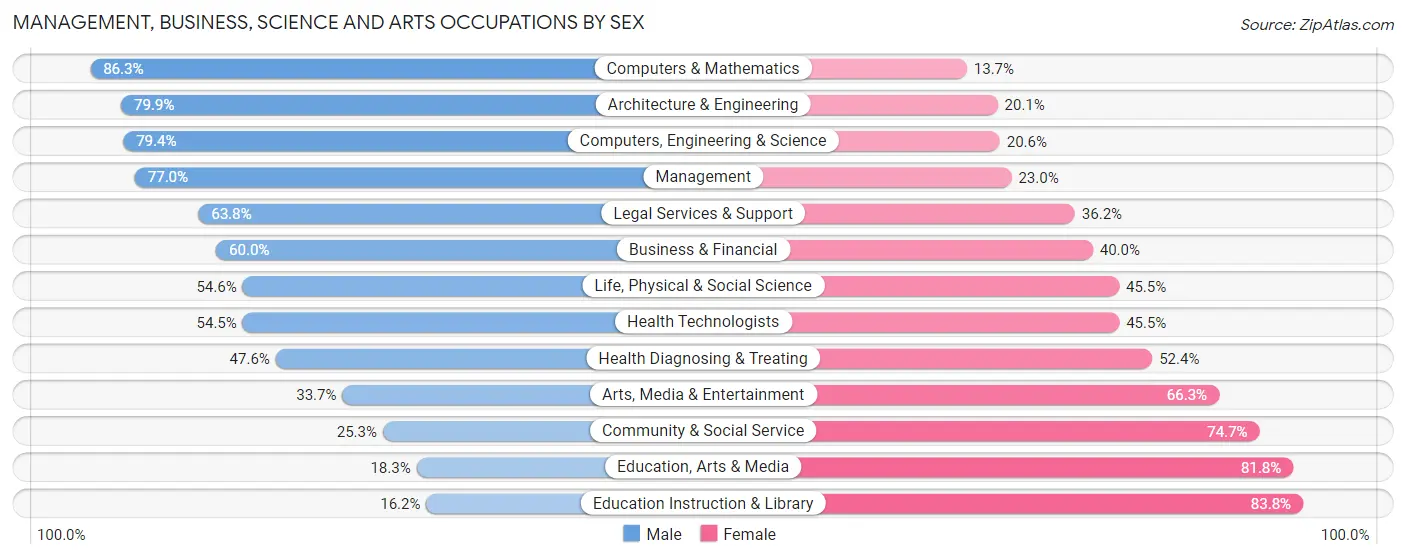
Management, Business, Science and Arts Occupations by Sex
Within the Management, Business, Science and Arts occupations in Palm City, the most male-oriented occupations are Computers & Mathematics (86.3%), Architecture & Engineering (79.9%), and Computers, Engineering & Science (79.4%), while the most female-oriented occupations are Education Instruction & Library (83.8%), Education, Arts & Media (81.8%), and Community & Social Service (74.7%).
| Occupation | Male | Female |
| Management | 1,419 (77.0%) | 424 (23.0%) |
| Business & Financial | 386 (60.0%) | 257 (40.0%) |
| Computers, Engineering & Science | 687 (79.4%) | 178 (20.6%) |
| Computers & Mathematics | 359 (86.3%) | 57 (13.7%) |
| Architecture & Engineering | 262 (79.9%) | 66 (20.1%) |
| Life, Physical & Social Science | 66 (54.5%) | 55 (45.5%) |
| Community & Social Service | 338 (25.3%) | 999 (74.7%) |
| Education, Arts & Media | 52 (18.2%) | 233 (81.8%) |
| Legal Services & Support | 95 (63.8%) | 54 (36.2%) |
| Education Instruction & Library | 105 (16.2%) | 543 (83.8%) |
| Arts, Media & Entertainment | 86 (33.7%) | 169 (66.3%) |
| Health Diagnosing & Treating | 513 (47.6%) | 564 (52.4%) |
| Health Technologists | 416 (54.5%) | 347 (45.5%) |
| Total (Category) | 3,343 (58.0%) | 2,422 (42.0%) |
| Total (Overall) | 6,551 (55.8%) | 5,193 (44.2%) |
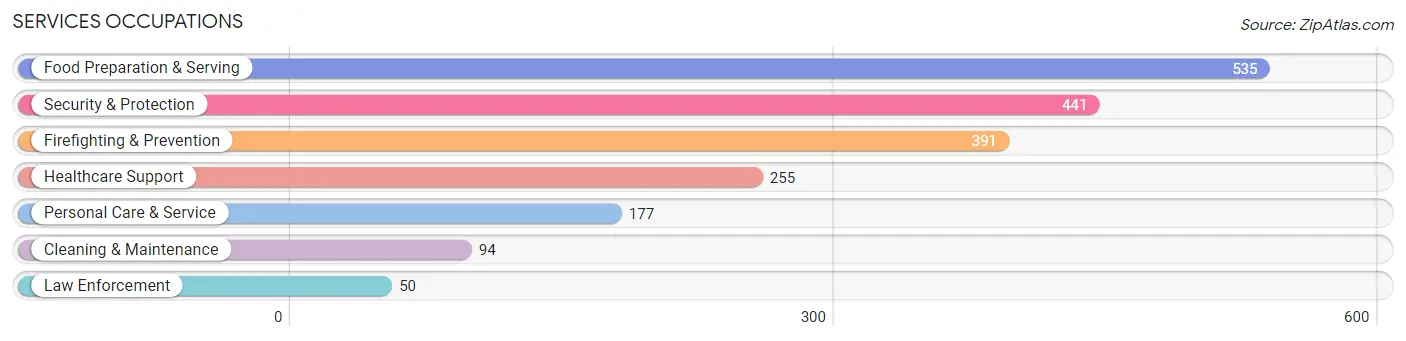
Services Occupations
The most common Services occupations in Palm City are Food Preparation & Serving (535 | 4.6%), Security & Protection (441 | 3.8%), Firefighting & Prevention (391 | 3.3%), Healthcare Support (255 | 2.2%), and Personal Care & Service (177 | 1.5%).
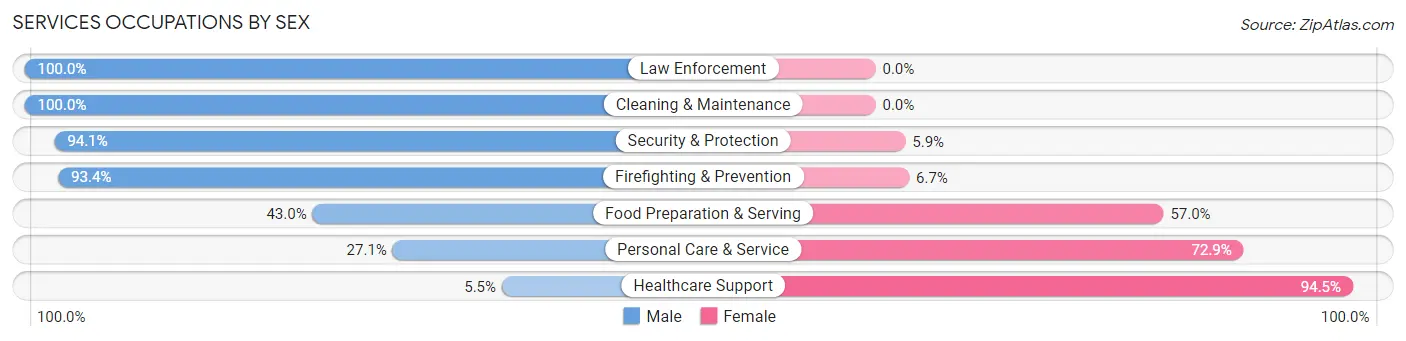
Services Occupations by Sex
Within the Services occupations in Palm City, the most male-oriented occupations are Law Enforcement (100.0%), Cleaning & Maintenance (100.0%), and Security & Protection (94.1%), while the most female-oriented occupations are Healthcare Support (94.5%), Personal Care & Service (72.9%), and Food Preparation & Serving (57.0%).
| Occupation | Male | Female |
| Healthcare Support | 14 (5.5%) | 241 (94.5%) |
| Security & Protection | 415 (94.1%) | 26 (5.9%) |
| Firefighting & Prevention | 365 (93.3%) | 26 (6.7%) |
| Law Enforcement | 50 (100.0%) | 0 (0.0%) |
| Food Preparation & Serving | 230 (43.0%) | 305 (57.0%) |
| Cleaning & Maintenance | 94 (100.0%) | 0 (0.0%) |
| Personal Care & Service | 48 (27.1%) | 129 (72.9%) |
| Total (Category) | 801 (53.3%) | 701 (46.7%) |
| Total (Overall) | 6,551 (55.8%) | 5,193 (44.2%) |
Sales and Office Occupations
The most common Sales and Office occupations in Palm City are Sales & Related (1,981 | 16.9%), and Office & Administration (1,154 | 9.8%).
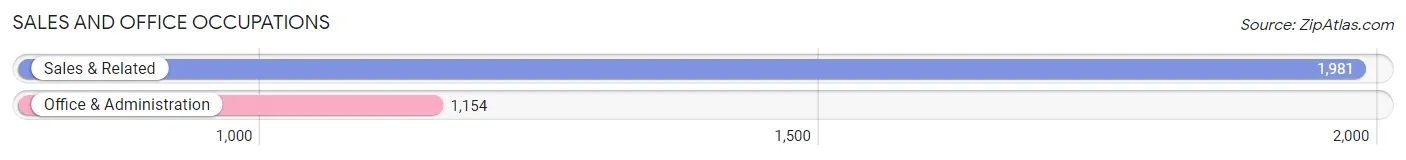
Sales and Office Occupations by Sex
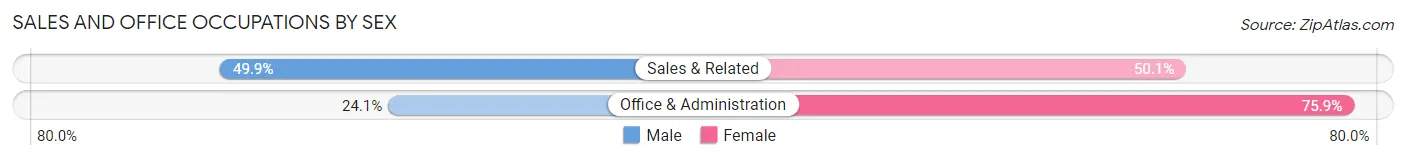
| Occupation | Male | Female |
| Sales & Related | 989 (49.9%) | 992 (50.1%) |
| Office & Administration | 278 (24.1%) | 876 (75.9%) |
| Total (Category) | 1,267 (40.4%) | 1,868 (59.6%) |
| Total (Overall) | 6,551 (55.8%) | 5,193 (44.2%) |
Natural Resources, Construction and Maintenance Occupations
The most common Natural Resources, Construction and Maintenance occupations in Palm City are Installation, Maintenance & Repair (352 | 3.0%), and Construction & Extraction (249 | 2.1%).
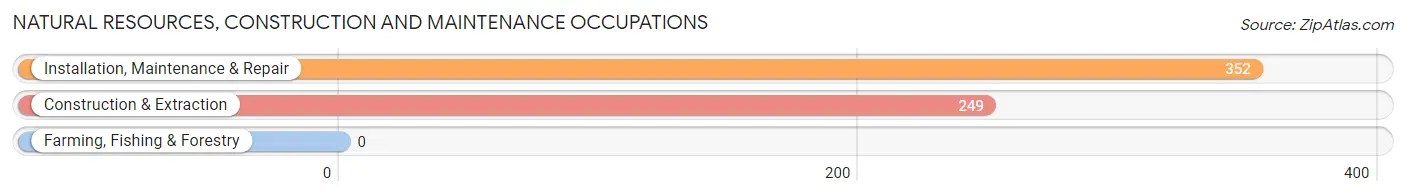
Natural Resources, Construction and Maintenance Occupations by Sex
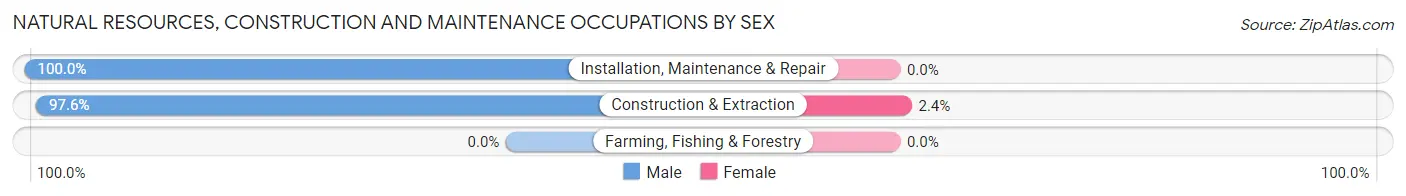
| Occupation | Male | Female |
| Farming, Fishing & Forestry | 0 (0.0%) | 0 (0.0%) |
| Construction & Extraction | 243 (97.6%) | 6 (2.4%) |
| Installation, Maintenance & Repair | 352 (100.0%) | 0 (0.0%) |
| Total (Category) | 595 (99.0%) | 6 (1.0%) |
| Total (Overall) | 6,551 (55.8%) | 5,193 (44.2%) |
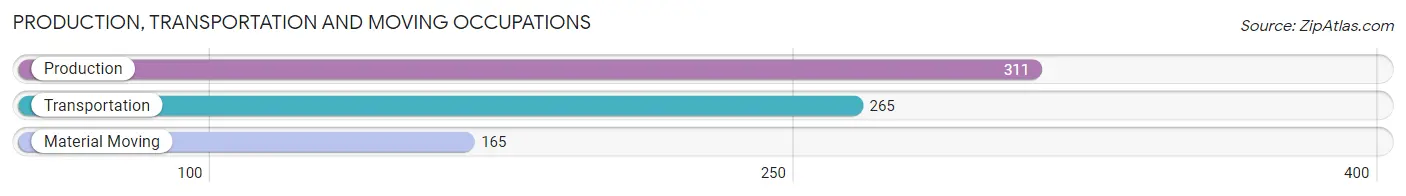
Production, Transportation and Moving Occupations
The most common Production, Transportation and Moving occupations in Palm City are Production (311 | 2.6%), Transportation (265 | 2.3%), and Material Moving (165 | 1.4%).
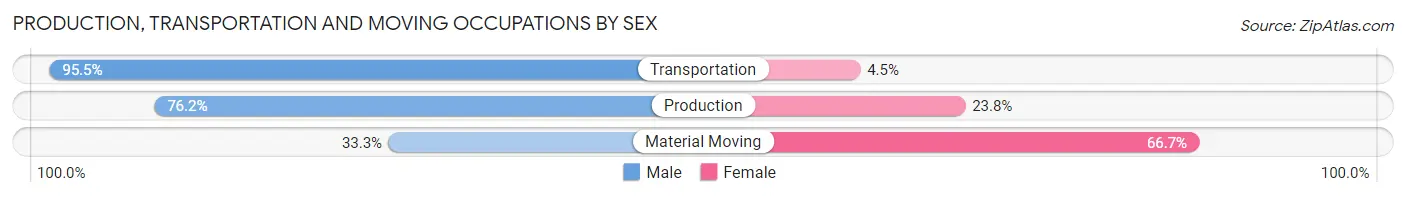
Production, Transportation and Moving Occupations by Sex
| Occupation | Male | Female |
| Production | 237 (76.2%) | 74 (23.8%) |
| Transportation | 253 (95.5%) | 12 (4.5%) |
| Material Moving | 55 (33.3%) | 110 (66.7%) |
| Total (Category) | 545 (73.6%) | 196 (26.5%) |
| Total (Overall) | 6,551 (55.8%) | 5,193 (44.2%) |
Employment Industries by Sex in Palm City
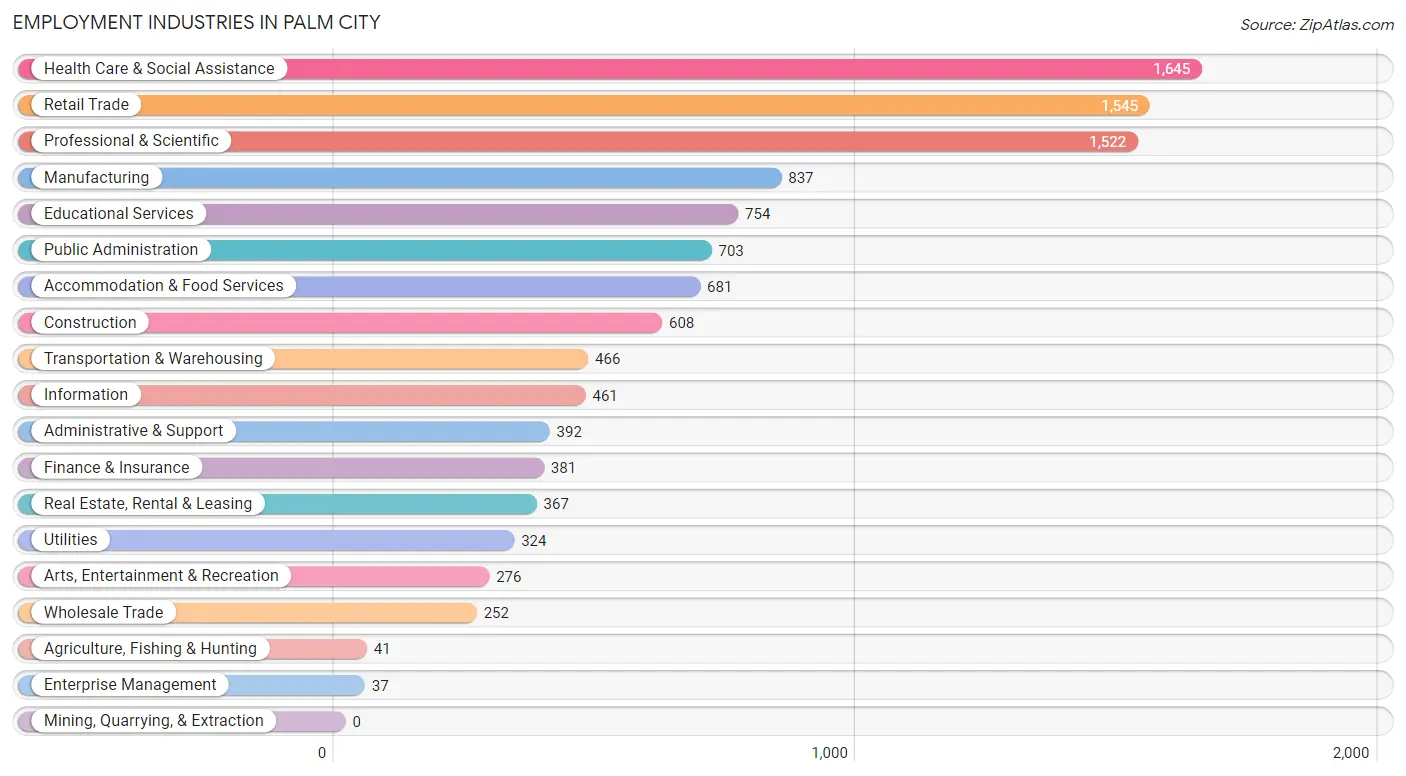
Employment Industries in Palm City
The major employment industries in Palm City include Health Care & Social Assistance (1,645 | 14.0%), Retail Trade (1,545 | 13.2%), Professional & Scientific (1,522 | 13.0%), Manufacturing (837 | 7.1%), and Educational Services (754 | 6.4%).
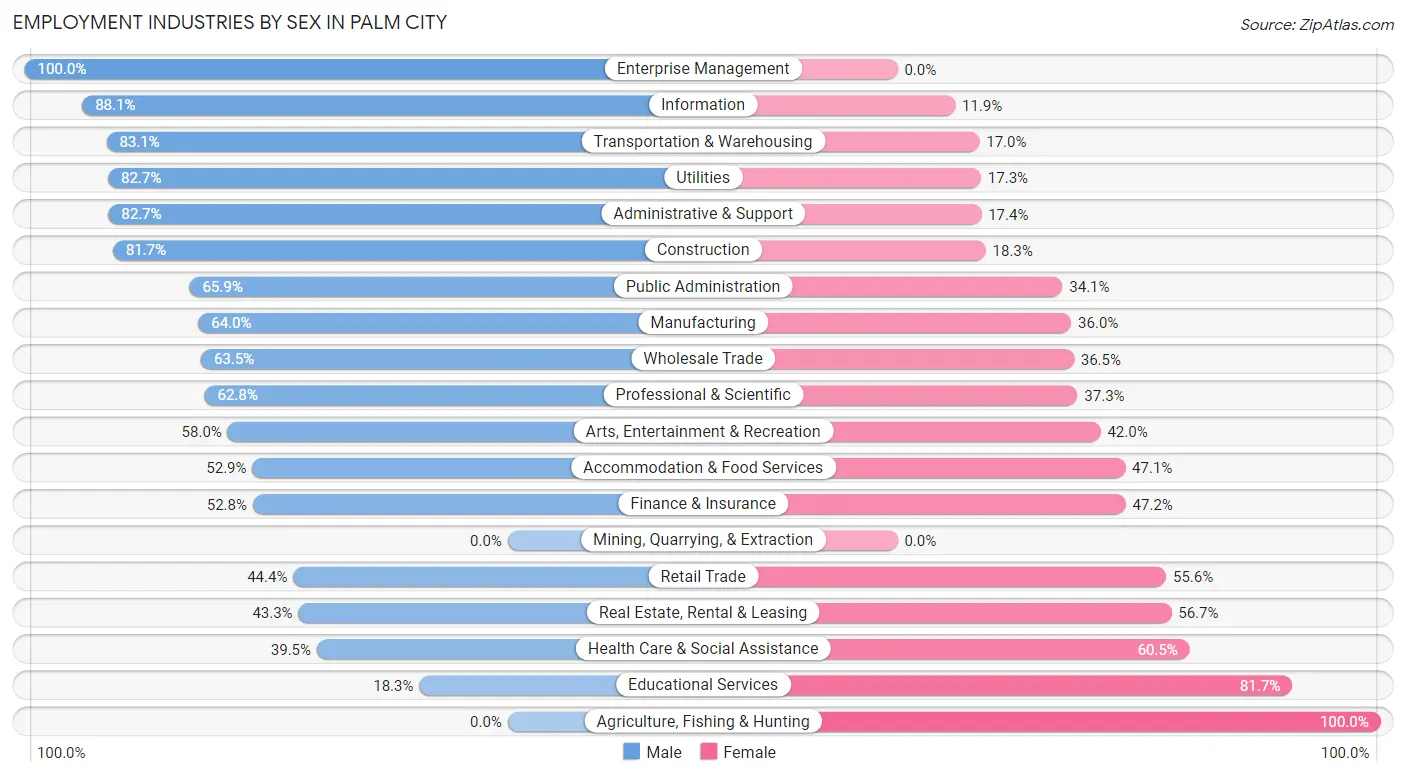
Employment Industries by Sex in Palm City
The Palm City industries that see more men than women are Enterprise Management (100.0%), Information (88.1%), and Transportation & Warehousing (83.1%), whereas the industries that tend to have a higher number of women are Agriculture, Fishing & Hunting (100.0%), Educational Services (81.7%), and Health Care & Social Assistance (60.5%).
| Industry | Male | Female |
| Agriculture, Fishing & Hunting | 0 (0.0%) | 41 (100.0%) |
| Mining, Quarrying, & Extraction | 0 (0.0%) | 0 (0.0%) |
| Construction | 497 (81.7%) | 111 (18.3%) |
| Manufacturing | 536 (64.0%) | 301 (36.0%) |
| Wholesale Trade | 160 (63.5%) | 92 (36.5%) |
| Retail Trade | 686 (44.4%) | 859 (55.6%) |
| Transportation & Warehousing | 387 (83.1%) | 79 (17.0%) |
| Utilities | 268 (82.7%) | 56 (17.3%) |
| Information | 406 (88.1%) | 55 (11.9%) |
| Finance & Insurance | 201 (52.8%) | 180 (47.2%) |
| Real Estate, Rental & Leasing | 159 (43.3%) | 208 (56.7%) |
| Professional & Scientific | 955 (62.7%) | 567 (37.2%) |
| Enterprise Management | 37 (100.0%) | 0 (0.0%) |
| Administrative & Support | 324 (82.7%) | 68 (17.3%) |
| Educational Services | 138 (18.3%) | 616 (81.7%) |
| Health Care & Social Assistance | 650 (39.5%) | 995 (60.5%) |
| Arts, Entertainment & Recreation | 160 (58.0%) | 116 (42.0%) |
| Accommodation & Food Services | 360 (52.9%) | 321 (47.1%) |
| Public Administration | 463 (65.9%) | 240 (34.1%) |
| Total | 6,551 (55.8%) | 5,193 (44.2%) |
Education in Palm City
School Enrollment in Palm City
The most common levels of schooling among the 5,454 students in Palm City are college / undergraduate (1,412 | 25.9%), middle school (1,263 | 23.2%), and elementary school (1,103 | 20.2%).
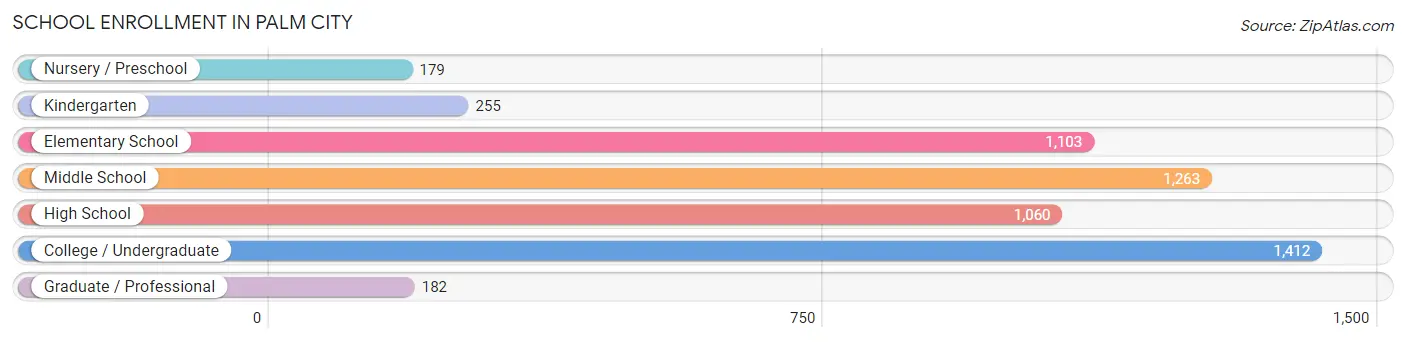
| School Level | # Students | % Students |
| Nursery / Preschool | 179 | 3.3% |
| Kindergarten | 255 | 4.7% |
| Elementary School | 1,103 | 20.2% |
| Middle School | 1,263 | 23.2% |
| High School | 1,060 | 19.4% |
| College / Undergraduate | 1,412 | 25.9% |
| Graduate / Professional | 182 | 3.3% |
| Total | 5,454 | 100.0% |
School Enrollment by Age by Funding Source in Palm City
Out of a total of 5,454 students who are enrolled in schools in Palm City, 611 (11.2%) attend a private institution, while the remaining 4,843 (88.8%) are enrolled in public schools. The age group of 25 to 34 year olds has the highest likelihood of being enrolled in private schools, with 82 (37.6% in the age bracket) enrolled. Conversely, the age group of 3 to 4 year olds has the lowest likelihood of being enrolled in a private school, with 41 (100.0% in the age bracket) attending a public institution.
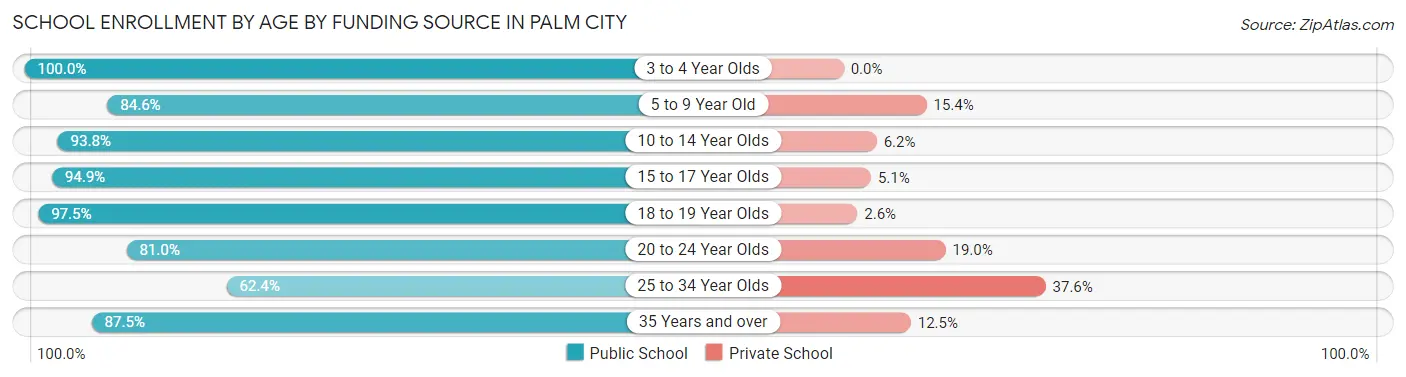
| Age Bracket | Public School | Private School |
| 3 to 4 Year Olds | 41 (100.0%) | 0 (0.0%) |
| 5 to 9 Year Old | 1,107 (84.6%) | 202 (15.4%) |
| 10 to 14 Year Olds | 1,494 (93.8%) | 98 (6.2%) |
| 15 to 17 Year Olds | 765 (94.9%) | 41 (5.1%) |
| 18 to 19 Year Olds | 382 (97.5%) | 10 (2.5%) |
| 20 to 24 Year Olds | 538 (81.0%) | 126 (19.0%) |
| 25 to 34 Year Olds | 136 (62.4%) | 82 (37.6%) |
| 35 Years and over | 378 (87.5%) | 54 (12.5%) |
| Total | 4,843 (88.8%) | 611 (11.2%) |
Educational Attainment by Field of Study in Palm City
Business (2,032 | 20.2%), science & technology (1,298 | 12.9%), education (1,161 | 11.6%), engineering (1,036 | 10.3%), and bio, nature & agricultural (649 | 6.5%) are the most common fields of study among 10,055 individuals in Palm City who have obtained a bachelor's degree or higher.
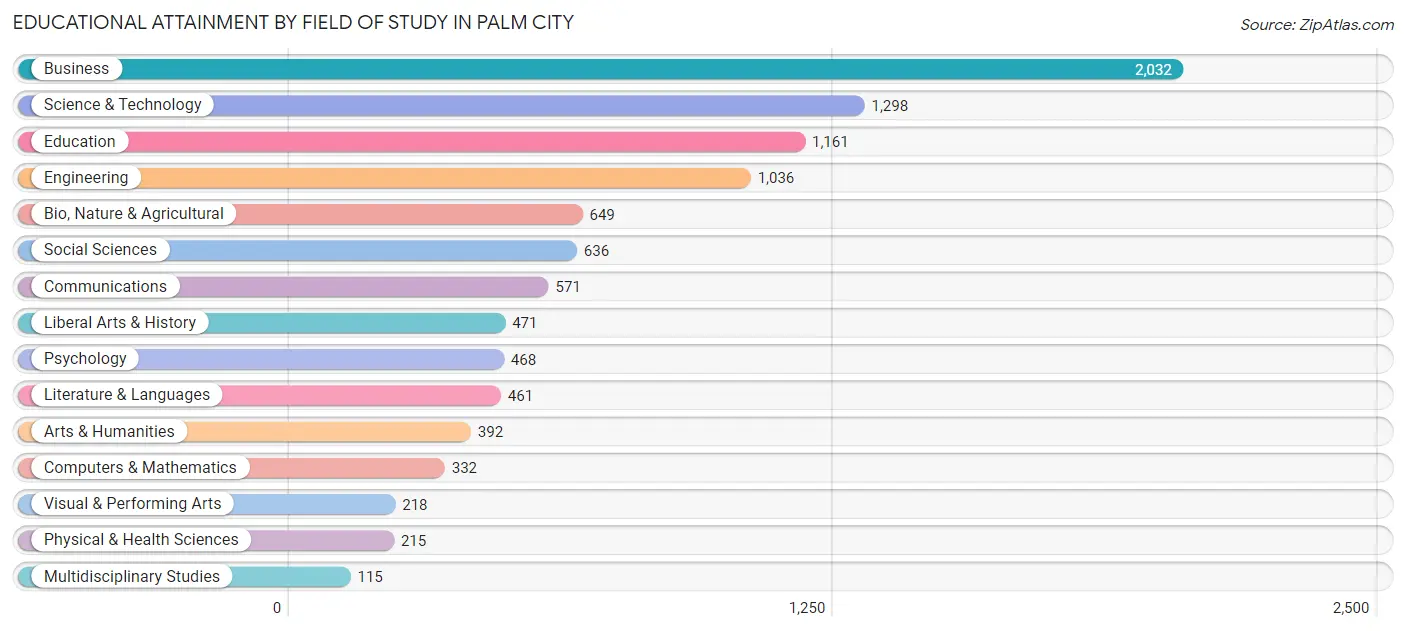
| Field of Study | # Graduates | % Graduates |
| Computers & Mathematics | 332 | 3.3% |
| Bio, Nature & Agricultural | 649 | 6.5% |
| Physical & Health Sciences | 215 | 2.1% |
| Psychology | 468 | 4.6% |
| Social Sciences | 636 | 6.3% |
| Engineering | 1,036 | 10.3% |
| Multidisciplinary Studies | 115 | 1.1% |
| Science & Technology | 1,298 | 12.9% |
| Business | 2,032 | 20.2% |
| Education | 1,161 | 11.6% |
| Literature & Languages | 461 | 4.6% |
| Liberal Arts & History | 471 | 4.7% |
| Visual & Performing Arts | 218 | 2.2% |
| Communications | 571 | 5.7% |
| Arts & Humanities | 392 | 3.9% |
| Total | 10,055 | 100.0% |
Transportation & Commute in Palm City
Vehicle Availability by Sex in Palm City
The most prevalent vehicle ownership categories in Palm City are males with 2 vehicles (3,286, accounting for 50.5%) and females with 2 vehicles (2,346, making up 67.6%).
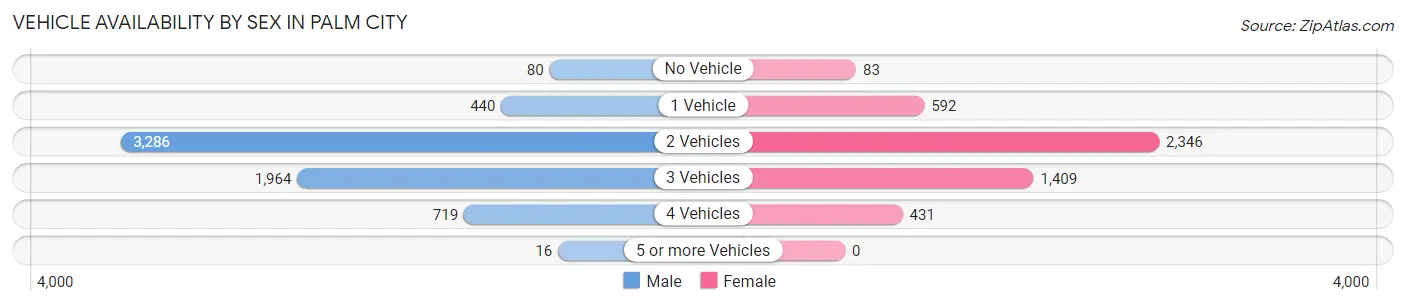
| Vehicles Available | Male | Female |
| No Vehicle | 80 (1.2%) | 83 (1.7%) |
| 1 Vehicle | 440 (6.8%) | 592 (12.2%) |
| 2 Vehicles | 3,286 (50.5%) | 2,346 (48.3%) |
| 3 Vehicles | 1,964 (30.2%) | 1,409 (29.0%) |
| 4 Vehicles | 719 (11.1%) | 431 (8.9%) |
| 5 or more Vehicles | 16 (0.3%) | 0 (0.0%) |
| Total | 6,505 (100.0%) | 4,861 (100.0%) |
Commute Time in Palm City
The most frequently occuring commute durations in Palm City are 10 to 14 minutes (1,397 commuters, 15.0%), 15 to 19 minutes (1,388 commuters, 14.9%), and 30 to 34 minutes (1,199 commuters, 12.9%).
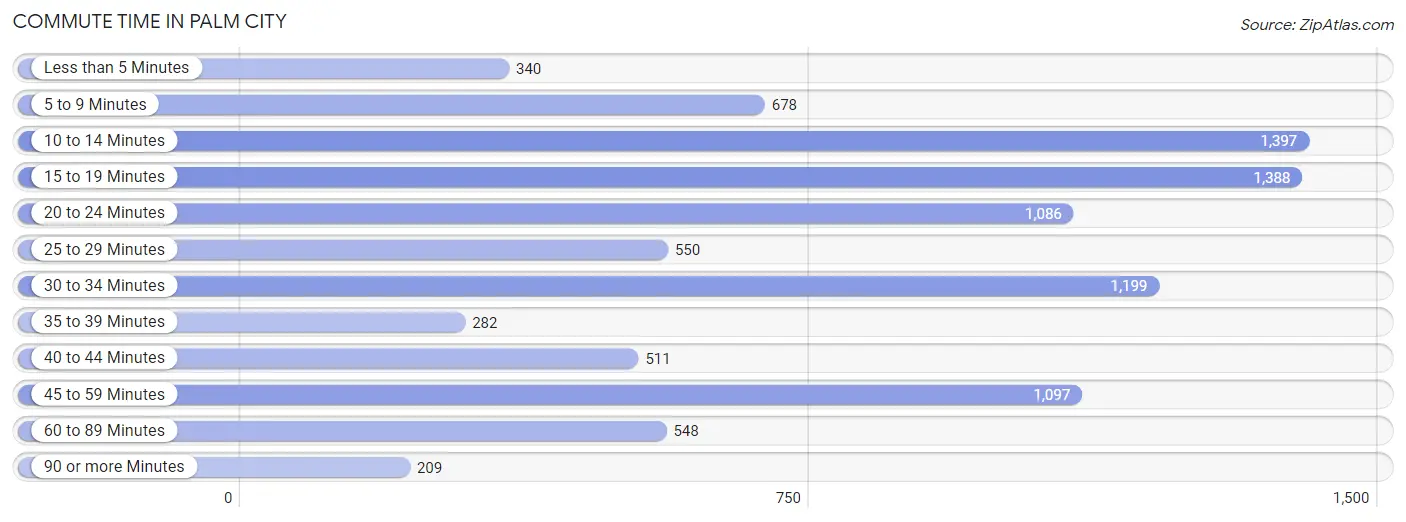
| Commute Time | # Commuters | % Commuters |
| Less than 5 Minutes | 340 | 3.7% |
| 5 to 9 Minutes | 678 | 7.3% |
| 10 to 14 Minutes | 1,397 | 15.0% |
| 15 to 19 Minutes | 1,388 | 14.9% |
| 20 to 24 Minutes | 1,086 | 11.7% |
| 25 to 29 Minutes | 550 | 5.9% |
| 30 to 34 Minutes | 1,199 | 12.9% |
| 35 to 39 Minutes | 282 | 3.0% |
| 40 to 44 Minutes | 511 | 5.5% |
| 45 to 59 Minutes | 1,097 | 11.8% |
| 60 to 89 Minutes | 548 | 5.9% |
| 90 or more Minutes | 209 | 2.2% |
Commute Time by Sex in Palm City
The most common commute times in Palm City are 10 to 14 minutes (948 commuters, 18.1%) for males and 20 to 24 minutes (679 commuters, 16.8%) for females.
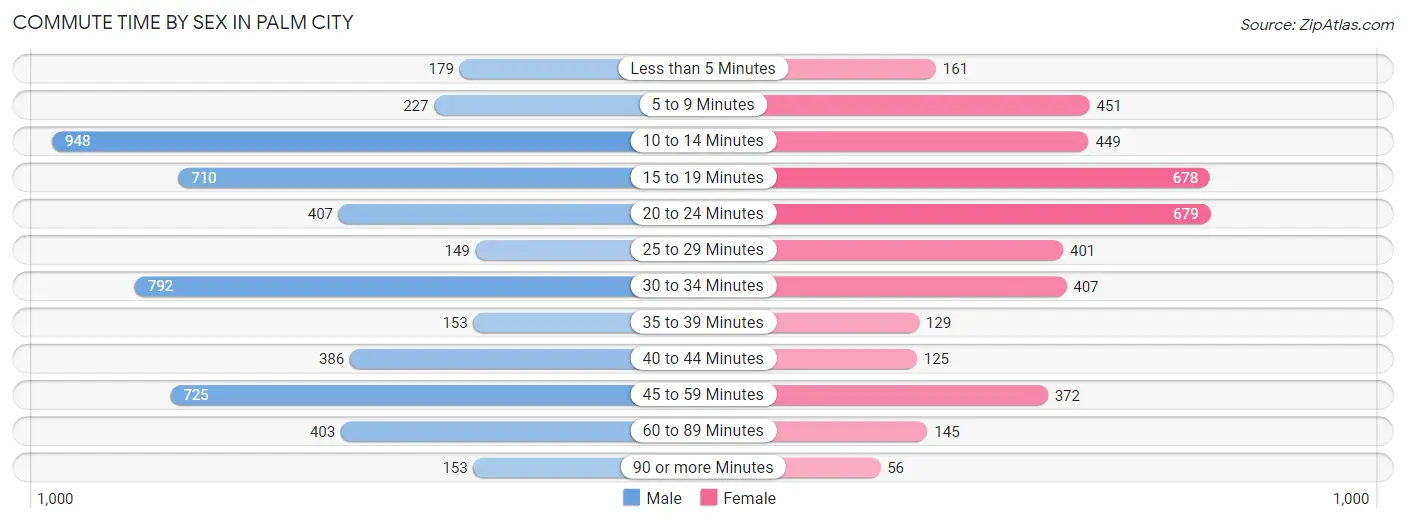
| Commute Time | Male | Female |
| Less than 5 Minutes | 179 (3.4%) | 161 (4.0%) |
| 5 to 9 Minutes | 227 (4.3%) | 451 (11.1%) |
| 10 to 14 Minutes | 948 (18.1%) | 449 (11.1%) |
| 15 to 19 Minutes | 710 (13.6%) | 678 (16.7%) |
| 20 to 24 Minutes | 407 (7.8%) | 679 (16.8%) |
| 25 to 29 Minutes | 149 (2.9%) | 401 (9.9%) |
| 30 to 34 Minutes | 792 (15.1%) | 407 (10.0%) |
| 35 to 39 Minutes | 153 (2.9%) | 129 (3.2%) |
| 40 to 44 Minutes | 386 (7.4%) | 125 (3.1%) |
| 45 to 59 Minutes | 725 (13.9%) | 372 (9.2%) |
| 60 to 89 Minutes | 403 (7.7%) | 145 (3.6%) |
| 90 or more Minutes | 153 (2.9%) | 56 (1.4%) |
Time of Departure to Work by Sex in Palm City
The most frequent times of departure to work in Palm City are 7:00 AM to 7:29 AM (957, 18.3%) for males and 8:00 AM to 8:29 AM (768, 19.0%) for females.
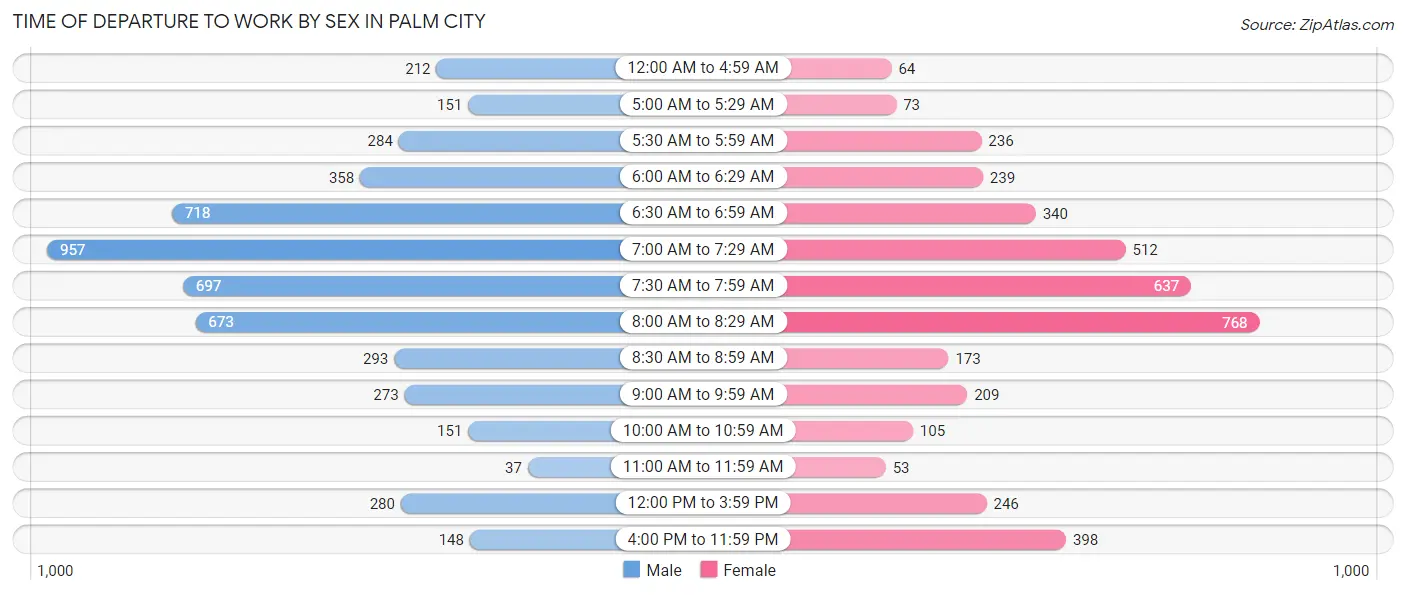
| Time of Departure | Male | Female |
| 12:00 AM to 4:59 AM | 212 (4.1%) | 64 (1.6%) |
| 5:00 AM to 5:29 AM | 151 (2.9%) | 73 (1.8%) |
| 5:30 AM to 5:59 AM | 284 (5.4%) | 236 (5.8%) |
| 6:00 AM to 6:29 AM | 358 (6.8%) | 239 (5.9%) |
| 6:30 AM to 6:59 AM | 718 (13.7%) | 340 (8.4%) |
| 7:00 AM to 7:29 AM | 957 (18.3%) | 512 (12.6%) |
| 7:30 AM to 7:59 AM | 697 (13.3%) | 637 (15.7%) |
| 8:00 AM to 8:29 AM | 673 (12.9%) | 768 (19.0%) |
| 8:30 AM to 8:59 AM | 293 (5.6%) | 173 (4.3%) |
| 9:00 AM to 9:59 AM | 273 (5.2%) | 209 (5.2%) |
| 10:00 AM to 10:59 AM | 151 (2.9%) | 105 (2.6%) |
| 11:00 AM to 11:59 AM | 37 (0.7%) | 53 (1.3%) |
| 12:00 PM to 3:59 PM | 280 (5.3%) | 246 (6.1%) |
| 4:00 PM to 11:59 PM | 148 (2.8%) | 398 (9.8%) |
| Total | 5,232 (100.0%) | 4,053 (100.0%) |
Housing Occupancy in Palm City
Occupancy by Ownership in Palm City
Of the total 10,289 dwellings in Palm City, owner-occupied units account for 9,008 (87.5%), while renter-occupied units make up 1,281 (12.4%).
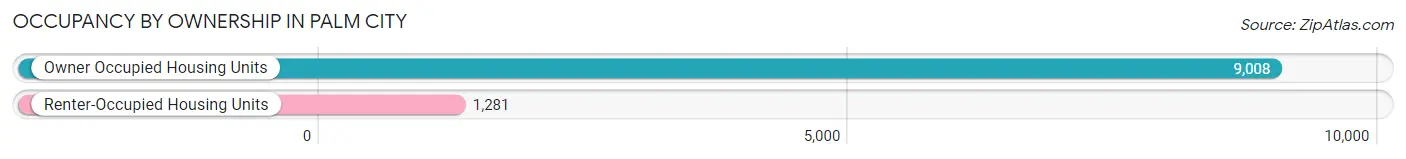
| Occupancy | # Housing Units | % Housing Units |
| Owner Occupied Housing Units | 9,008 | 87.5% |
| Renter-Occupied Housing Units | 1,281 | 12.4% |
| Total Occupied Housing Units | 10,289 | 100.0% |
Occupancy by Household Size in Palm City
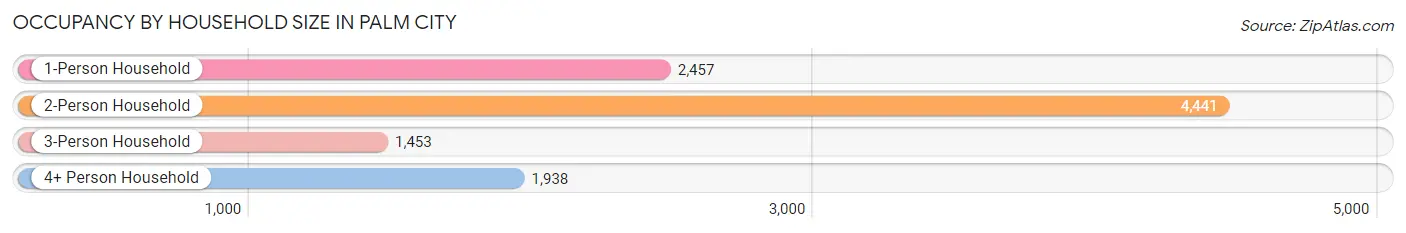
| Household Size | # Housing Units | % Housing Units |
| 1-Person Household | 2,457 | 23.9% |
| 2-Person Household | 4,441 | 43.2% |
| 3-Person Household | 1,453 | 14.1% |
| 4+ Person Household | 1,938 | 18.8% |
| Total Housing Units | 10,289 | 100.0% |
Occupancy by Ownership by Household Size in Palm City
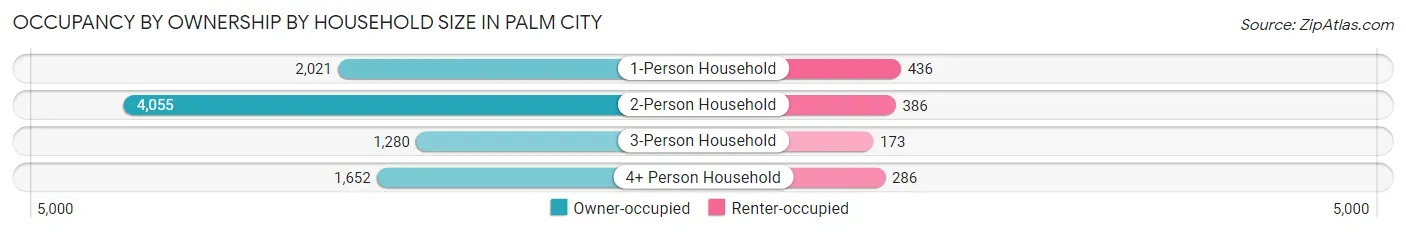
| Household Size | Owner-occupied | Renter-occupied |
| 1-Person Household | 2,021 (82.3%) | 436 (17.7%) |
| 2-Person Household | 4,055 (91.3%) | 386 (8.7%) |
| 3-Person Household | 1,280 (88.1%) | 173 (11.9%) |
| 4+ Person Household | 1,652 (85.2%) | 286 (14.8%) |
| Total Housing Units | 9,008 (87.5%) | 1,281 (12.4%) |
Occupancy by Educational Attainment in Palm City
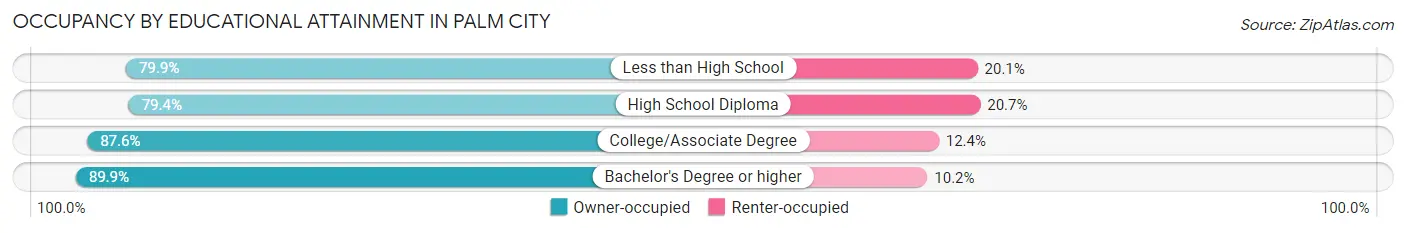
| Household Size | Owner-occupied | Renter-occupied |
| Less than High School | 151 (79.9%) | 38 (20.1%) |
| High School Diploma | 1,076 (79.3%) | 280 (20.6%) |
| College/Associate Degree | 2,905 (87.6%) | 412 (12.4%) |
| Bachelor's Degree or higher | 4,876 (89.8%) | 551 (10.2%) |
Occupancy by Age of Householder in Palm City
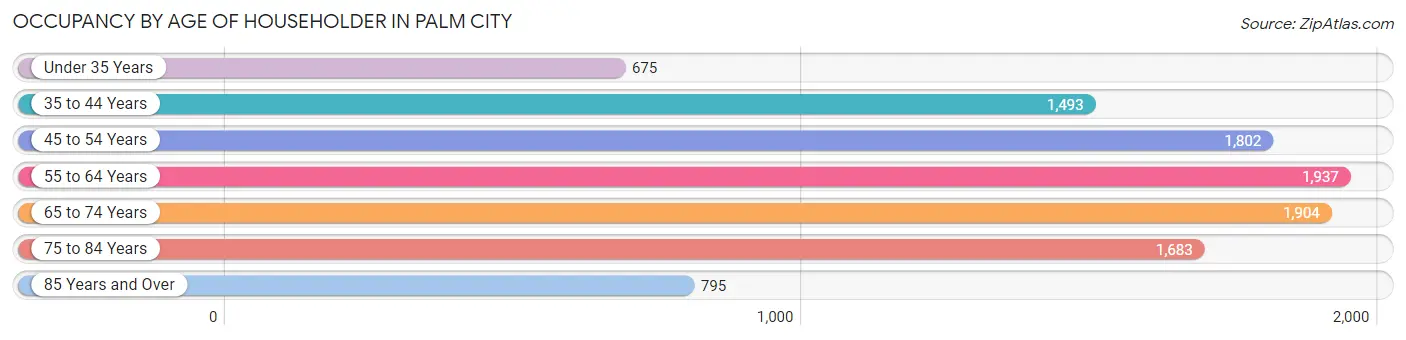
| Age Bracket | # Households | % Households |
| Under 35 Years | 675 | 6.6% |
| 35 to 44 Years | 1,493 | 14.5% |
| 45 to 54 Years | 1,802 | 17.5% |
| 55 to 64 Years | 1,937 | 18.8% |
| 65 to 74 Years | 1,904 | 18.5% |
| 75 to 84 Years | 1,683 | 16.4% |
| 85 Years and Over | 795 | 7.7% |
| Total | 10,289 | 100.0% |
Housing Finances in Palm City
Median Income by Occupancy in Palm City
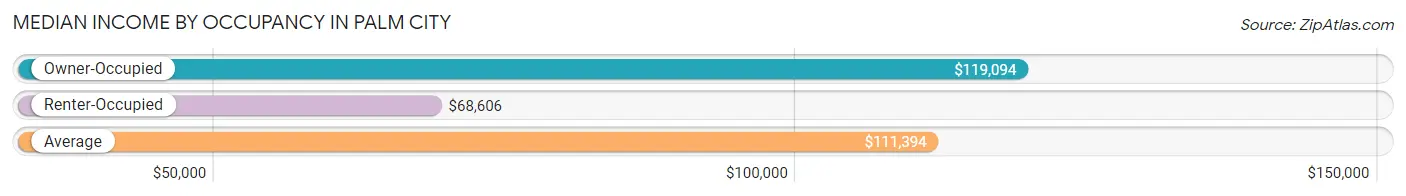
| Occupancy Type | # Households | Median Income |
| Owner-Occupied | 9,008 (87.5%) | $119,094 |
| Renter-Occupied | 1,281 (12.4%) | $68,606 |
| Average | 10,289 (100.0%) | $111,394 |
Occupancy by Householder Income Bracket in Palm City
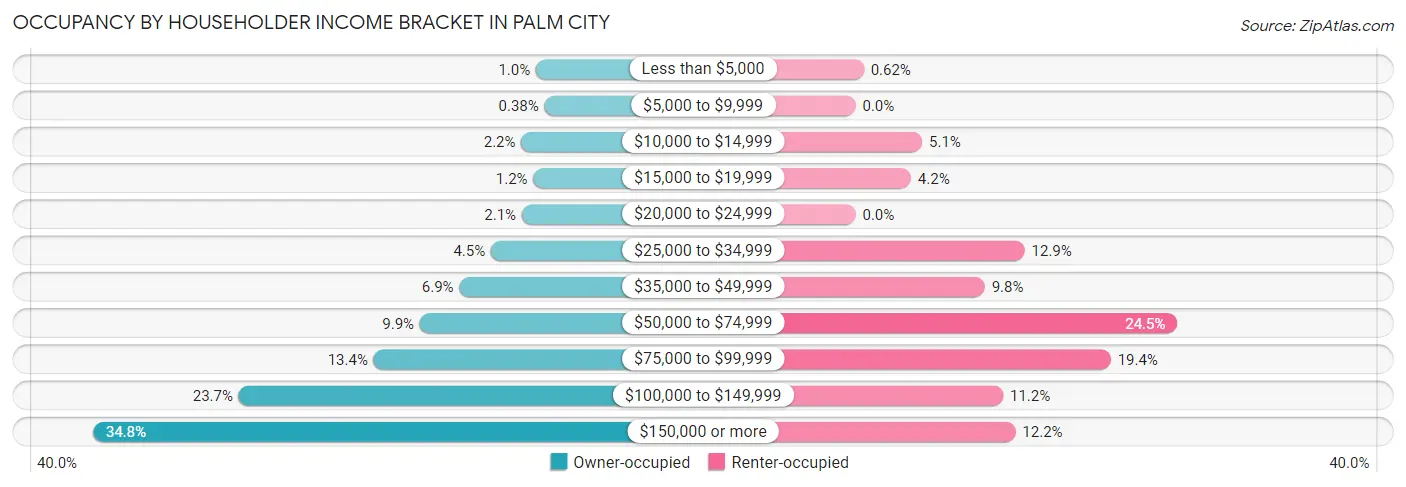
| Income Bracket | Owner-occupied | Renter-occupied |
| Less than $5,000 | 93 (1.0%) | 8 (0.6%) |
| $5,000 to $9,999 | 34 (0.4%) | 0 (0.0%) |
| $10,000 to $14,999 | 194 (2.1%) | 65 (5.1%) |
| $15,000 to $19,999 | 111 (1.2%) | 54 (4.2%) |
| $20,000 to $24,999 | 190 (2.1%) | 0 (0.0%) |
| $25,000 to $34,999 | 402 (4.5%) | 165 (12.9%) |
| $35,000 to $49,999 | 619 (6.9%) | 126 (9.8%) |
| $50,000 to $74,999 | 890 (9.9%) | 314 (24.5%) |
| $75,000 to $99,999 | 1,207 (13.4%) | 249 (19.4%) |
| $100,000 to $149,999 | 2,133 (23.7%) | 144 (11.2%) |
| $150,000 or more | 3,135 (34.8%) | 156 (12.2%) |
| Total | 9,008 (100.0%) | 1,281 (100.0%) |
Monthly Housing Cost Tiers in Palm City
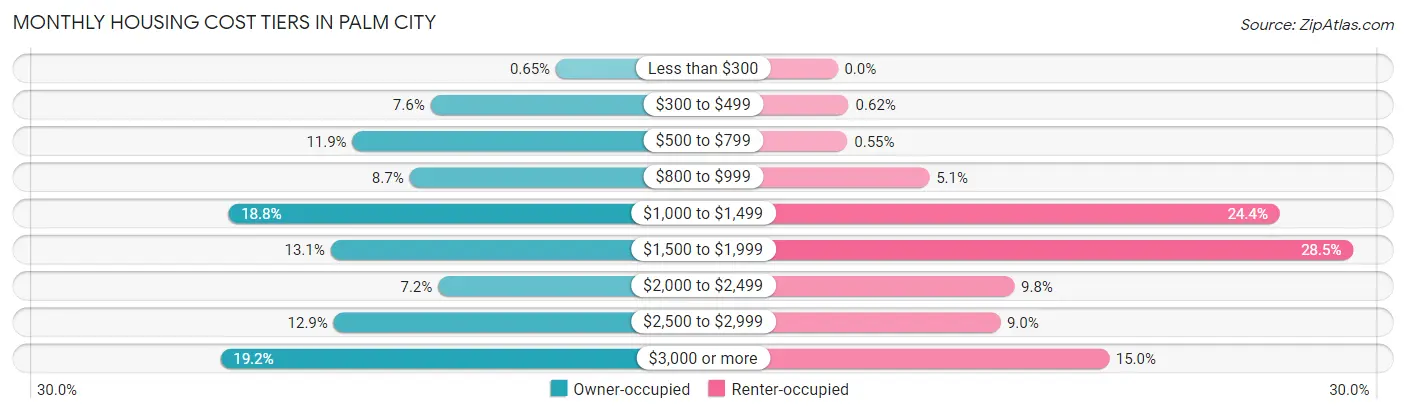
| Monthly Cost | Owner-occupied | Renter-occupied |
| Less than $300 | 59 (0.6%) | 0 (0.0%) |
| $300 to $499 | 683 (7.6%) | 8 (0.6%) |
| $500 to $799 | 1,071 (11.9%) | 7 (0.5%) |
| $800 to $999 | 787 (8.7%) | 65 (5.1%) |
| $1,000 to $1,499 | 1,689 (18.8%) | 313 (24.4%) |
| $1,500 to $1,999 | 1,180 (13.1%) | 365 (28.5%) |
| $2,000 to $2,499 | 645 (7.2%) | 125 (9.8%) |
| $2,500 to $2,999 | 1,165 (12.9%) | 115 (9.0%) |
| $3,000 or more | 1,729 (19.2%) | 192 (15.0%) |
| Total | 9,008 (100.0%) | 1,281 (100.0%) |
Physical Housing Characteristics in Palm City
Housing Structures in Palm City
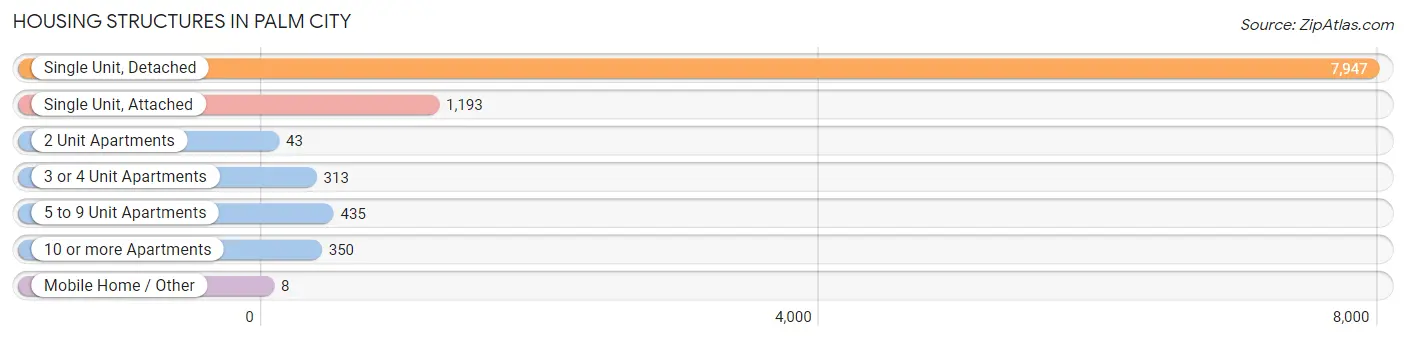
| Structure Type | # Housing Units | % Housing Units |
| Single Unit, Detached | 7,947 | 77.2% |
| Single Unit, Attached | 1,193 | 11.6% |
| 2 Unit Apartments | 43 | 0.4% |
| 3 or 4 Unit Apartments | 313 | 3.0% |
| 5 to 9 Unit Apartments | 435 | 4.2% |
| 10 or more Apartments | 350 | 3.4% |
| Mobile Home / Other | 8 | 0.1% |
| Total | 10,289 | 100.0% |
Housing Structures by Occupancy in Palm City
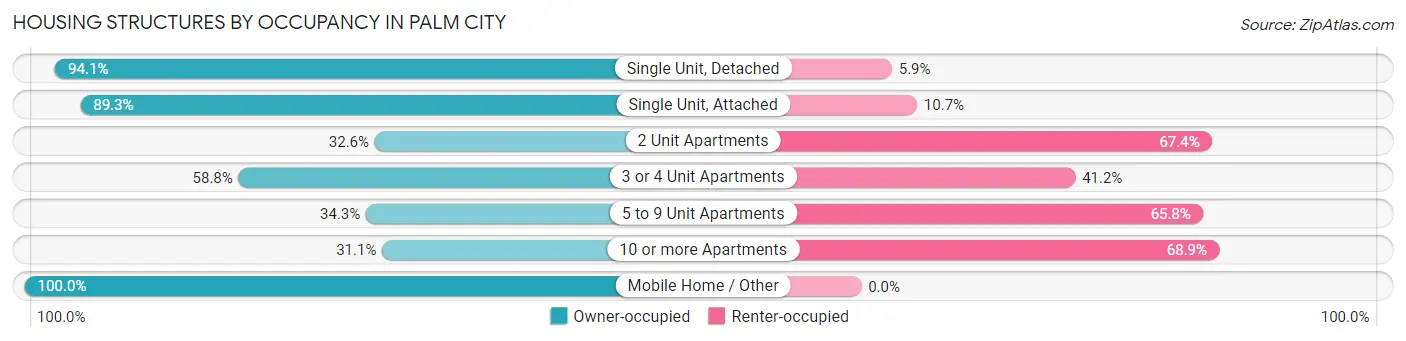
| Structure Type | Owner-occupied | Renter-occupied |
| Single Unit, Detached | 7,479 (94.1%) | 468 (5.9%) |
| Single Unit, Attached | 1,065 (89.3%) | 128 (10.7%) |
| 2 Unit Apartments | 14 (32.6%) | 29 (67.4%) |
| 3 or 4 Unit Apartments | 184 (58.8%) | 129 (41.2%) |
| 5 to 9 Unit Apartments | 149 (34.3%) | 286 (65.7%) |
| 10 or more Apartments | 109 (31.1%) | 241 (68.9%) |
| Mobile Home / Other | 8 (100.0%) | 0 (0.0%) |
| Total | 9,008 (87.5%) | 1,281 (12.4%) |
Housing Structures by Number of Rooms in Palm City
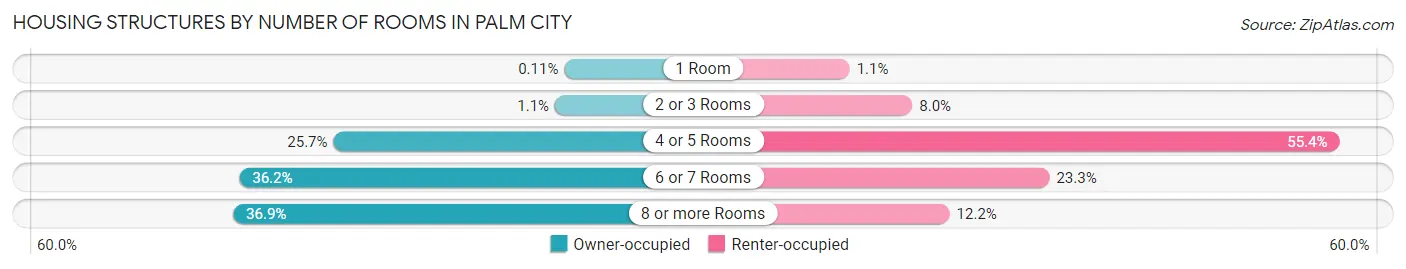
| Number of Rooms | Owner-occupied | Renter-occupied |
| 1 Room | 10 (0.1%) | 14 (1.1%) |
| 2 or 3 Rooms | 103 (1.1%) | 103 (8.0%) |
| 4 or 5 Rooms | 2,318 (25.7%) | 710 (55.4%) |
| 6 or 7 Rooms | 3,258 (36.2%) | 298 (23.3%) |
| 8 or more Rooms | 3,319 (36.8%) | 156 (12.2%) |
| Total | 9,008 (100.0%) | 1,281 (100.0%) |
Housing Structure by Heating Type in Palm City
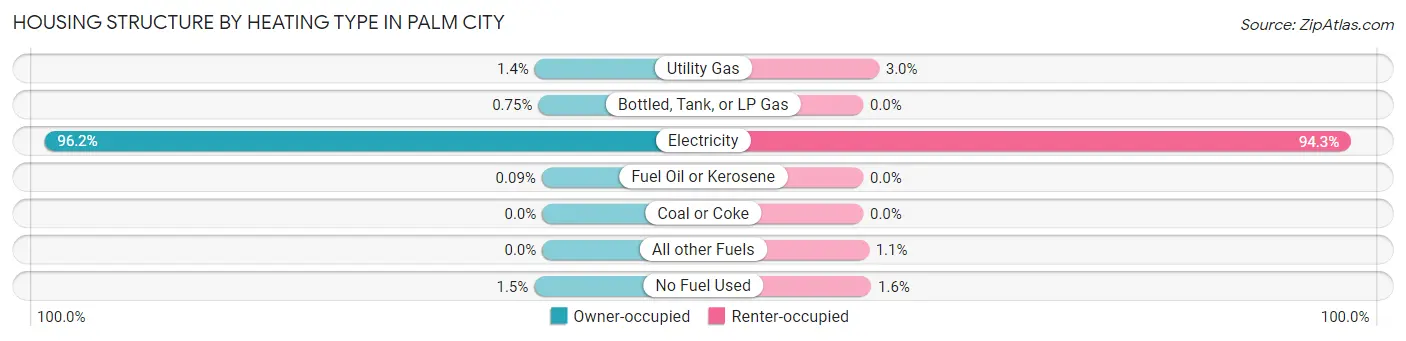
| Heating Type | Owner-occupied | Renter-occupied |
| Utility Gas | 129 (1.4%) | 39 (3.0%) |
| Bottled, Tank, or LP Gas | 68 (0.7%) | 0 (0.0%) |
| Electricity | 8,664 (96.2%) | 1,208 (94.3%) |
| Fuel Oil or Kerosene | 8 (0.1%) | 0 (0.0%) |
| Coal or Coke | 0 (0.0%) | 0 (0.0%) |
| All other Fuels | 0 (0.0%) | 14 (1.1%) |
| No Fuel Used | 139 (1.5%) | 20 (1.6%) |
| Total | 9,008 (100.0%) | 1,281 (100.0%) |
Household Vehicle Usage in Palm City
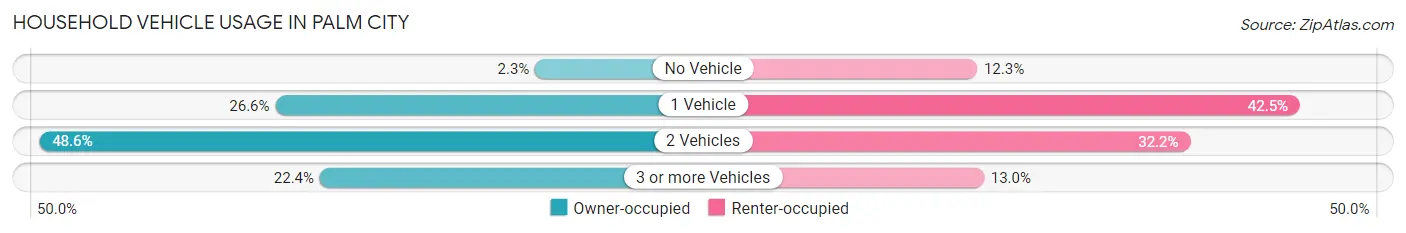
| Vehicles per Household | Owner-occupied | Renter-occupied |
| No Vehicle | 211 (2.3%) | 158 (12.3%) |
| 1 Vehicle | 2,395 (26.6%) | 544 (42.5%) |
| 2 Vehicles | 4,381 (48.6%) | 413 (32.2%) |
| 3 or more Vehicles | 2,021 (22.4%) | 166 (13.0%) |
| Total | 9,008 (100.0%) | 1,281 (100.0%) |
Real Estate & Mortgages in Palm City
Real Estate and Mortgage Overview in Palm City
| Characteristic | Without Mortgage | With Mortgage |
| Housing Units | 3,700 | 5,308 |
| Median Property Value | $447,100 | $529,700 |
| Median Household Income | $93,091 | $1,883 |
| Monthly Housing Costs | $844 | $1,718 |
| Real Estate Taxes | $4,208 | $59 |
Property Value by Mortgage Status in Palm City
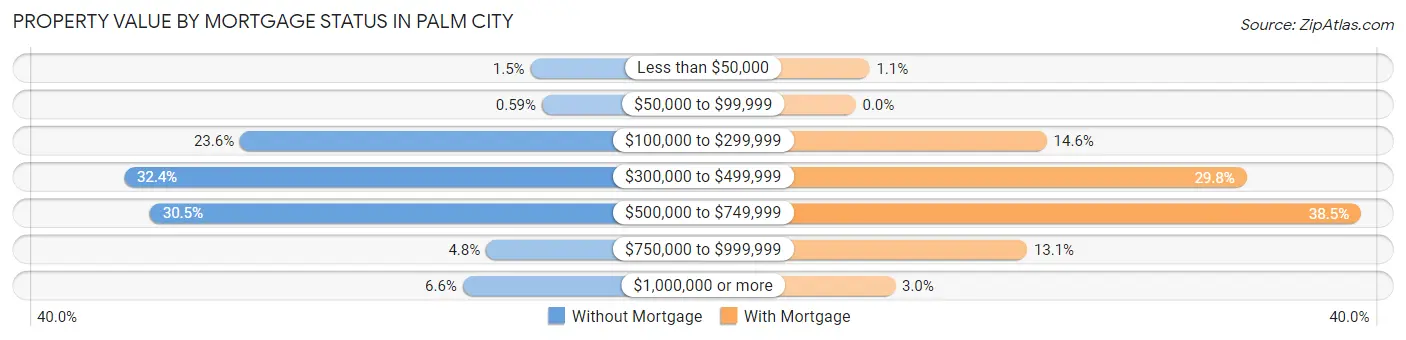
| Property Value | Without Mortgage | With Mortgage |
| Less than $50,000 | 54 (1.5%) | 56 (1.1%) |
| $50,000 to $99,999 | 22 (0.6%) | 0 (0.0%) |
| $100,000 to $299,999 | 873 (23.6%) | 773 (14.6%) |
| $300,000 to $499,999 | 1,200 (32.4%) | 1,582 (29.8%) |
| $500,000 to $749,999 | 1,127 (30.5%) | 2,044 (38.5%) |
| $750,000 to $999,999 | 179 (4.8%) | 693 (13.1%) |
| $1,000,000 or more | 245 (6.6%) | 160 (3.0%) |
| Total | 3,700 (100.0%) | 5,308 (100.0%) |
Household Income by Mortgage Status in Palm City
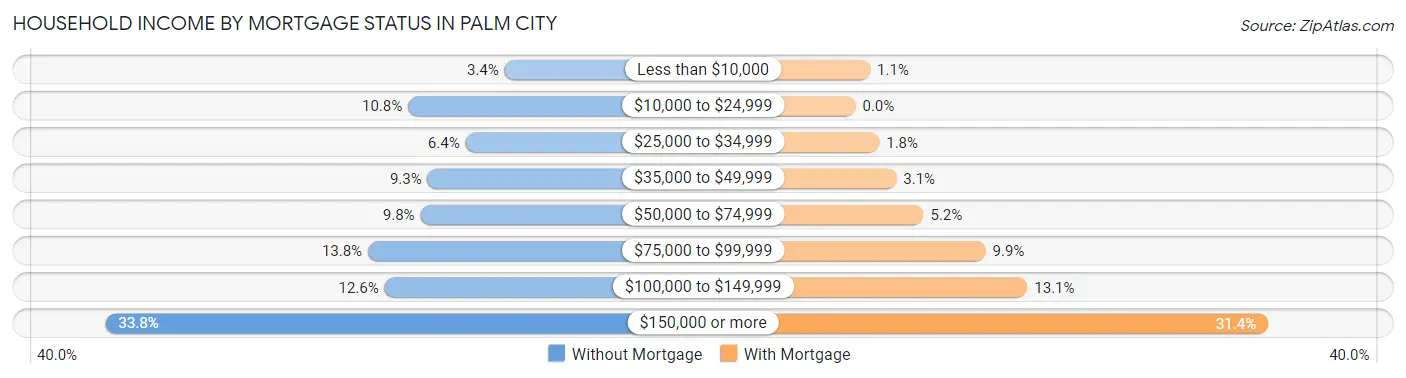
| Household Income | Without Mortgage | With Mortgage |
| Less than $10,000 | 127 (3.4%) | 59 (1.1%) |
| $10,000 to $24,999 | 399 (10.8%) | 0 (0.0%) |
| $25,000 to $34,999 | 237 (6.4%) | 96 (1.8%) |
| $35,000 to $49,999 | 344 (9.3%) | 165 (3.1%) |
| $50,000 to $74,999 | 364 (9.8%) | 275 (5.2%) |
| $75,000 to $99,999 | 512 (13.8%) | 526 (9.9%) |
| $100,000 to $149,999 | 465 (12.6%) | 695 (13.1%) |
| $150,000 or more | 1,252 (33.8%) | 1,668 (31.4%) |
| Total | 3,700 (100.0%) | 5,308 (100.0%) |
Property Value to Household Income Ratio in Palm City
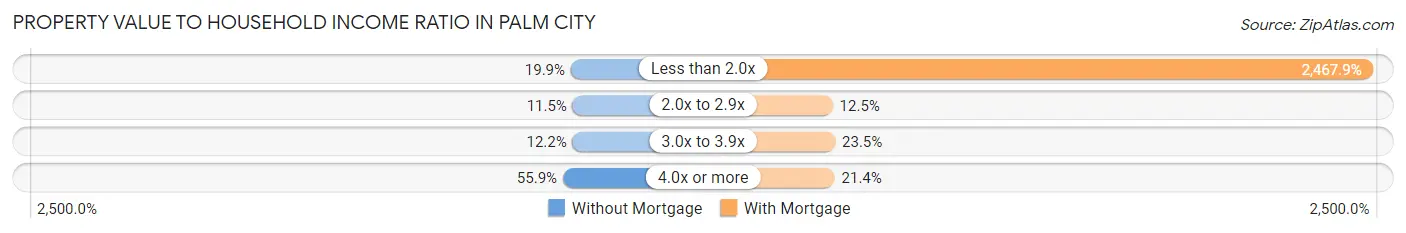
| Value-to-Income Ratio | Without Mortgage | With Mortgage |
| Less than 2.0x | 735 (19.9%) | 130,994 (2,467.9%) |
| 2.0x to 2.9x | 424 (11.5%) | 661 (12.4%) |
| 3.0x to 3.9x | 452 (12.2%) | 1,249 (23.5%) |
| 4.0x or more | 2,068 (55.9%) | 1,133 (21.3%) |
| Total | 3,700 (100.0%) | 5,308 (100.0%) |
Real Estate Taxes by Mortgage Status in Palm City
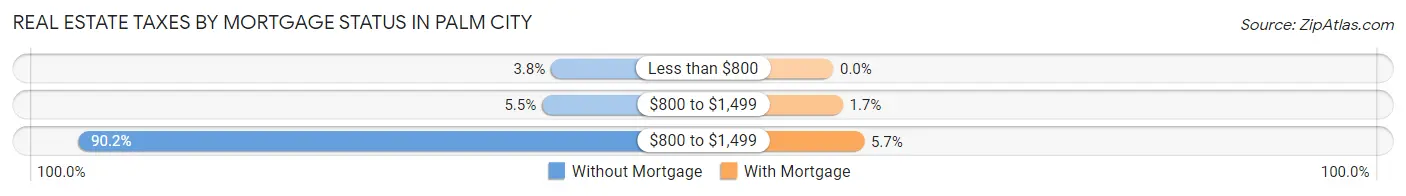
| Property Taxes | Without Mortgage | With Mortgage |
| Less than $800 | 142 (3.8%) | 0 (0.0%) |
| $800 to $1,499 | 203 (5.5%) | 92 (1.7%) |
| $800 to $1,499 | 3,338 (90.2%) | 300 (5.7%) |
| Total | 3,700 (100.0%) | 5,308 (100.0%) |
Health & Disability in Palm City
Health Insurance Coverage by Age in Palm City
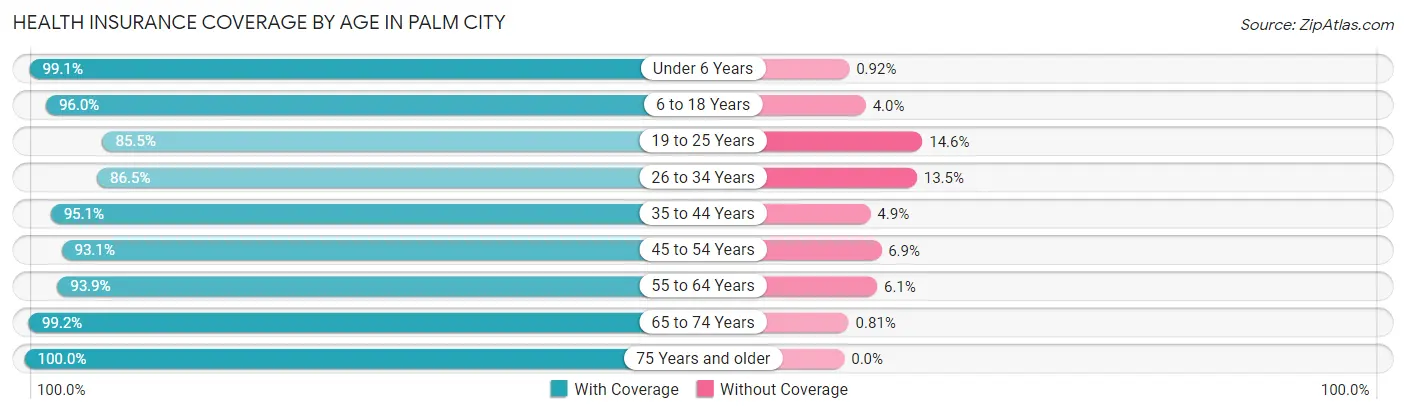
| Age Bracket | With Coverage | Without Coverage |
| Under 6 Years | 1,187 (99.1%) | 11 (0.9%) |
| 6 to 18 Years | 3,610 (96.0%) | 150 (4.0%) |
| 19 to 25 Years | 1,298 (85.5%) | 221 (14.5%) |
| 26 to 34 Years | 1,087 (86.5%) | 170 (13.5%) |
| 35 to 44 Years | 3,046 (95.1%) | 156 (4.9%) |
| 45 to 54 Years | 3,406 (93.1%) | 252 (6.9%) |
| 55 to 64 Years | 3,548 (93.9%) | 231 (6.1%) |
| 65 to 74 Years | 3,315 (99.2%) | 27 (0.8%) |
| 75 Years and older | 4,047 (100.0%) | 0 (0.0%) |
| Total | 24,544 (95.3%) | 1,218 (4.7%) |
Health Insurance Coverage by Citizenship Status in Palm City
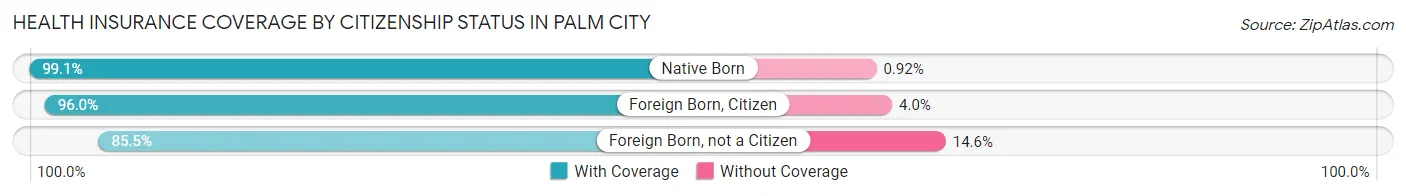
| Citizenship Status | With Coverage | Without Coverage |
| Native Born | 1,187 (99.1%) | 11 (0.9%) |
| Foreign Born, Citizen | 3,610 (96.0%) | 150 (4.0%) |
| Foreign Born, not a Citizen | 1,298 (85.5%) | 221 (14.5%) |
Health Insurance Coverage by Household Income in Palm City
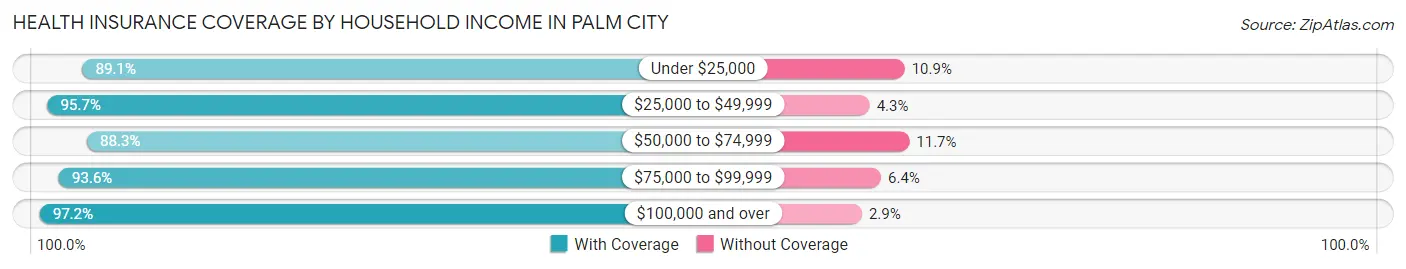
| Household Income | With Coverage | Without Coverage |
| Under $25,000 | 1,034 (89.1%) | 126 (10.9%) |
| $25,000 to $49,999 | 2,277 (95.7%) | 102 (4.3%) |
| $50,000 to $74,999 | 2,238 (88.3%) | 297 (11.7%) |
| $75,000 to $99,999 | 3,448 (93.6%) | 237 (6.4%) |
| $100,000 and over | 15,547 (97.2%) | 456 (2.9%) |
Public vs Private Health Insurance Coverage by Age in Palm City
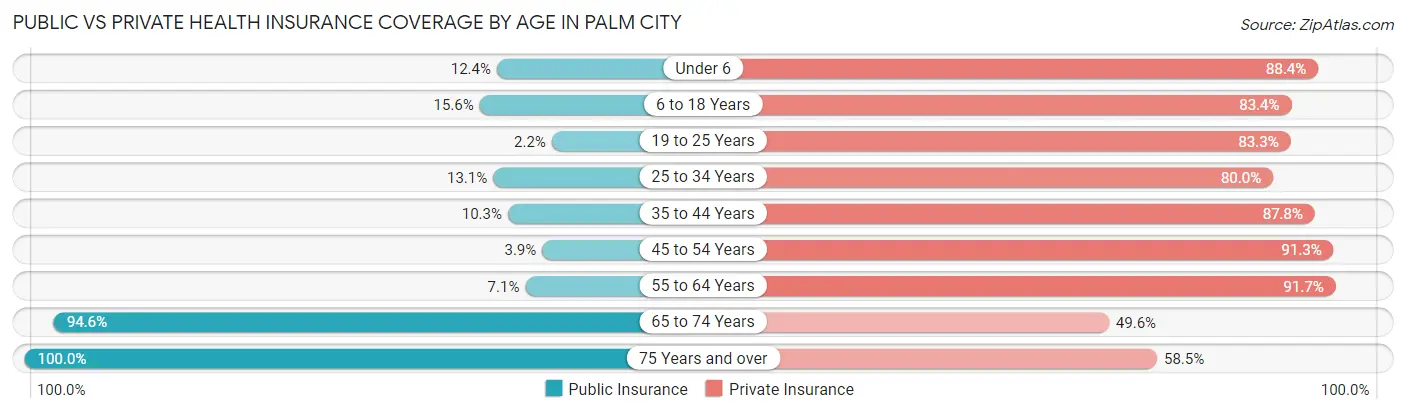
| Age Bracket | Public Insurance | Private Insurance |
| Under 6 | 148 (12.3%) | 1,059 (88.4%) |
| 6 to 18 Years | 585 (15.6%) | 3,137 (83.4%) |
| 19 to 25 Years | 33 (2.2%) | 1,265 (83.3%) |
| 25 to 34 Years | 164 (13.1%) | 1,006 (80.0%) |
| 35 to 44 Years | 330 (10.3%) | 2,811 (87.8%) |
| 45 to 54 Years | 144 (3.9%) | 3,339 (91.3%) |
| 55 to 64 Years | 267 (7.1%) | 3,464 (91.7%) |
| 65 to 74 Years | 3,161 (94.6%) | 1,657 (49.6%) |
| 75 Years and over | 4,047 (100.0%) | 2,368 (58.5%) |
| Total | 8,879 (34.5%) | 20,106 (78.0%) |
Disability Status by Sex by Age in Palm City
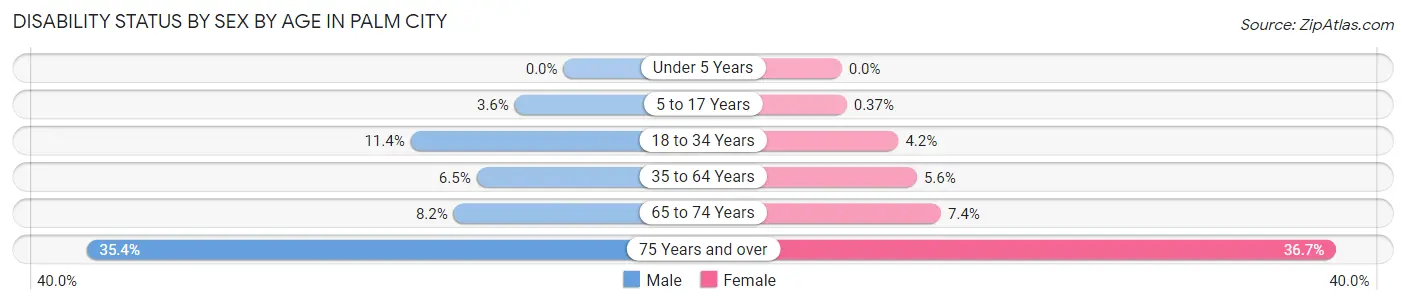
| Age Bracket | Male | Female |
| Under 5 Years | 0 (0.0%) | 0 (0.0%) |
| 5 to 17 Years | 66 (3.6%) | 7 (0.4%) |
| 18 to 34 Years | 171 (11.4%) | 69 (4.2%) |
| 35 to 64 Years | 336 (6.5%) | 303 (5.6%) |
| 65 to 74 Years | 133 (8.2%) | 126 (7.4%) |
| 75 Years and over | 595 (35.4%) | 868 (36.7%) |
Disability Class by Sex by Age in Palm City
Disability Class: Hearing Difficulty
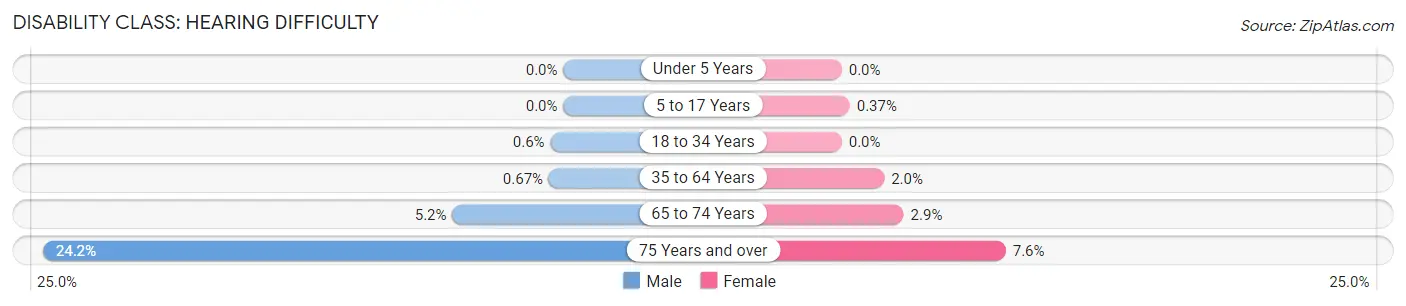
| Age Bracket | Male | Female |
| Under 5 Years | 0 (0.0%) | 0 (0.0%) |
| 5 to 17 Years | 0 (0.0%) | 7 (0.4%) |
| 18 to 34 Years | 9 (0.6%) | 0 (0.0%) |
| 35 to 64 Years | 35 (0.7%) | 107 (2.0%) |
| 65 to 74 Years | 84 (5.1%) | 49 (2.9%) |
| 75 Years and over | 406 (24.1%) | 180 (7.6%) |
Disability Class: Vision Difficulty
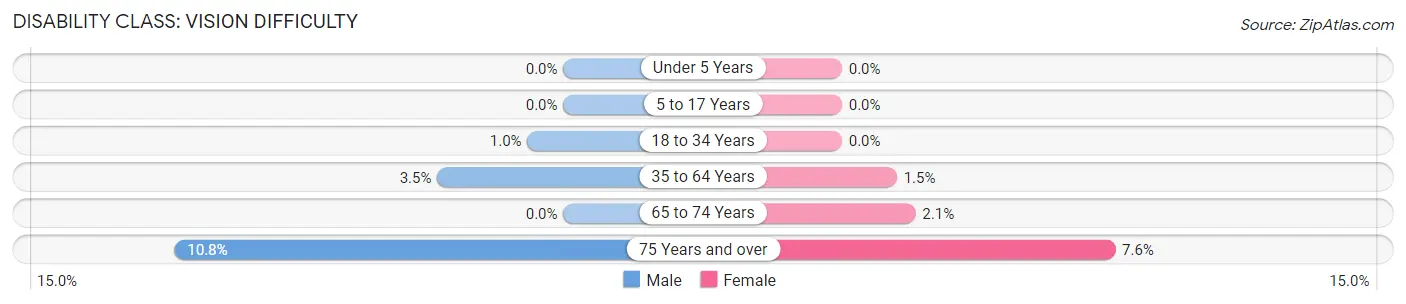
| Age Bracket | Male | Female |
| Under 5 Years | 0 (0.0%) | 0 (0.0%) |
| 5 to 17 Years | 0 (0.0%) | 0 (0.0%) |
| 18 to 34 Years | 15 (1.0%) | 0 (0.0%) |
| 35 to 64 Years | 183 (3.5%) | 83 (1.5%) |
| 65 to 74 Years | 0 (0.0%) | 35 (2.1%) |
| 75 Years and over | 182 (10.8%) | 180 (7.6%) |
Disability Class: Cognitive Difficulty
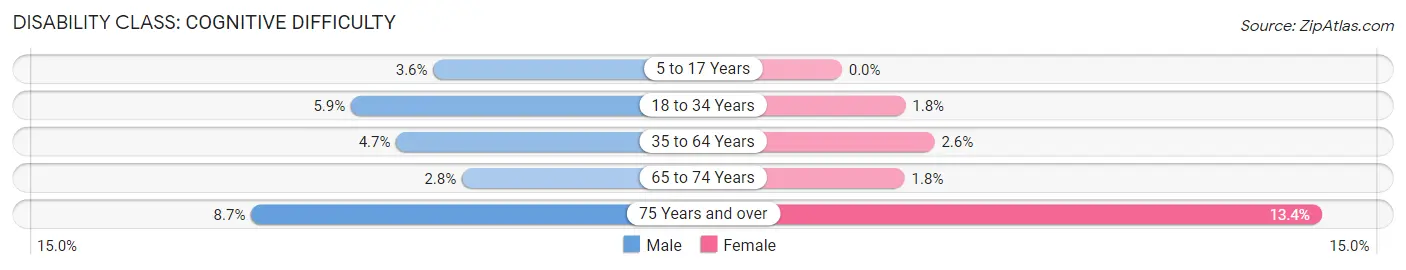
| Age Bracket | Male | Female |
| 5 to 17 Years | 66 (3.6%) | 0 (0.0%) |
| 18 to 34 Years | 89 (5.9%) | 29 (1.8%) |
| 35 to 64 Years | 242 (4.6%) | 140 (2.6%) |
| 65 to 74 Years | 46 (2.8%) | 30 (1.8%) |
| 75 Years and over | 146 (8.7%) | 316 (13.4%) |
Disability Class: Ambulatory Difficulty
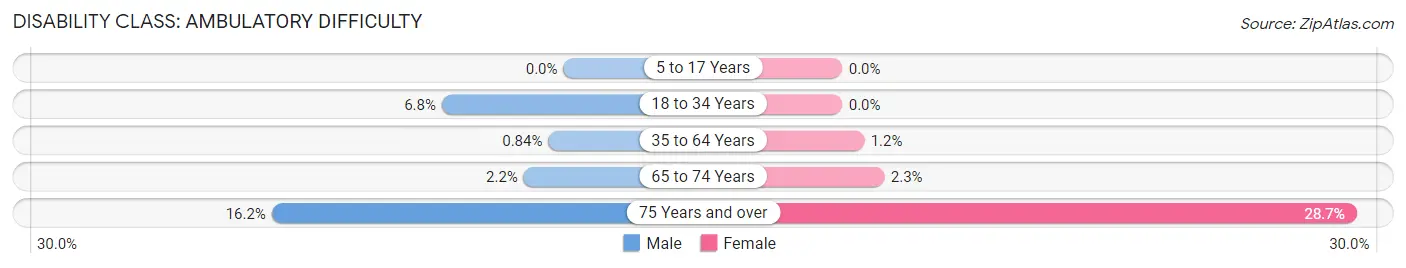
| Age Bracket | Male | Female |
| 5 to 17 Years | 0 (0.0%) | 0 (0.0%) |
| 18 to 34 Years | 102 (6.8%) | 0 (0.0%) |
| 35 to 64 Years | 44 (0.8%) | 66 (1.2%) |
| 65 to 74 Years | 36 (2.2%) | 40 (2.3%) |
| 75 Years and over | 273 (16.2%) | 678 (28.7%) |
Disability Class: Self-Care Difficulty
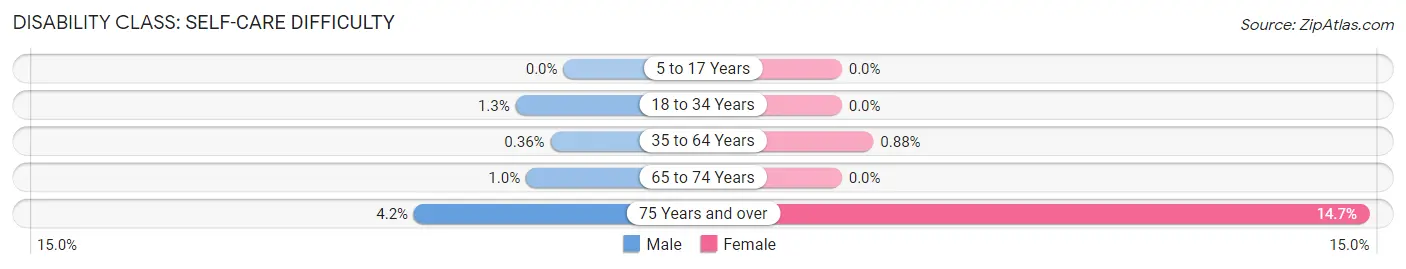
| Age Bracket | Male | Female |
| 5 to 17 Years | 0 (0.0%) | 0 (0.0%) |
| 18 to 34 Years | 20 (1.3%) | 0 (0.0%) |
| 35 to 64 Years | 19 (0.4%) | 48 (0.9%) |
| 65 to 74 Years | 17 (1.0%) | 0 (0.0%) |
| 75 Years and over | 70 (4.2%) | 347 (14.7%) |
Technology Access in Palm City
Computing Device Access in Palm City
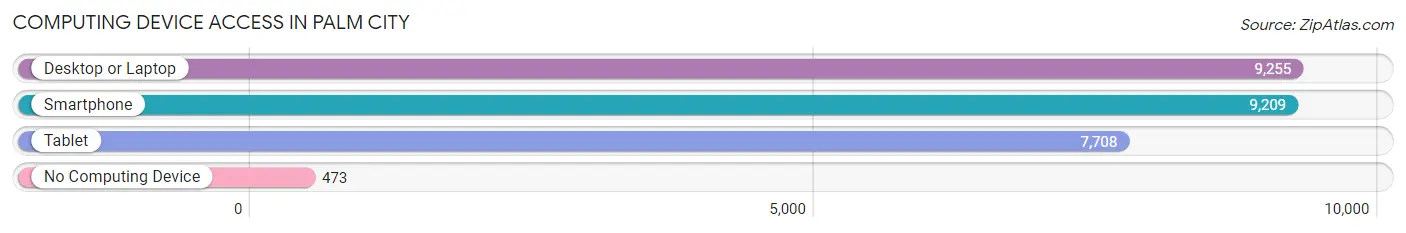
| Device Type | # Households | % Households |
| Desktop or Laptop | 9,255 | 89.9% |
| Smartphone | 9,209 | 89.5% |
| Tablet | 7,708 | 74.9% |
| No Computing Device | 473 | 4.6% |
| Total | 10,289 | 100.0% |
Internet Access in Palm City
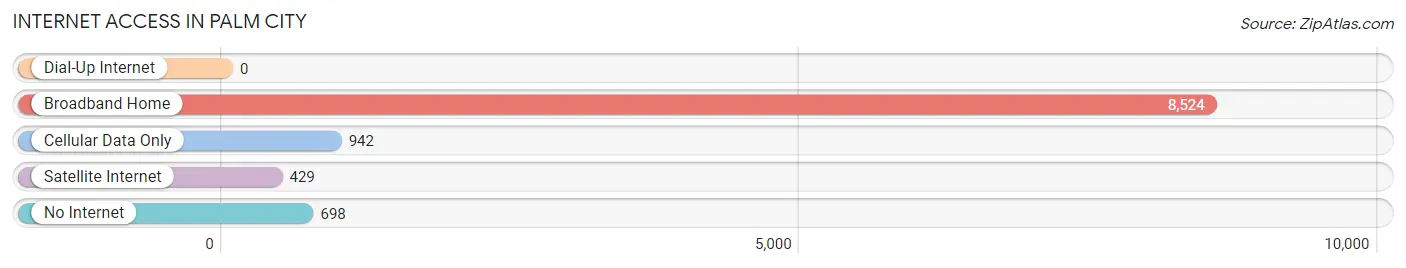
| Internet Type | # Households | % Households |
| Dial-Up Internet | 0 | 0.0% |
| Broadband Home | 8,524 | 82.9% |
| Cellular Data Only | 942 | 9.2% |
| Satellite Internet | 429 | 4.2% |
| No Internet | 698 | 6.8% |
| Total | 10,289 | 100.0% |
Palm City Summary
Palm City is a small city located in Martin County, Florida, United States. It is situated on the Atlantic Coast, about halfway between Miami and West Palm Beach. The city has a population of approximately 22,000 people, and is part of the Port St. Lucie-Fort Pierce Metropolitan Statistical Area.
Geography
Palm City is located in the Treasure Coast region of Florida, along the Atlantic Coast. It is situated on the St. Lucie River, which is part of the Indian River Lagoon system. The city is bordered by the cities of Stuart to the north, Port St. Lucie to the south, and Hobe Sound to the east. The city covers an area of approximately 8.5 square miles, and has a total land area of 6.7 square miles.
Climate
Palm City has a humid subtropical climate, with hot and humid summers and mild winters. The average temperature in the summer months is around 90°F, while in the winter months it is around 70°F. The city receives an average of 54 inches of rain per year, with the wettest months being June and July.
Demographics
As of the 2010 census, the population of Palm City was 22,092. The racial makeup of the city was 87.3% White, 5.3% African American, 0.4% Native American, 2.2% Asian, 0.1% Pacific Islander, 2.3% from other races, and 2.4% from two or more races. Hispanic or Latino of any race were 8.3% of the population.
Economy
Palm City is home to a variety of businesses, including retail stores, restaurants, and professional services. The city is also home to several large employers, including Martin Memorial Health Systems, Martin County School District, and the Martin County Sheriff's Office. The city is also home to several golf courses, which attract tourists from around the world.
History
Palm City was founded in the late 19th century by settlers from the Bahamas. The city was originally known as "Little Bahamas," and was home to a large population of Bahamian immigrants. The city was incorporated in 1925, and was named after the palm trees that grew in the area. In the 1950s, the city began to experience rapid growth, as many people moved to the area to take advantage of the city's proximity to the Atlantic Ocean. In the 1970s, the city experienced a population boom, as many people moved to the area to take advantage of the city's growing economy.
Today, Palm City is a thriving city, with a strong economy and a diverse population. The city is home to a variety of businesses, and is a popular tourist destination. The city is also home to several parks and recreational areas, making it a great place to live and visit.
Common Questions
What is Per Capita Income in Palm City?
Per Capita income in Palm City is $62,234.
What is the Median Family Income in Palm City?
Median Family Income in Palm City is $130,813.
What is the Median Household income in Palm City?
Median Household Income in Palm City is $111,394.
What is Income or Wage Gap in Palm City?
Income or Wage Gap in Palm City is 58.5%.
Women in Palm City earn 41.5 cents for every dollar earned by a man.
What is Inequality or Gini Index in Palm City?
Inequality or Gini Index in Palm City is 0.46.
What is the Total Population of Palm City?
Total Population of Palm City is 25,957.
What is the Total Male Population of Palm City?
Total Male Population of Palm City is 12,297.
What is the Total Female Population of Palm City?
Total Female Population of Palm City is 13,660.
What is the Ratio of Males per 100 Females in Palm City?
There are 90.02 Males per 100 Females in Palm City.
What is the Ratio of Females per 100 Males in Palm City?
There are 111.08 Females per 100 Males in Palm City.
What is the Median Population Age in Palm City?
Median Population Age in Palm City is 51.0 Years.
What is the Average Family Size in Palm City
Average Family Size in Palm City is 3.0 People.
What is the Average Household Size in Palm City
Average Household Size in Palm City is 2.5 People.
How Large is the Labor Force in Palm City?
There are 12,509 People in the Labor Forcein in Palm City.
What is the Percentage of People in the Labor Force in Palm City?
57.5% of People are in the Labor Force in Palm City.
What is the Unemployment Rate in Palm City?
Unemployment Rate in Palm City is 6.0%.