Apalachicola, FL Map & Demographics
Apalachicola Map
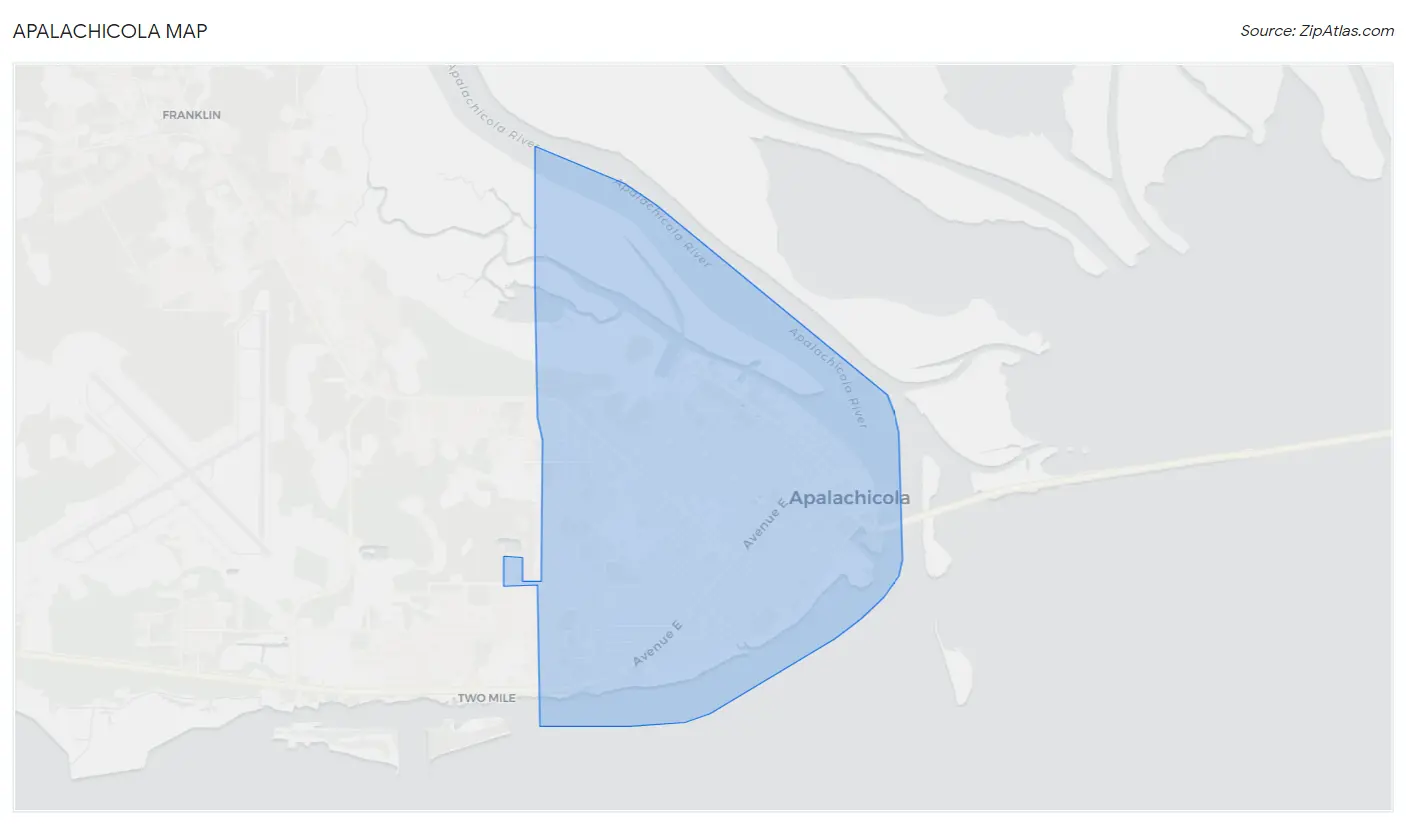
Apalachicola Overview
$36,053
PER CAPITA INCOME
$63,125
AVG FAMILY INCOME
$61,322
AVG HOUSEHOLD INCOME
5.5%
WAGE / INCOME GAP [ % ]
94.5¢/ $1
WAGE / INCOME GAP [ $ ]
0.46
INEQUALITY / GINI INDEX
2,504
TOTAL POPULATION
1,139
MALE POPULATION
1,365
FEMALE POPULATION
83.44
MALES / 100 FEMALES
119.84
FEMALES / 100 MALES
53.8
MEDIAN AGE
2.9
AVG FAMILY SIZE
2.2
AVG HOUSEHOLD SIZE
1,126
LABOR FORCE [ PEOPLE ]
51.0%
PERCENT IN LABOR FORCE
8.1%
UNEMPLOYMENT RATE
Apalachicola Zip Codes
Apalachicola Area Codes
Income in Apalachicola
Income Overview in Apalachicola
Per Capita Income in Apalachicola is $36,053, while median incomes of families and households are $63,125 and $61,322 respectively.
| Characteristic | Number | Measure |
| Per Capita Income | 2,504 | $36,053 |
| Median Family Income | 642 | $63,125 |
| Mean Family Income | 642 | $89,736 |
| Median Household Income | 1,149 | $61,322 |
| Mean Household Income | 1,149 | $75,221 |
| Income Deficit | 642 | $0 |
| Wage / Income Gap (%) | 2,504 | 5.48% |
| Wage / Income Gap ($) | 2,504 | 94.52¢ per $1 |
| Gini / Inequality Index | 2,504 | 0.46 |
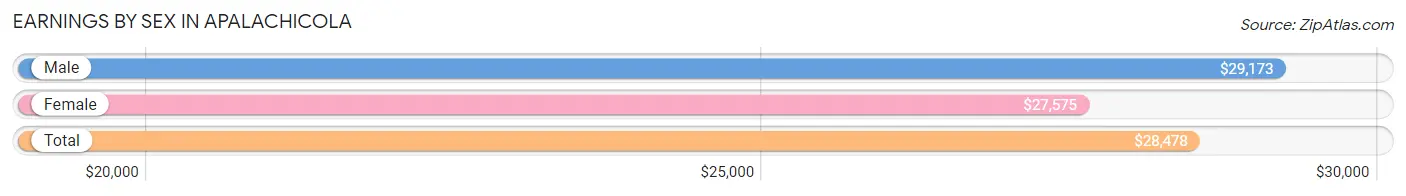
Earnings by Sex in Apalachicola
Average Earnings in Apalachicola are $28,478, $29,173 for men and $27,575 for women, a difference of 5.5%.
| Sex | Number | Average Earnings |
| Male | 561 (47.5%) | $29,173 |
| Female | 621 (52.5%) | $27,575 |
| Total | 1,182 (100.0%) | $28,478 |
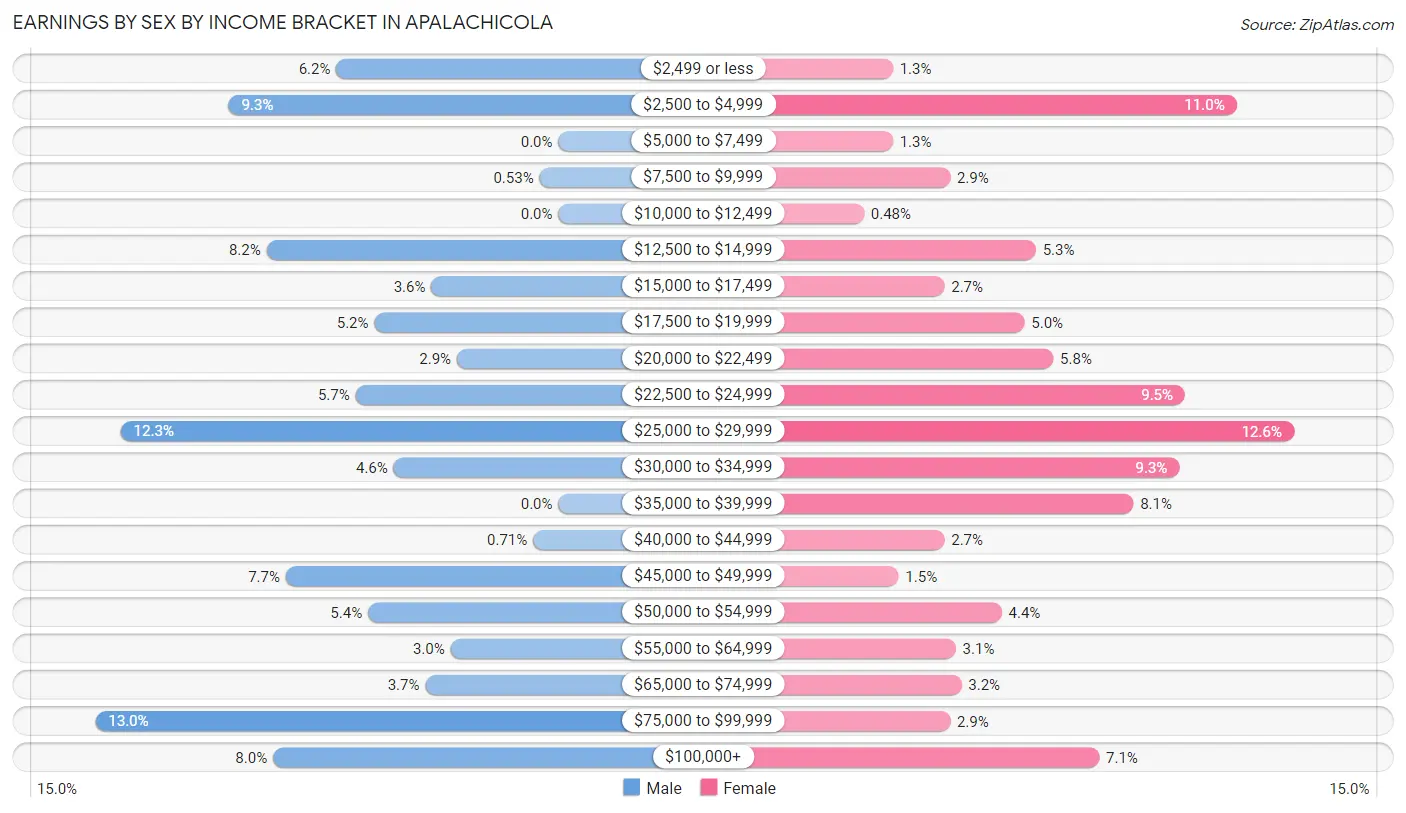
Earnings by Sex by Income Bracket in Apalachicola
The most common earnings brackets in Apalachicola are $75,000 to $99,999 for men (73 | 13.0%) and $25,000 to $29,999 for women (78 | 12.6%).
| Income | Male | Female |
| $2,499 or less | 35 (6.2%) | 8 (1.3%) |
| $2,500 to $4,999 | 52 (9.3%) | 68 (11.0%) |
| $5,000 to $7,499 | 0 (0.0%) | 8 (1.3%) |
| $7,500 to $9,999 | 3 (0.5%) | 18 (2.9%) |
| $10,000 to $12,499 | 0 (0.0%) | 3 (0.5%) |
| $12,500 to $14,999 | 46 (8.2%) | 33 (5.3%) |
| $15,000 to $17,499 | 20 (3.6%) | 17 (2.7%) |
| $17,500 to $19,999 | 29 (5.2%) | 31 (5.0%) |
| $20,000 to $22,499 | 16 (2.9%) | 36 (5.8%) |
| $22,500 to $24,999 | 32 (5.7%) | 59 (9.5%) |
| $25,000 to $29,999 | 69 (12.3%) | 78 (12.6%) |
| $30,000 to $34,999 | 26 (4.6%) | 58 (9.3%) |
| $35,000 to $39,999 | 0 (0.0%) | 50 (8.1%) |
| $40,000 to $44,999 | 4 (0.7%) | 17 (2.7%) |
| $45,000 to $49,999 | 43 (7.7%) | 9 (1.5%) |
| $50,000 to $54,999 | 30 (5.3%) | 27 (4.3%) |
| $55,000 to $64,999 | 17 (3.0%) | 19 (3.1%) |
| $65,000 to $74,999 | 21 (3.7%) | 20 (3.2%) |
| $75,000 to $99,999 | 73 (13.0%) | 18 (2.9%) |
| $100,000+ | 45 (8.0%) | 44 (7.1%) |
| Total | 561 (100.0%) | 621 (100.0%) |
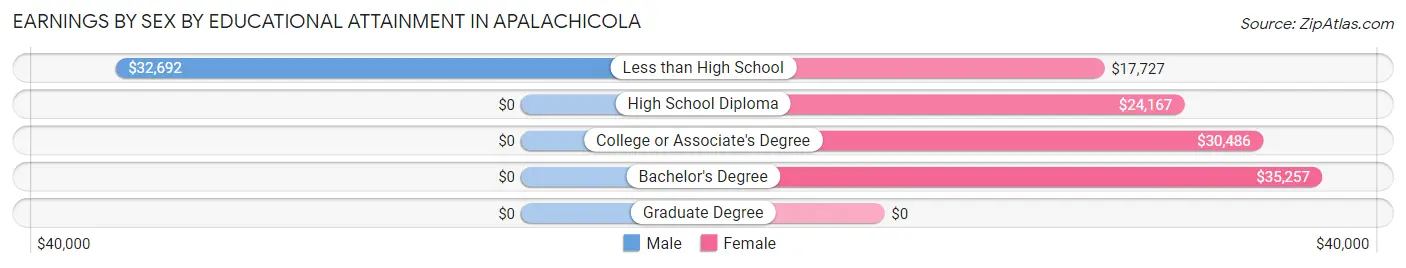
Earnings by Sex by Educational Attainment in Apalachicola
Average earnings in Apalachicola are $29,269 for men and $28,800 for women, a difference of 1.6%. Men with an educational attainment of less than high school enjoy the highest average annual earnings of $32,692, while those with less than high school education earn the least with $32,692. Women with an educational attainment of bachelor's degree earn the most with the average annual earnings of $35,257, while those with less than high school education have the smallest earnings of $17,727.
| Educational Attainment | Male Income | Female Income |
| Less than High School | $32,692 | $17,727 |
| High School Diploma | - | - |
| College or Associate's Degree | - | - |
| Bachelor's Degree | - | - |
| Graduate Degree | - | - |
| Total | $29,269 | $28,800 |
Family Income in Apalachicola
Family Income Brackets in Apalachicola
According to the Apalachicola family income data, there are 184 families falling into the $50,000 to $74,999 income range, which is the most common income bracket and makes up 28.7% of all families. Conversely, the $10,000 to $14,999 income bracket is the least frequent group with only 2 families (0.3%) belonging to this category.
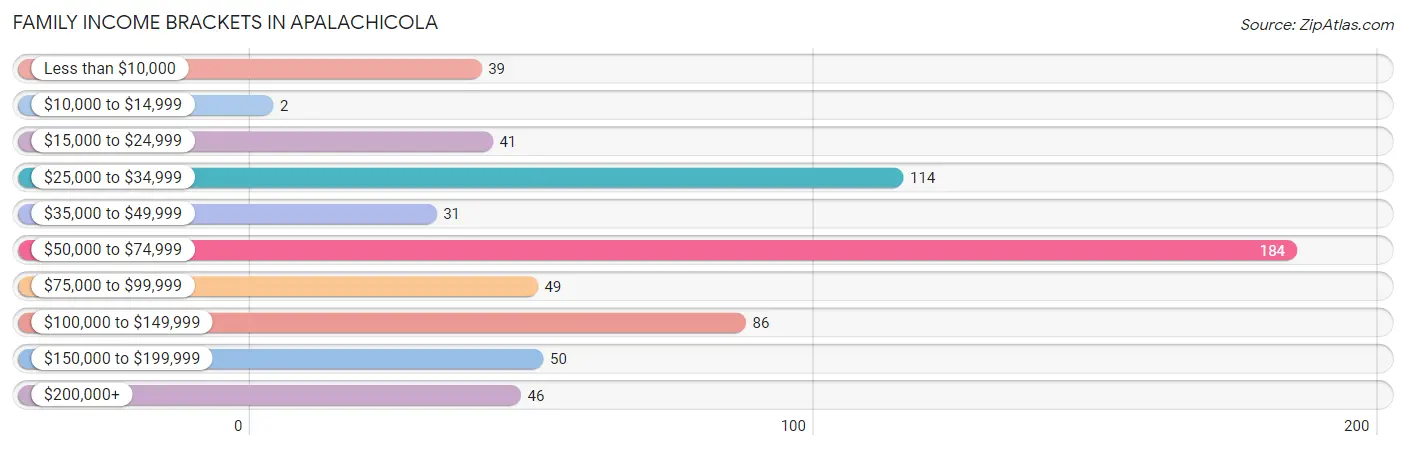
| Income Bracket | # Families | % Families |
| Less than $10,000 | 39 | 6.1% |
| $10,000 to $14,999 | 2 | 0.3% |
| $15,000 to $24,999 | 41 | 6.4% |
| $25,000 to $34,999 | 114 | 17.8% |
| $35,000 to $49,999 | 31 | 4.8% |
| $50,000 to $74,999 | 184 | 28.7% |
| $75,000 to $99,999 | 49 | 7.6% |
| $100,000 to $149,999 | 86 | 13.4% |
| $150,000 to $199,999 | 50 | 7.8% |
| $200,000+ | 46 | 7.2% |
Family Income by Famaliy Size in Apalachicola
2-person families (374 | 58.3%) account for the highest median family income in Apalachicola with $71,912 per family, while 2-person families (374 | 58.3%) have the highest median income of $35,956 per family member.
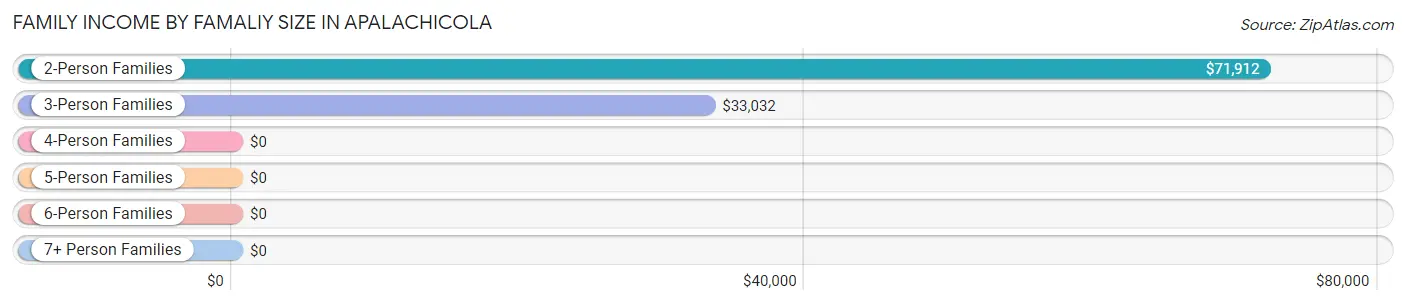
| Income Bracket | # Families | Median Income |
| 2-Person Families | 374 (58.3%) | $71,912 |
| 3-Person Families | 186 (29.0%) | $33,032 |
| 4-Person Families | 60 (9.3%) | $0 |
| 5-Person Families | 14 (2.2%) | $0 |
| 6-Person Families | 0 (0.0%) | $0 |
| 7+ Person Families | 8 (1.3%) | $0 |
| Total | 642 (100.0%) | $63,125 |
Family Income by Number of Earners in Apalachicola
The median family income in Apalachicola is $63,125, with families comprising 2 earners (143) having the highest median family income of $82,679, while families with no earners (150) have the lowest median family income of $58,942, accounting for 22.3% and 23.4% of families, respectively.
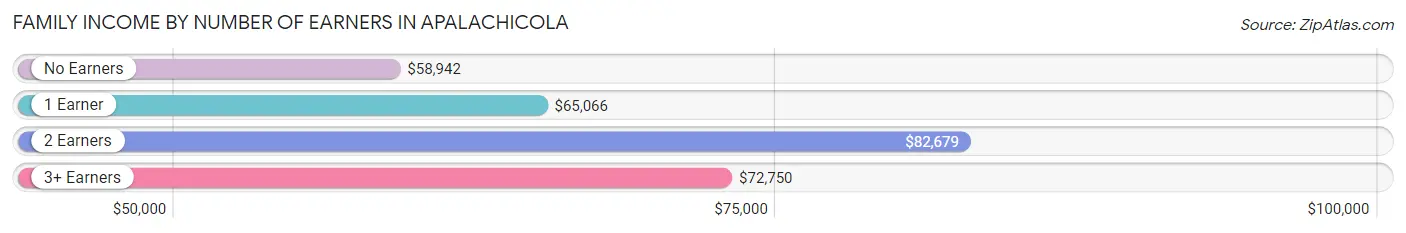
| Number of Earners | # Families | Median Income |
| No Earners | 150 (23.4%) | $58,942 |
| 1 Earner | 295 (46.0%) | $65,066 |
| 2 Earners | 143 (22.3%) | $82,679 |
| 3+ Earners | 54 (8.4%) | $72,750 |
| Total | 642 (100.0%) | $63,125 |
Household Income in Apalachicola
Household Income Brackets in Apalachicola
With 327 households falling in the category, the $50,000 to $74,999 income range is the most frequent in Apalachicola, accounting for 28.5% of all households. In contrast, only 46 households (4.0%) fall into the $200,000+ income bracket, making it the least populous group.
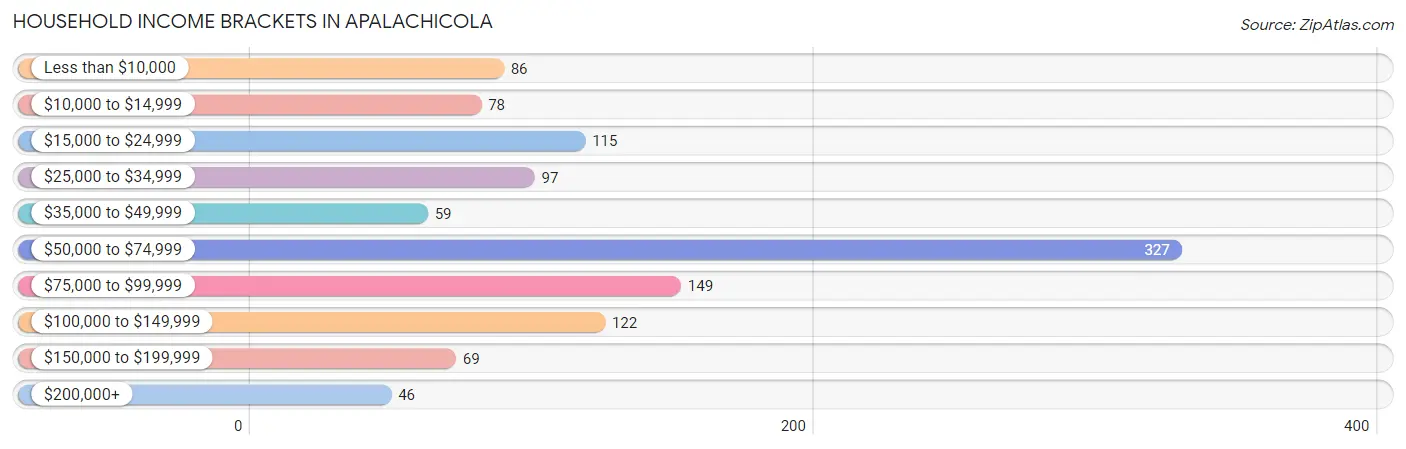
| Income Bracket | # Households | % Households |
| Less than $10,000 | 86 | 7.5% |
| $10,000 to $14,999 | 78 | 6.8% |
| $15,000 to $24,999 | 115 | 10.0% |
| $25,000 to $34,999 | 97 | 8.4% |
| $35,000 to $49,999 | 59 | 5.1% |
| $50,000 to $74,999 | 327 | 28.5% |
| $75,000 to $99,999 | 149 | 13.0% |
| $100,000 to $149,999 | 122 | 10.6% |
| $150,000 to $199,999 | 69 | 6.0% |
| $200,000+ | 46 | 4.0% |
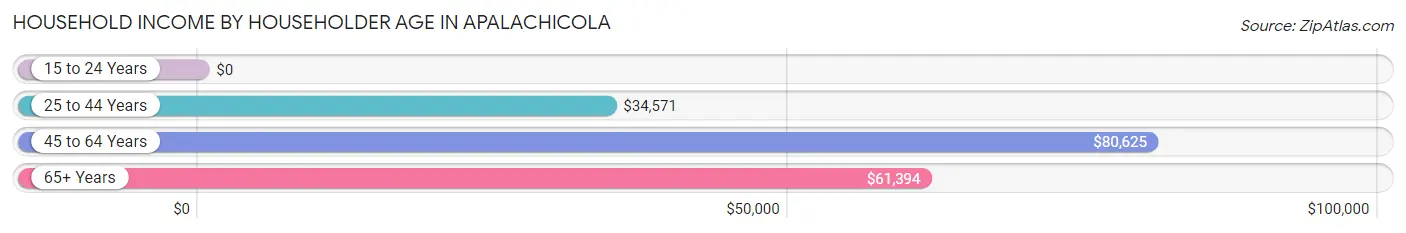
Household Income by Householder Age in Apalachicola
The median household income in Apalachicola is $61,322, with the highest median household income of $80,625 found in the 45 to 64 years age bracket for the primary householder. A total of 458 households (39.9%) fall into this category.
| Income Bracket | # Households | Median Income |
| 15 to 24 Years | 0 (0.0%) | $0 |
| 25 to 44 Years | 216 (18.8%) | $34,571 |
| 45 to 64 Years | 458 (39.9%) | $80,625 |
| 65+ Years | 475 (41.3%) | $61,394 |
| Total | 1,149 (100.0%) | $61,322 |
Poverty in Apalachicola
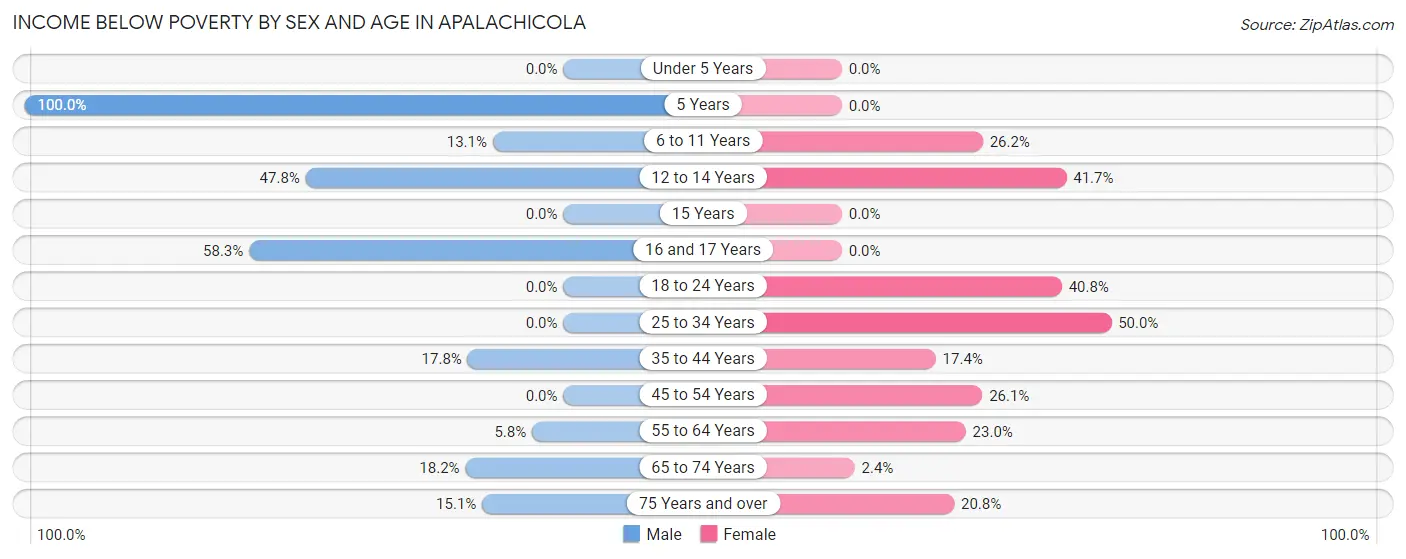
Income Below Poverty by Sex and Age in Apalachicola
With 12.0% poverty level for males and 22.9% for females among the residents of Apalachicola, 5 year old males and 25 to 34 year old females are the most vulnerable to poverty, with 20 males (100.0%) and 86 females (50.0%) in their respective age groups living below the poverty level.
| Age Bracket | Male | Female |
| Under 5 Years | 0 (0.0%) | 0 (0.0%) |
| 5 Years | 20 (100.0%) | 0 (0.0%) |
| 6 to 11 Years | 11 (13.1%) | 17 (26.2%) |
| 12 to 14 Years | 11 (47.8%) | 5 (41.7%) |
| 15 Years | 0 (0.0%) | 0 (0.0%) |
| 16 and 17 Years | 7 (58.3%) | 0 (0.0%) |
| 18 to 24 Years | 0 (0.0%) | 20 (40.8%) |
| 25 to 34 Years | 0 (0.0%) | 86 (50.0%) |
| 35 to 44 Years | 19 (17.8%) | 31 (17.4%) |
| 45 to 54 Years | 0 (0.0%) | 49 (26.1%) |
| 55 to 64 Years | 15 (5.8%) | 60 (23.0%) |
| 65 to 74 Years | 30 (18.2%) | 5 (2.4%) |
| 75 Years and over | 22 (15.1%) | 35 (20.8%) |
| Total | 135 (12.0%) | 308 (22.9%) |
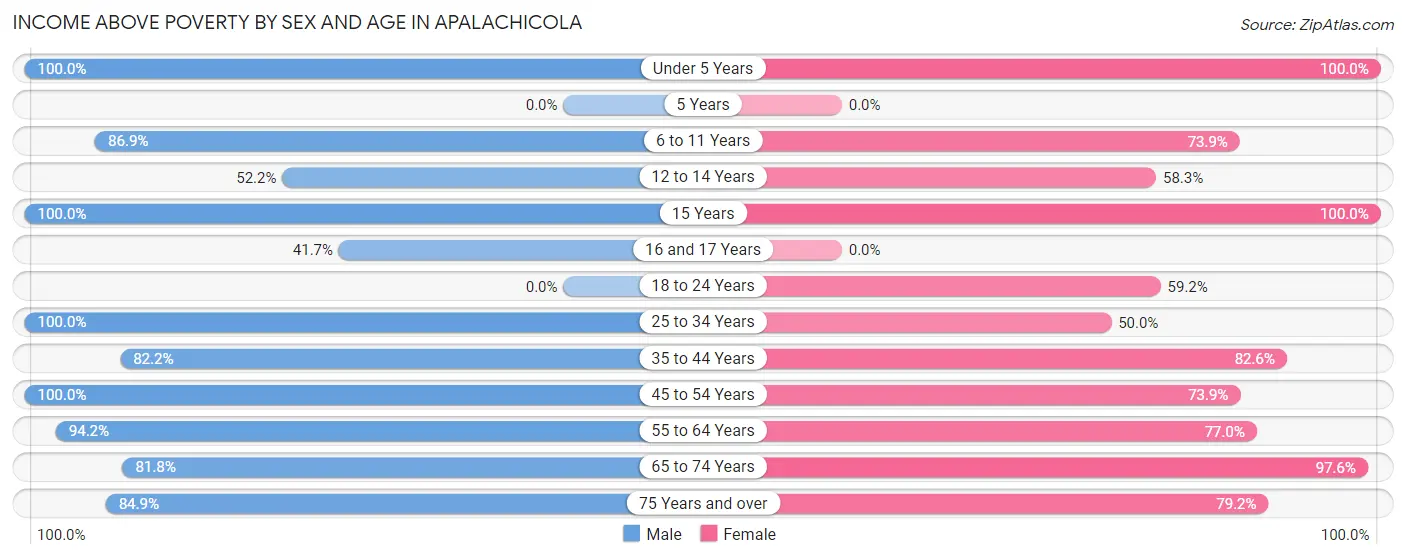
Income Above Poverty by Sex and Age in Apalachicola
According to the poverty statistics in Apalachicola, males aged under 5 years and females aged under 5 years are the age groups that are most secure financially, with 100.0% of males and 100.0% of females in these age groups living above the poverty line.
| Age Bracket | Male | Female |
| Under 5 Years | 23 (100.0%) | 31 (100.0%) |
| 5 Years | 0 (0.0%) | 0 (0.0%) |
| 6 to 11 Years | 73 (86.9%) | 48 (73.9%) |
| 12 to 14 Years | 12 (52.2%) | 7 (58.3%) |
| 15 Years | 7 (100.0%) | 9 (100.0%) |
| 16 and 17 Years | 5 (41.7%) | 0 (0.0%) |
| 18 to 24 Years | 0 (0.0%) | 29 (59.2%) |
| 25 to 34 Years | 147 (100.0%) | 86 (50.0%) |
| 35 to 44 Years | 88 (82.2%) | 147 (82.6%) |
| 45 to 54 Years | 133 (100.0%) | 139 (73.9%) |
| 55 to 64 Years | 243 (94.2%) | 201 (77.0%) |
| 65 to 74 Years | 135 (81.8%) | 205 (97.6%) |
| 75 Years and over | 124 (84.9%) | 133 (79.2%) |
| Total | 990 (88.0%) | 1,035 (77.1%) |
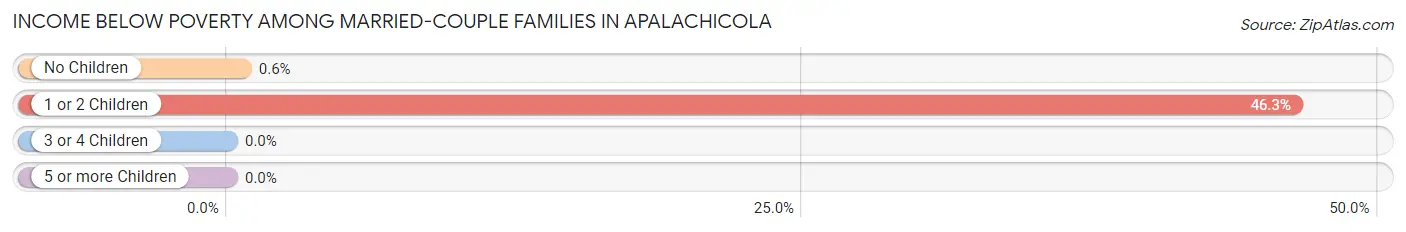
Income Below Poverty Among Married-Couple Families in Apalachicola
The poverty statistics for married-couple families in Apalachicola show that 5.5% or 21 of the total 382 families live below the poverty line. Families with 1 or 2 children have the highest poverty rate of 46.3%, comprising of 19 families. On the other hand, families with 5 or more children have the lowest poverty rate of 0.0%, which includes 0 families.
| Children | Above Poverty | Below Poverty |
| No Children | 331 (99.4%) | 2 (0.6%) |
| 1 or 2 Children | 22 (53.7%) | 19 (46.3%) |
| 3 or 4 Children | 0 (0.0%) | 0 (0.0%) |
| 5 or more Children | 8 (100.0%) | 0 (0.0%) |
| Total | 361 (94.5%) | 21 (5.5%) |
Income Below Poverty Among Single-Parent Households in Apalachicola
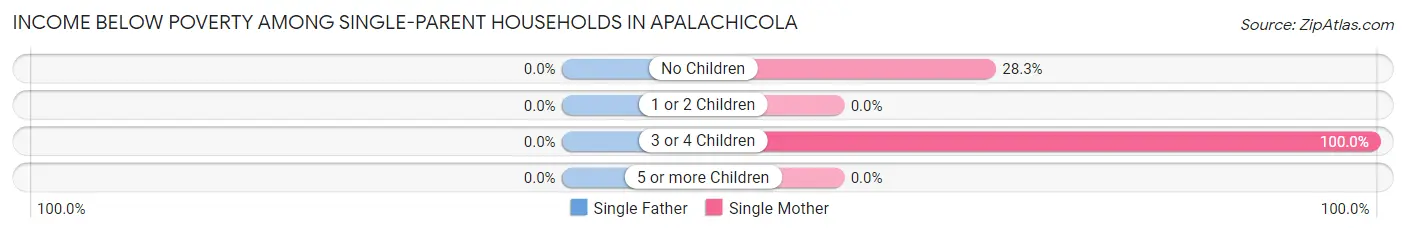
| Children | Single Father | Single Mother |
| No Children | 0 (0.0%) | 39 (28.3%) |
| 1 or 2 Children | 0 (0.0%) | 0 (0.0%) |
| 3 or 4 Children | 0 (0.0%) | 15 (100.0%) |
| 5 or more Children | 0 (0.0%) | 0 (0.0%) |
| Total | 0 (0.0%) | 54 (22.6%) |
Income Below Poverty Among Married-Couple vs Single-Parent Households in Apalachicola
The poverty data for Apalachicola shows that 21 of the married-couple family households (5.5%) and 54 of the single-parent households (20.8%) are living below the poverty level. Within the married-couple family households, those with 1 or 2 children have the highest poverty rate, with 19 households (46.3%) falling below the poverty line. Among the single-parent households, those with 3 or 4 children have the highest poverty rate, with 15 household (100.0%) living below poverty.
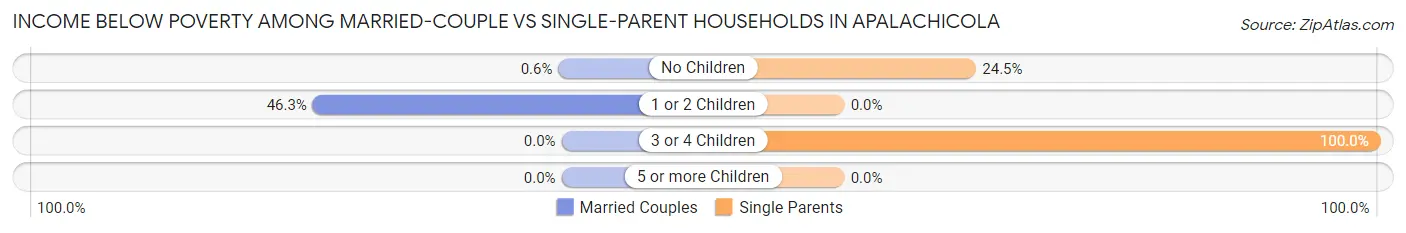
| Children | Married-Couple Families | Single-Parent Households |
| No Children | 2 (0.6%) | 39 (24.5%) |
| 1 or 2 Children | 19 (46.3%) | 0 (0.0%) |
| 3 or 4 Children | 0 (0.0%) | 15 (100.0%) |
| 5 or more Children | 0 (0.0%) | 0 (0.0%) |
| Total | 21 (5.5%) | 54 (20.8%) |
Race in Apalachicola
The most populous races in Apalachicola are White / Caucasian (1,675 | 66.9%), Black / African American (639 | 25.5%), and Two or more Races (117 | 4.7%).
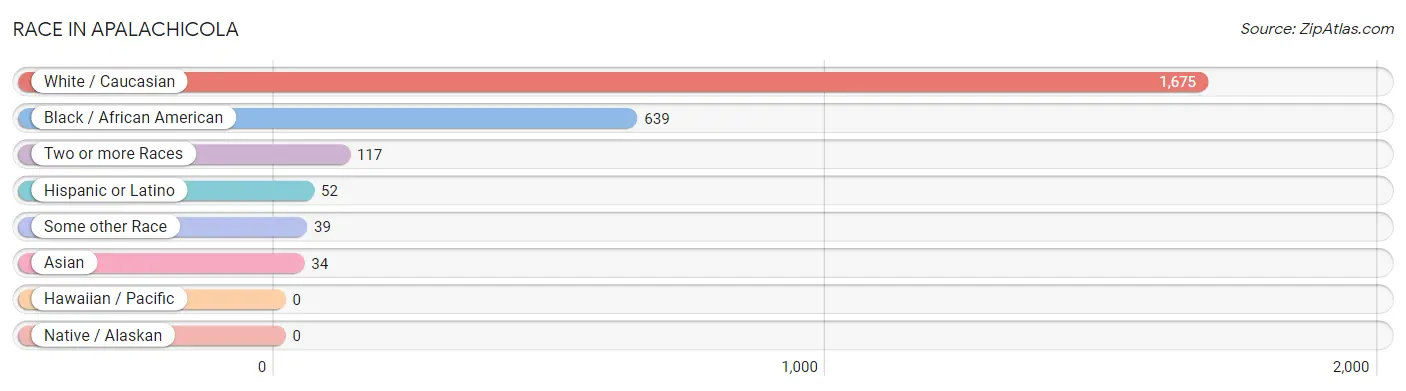
| Race | # Population | % Population |
| Asian | 34 | 1.4% |
| Black / African American | 639 | 25.5% |
| Hawaiian / Pacific | 0 | 0.0% |
| Hispanic or Latino | 52 | 2.1% |
| Native / Alaskan | 0 | 0.0% |
| White / Caucasian | 1,675 | 66.9% |
| Two or more Races | 117 | 4.7% |
| Some other Race | 39 | 1.6% |
| Total | 2,504 | 100.0% |
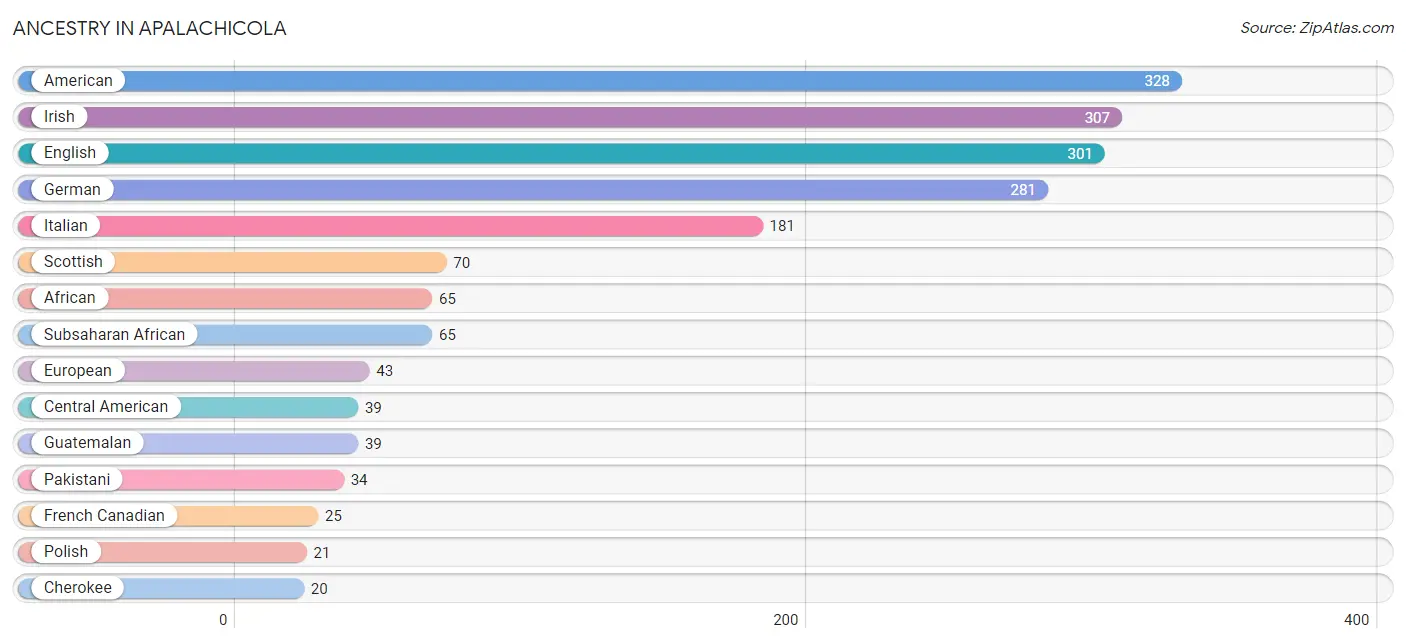
Ancestry in Apalachicola
The most populous ancestries reported in Apalachicola are American (328 | 13.1%), Irish (307 | 12.3%), English (301 | 12.0%), German (281 | 11.2%), and Italian (181 | 7.2%), together accounting for 55.8% of all Apalachicola residents.
| Ancestry | # Population | % Population |
| African | 65 | 2.6% |
| American | 328 | 13.1% |
| Brazilian | 6 | 0.2% |
| British | 8 | 0.3% |
| Central American | 39 | 1.6% |
| Cherokee | 20 | 0.8% |
| Cuban | 7 | 0.3% |
| Dutch | 7 | 0.3% |
| Eastern European | 10 | 0.4% |
| English | 301 | 12.0% |
| European | 43 | 1.7% |
| French | 6 | 0.2% |
| French Canadian | 25 | 1.0% |
| German | 281 | 11.2% |
| Guatemalan | 39 | 1.6% |
| Irish | 307 | 12.3% |
| Italian | 181 | 7.2% |
| Mexican | 6 | 0.2% |
| Norwegian | 6 | 0.2% |
| Pakistani | 34 | 1.4% |
| Polish | 21 | 0.8% |
| Portuguese | 6 | 0.2% |
| Russian | 6 | 0.2% |
| Scandinavian | 16 | 0.6% |
| Scottish | 70 | 2.8% |
| Subsaharan African | 65 | 2.6% |
| Swedish | 11 | 0.4% |
| Swiss | 13 | 0.5% |
| Welsh | 4 | 0.2% | View All 29 Rows |
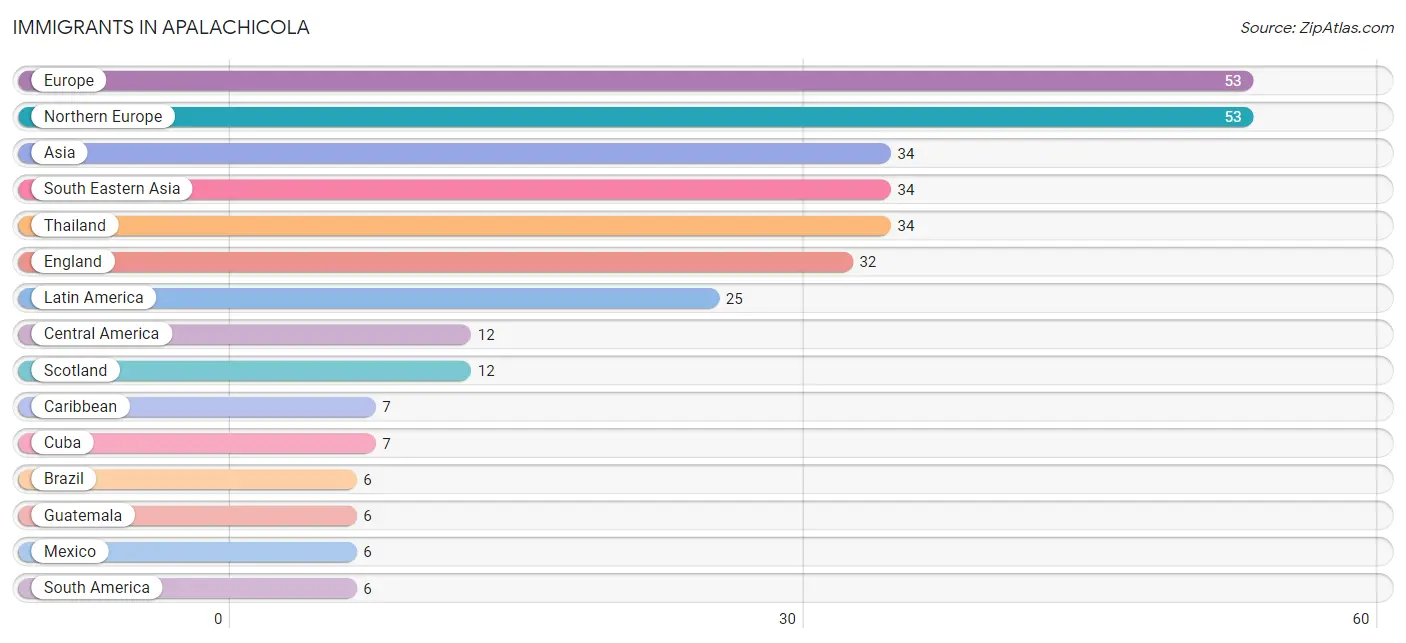
Immigrants in Apalachicola
The most numerous immigrant groups reported in Apalachicola came from Europe (53 | 2.1%), Northern Europe (53 | 2.1%), Asia (34 | 1.4%), South Eastern Asia (34 | 1.4%), and Thailand (34 | 1.4%), together accounting for 8.3% of all Apalachicola residents.
| Immigration Origin | # Population | % Population |
| Asia | 34 | 1.4% |
| Brazil | 6 | 0.2% |
| Canada | 4 | 0.2% |
| Caribbean | 7 | 0.3% |
| Central America | 12 | 0.5% |
| Cuba | 7 | 0.3% |
| England | 32 | 1.3% |
| Europe | 53 | 2.1% |
| Guatemala | 6 | 0.2% |
| Latin America | 25 | 1.0% |
| Mexico | 6 | 0.2% |
| Northern Europe | 53 | 2.1% |
| Scotland | 12 | 0.5% |
| South America | 6 | 0.2% |
| South Eastern Asia | 34 | 1.4% |
| Thailand | 34 | 1.4% | View All 16 Rows |
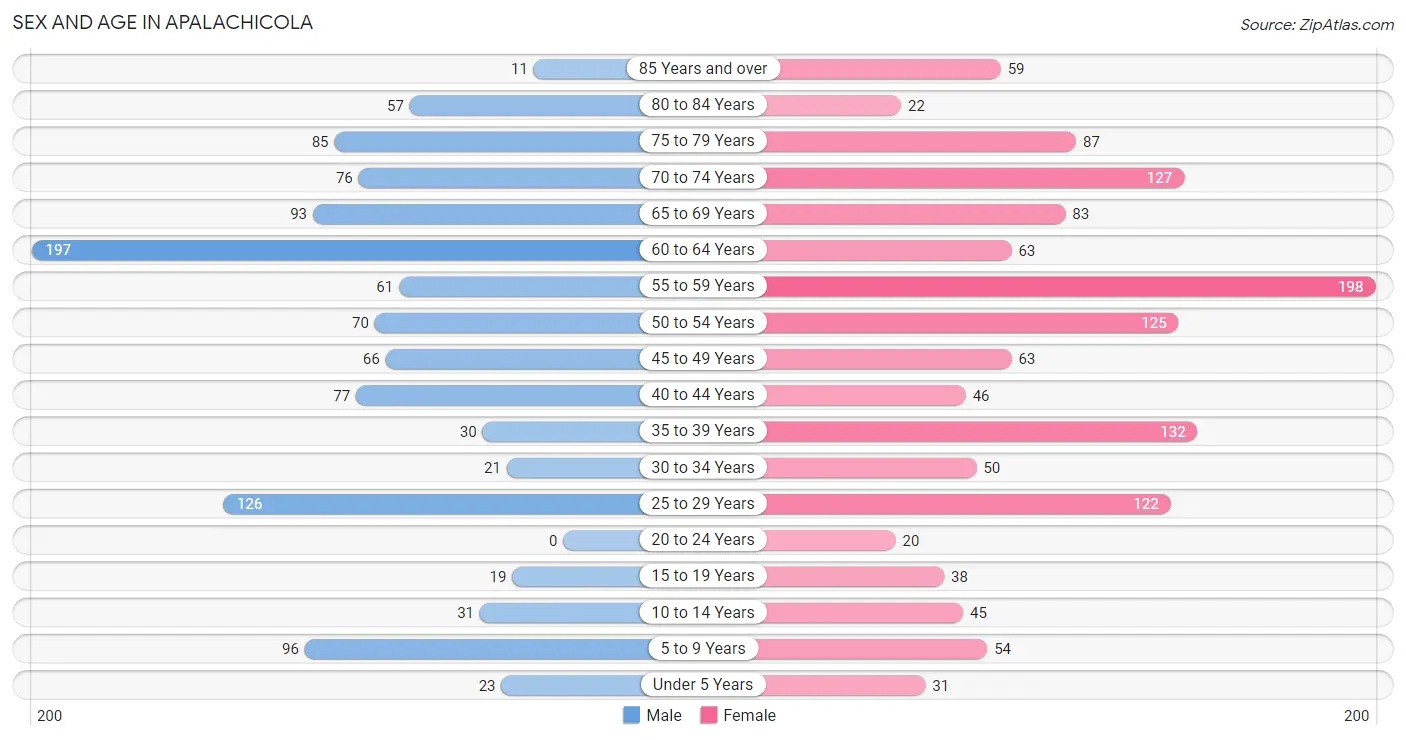
Sex and Age in Apalachicola
Sex and Age in Apalachicola
The most populous age groups in Apalachicola are 60 to 64 Years (197 | 17.3%) for men and 55 to 59 Years (198 | 14.5%) for women.
| Age Bracket | Male | Female |
| Under 5 Years | 23 (2.0%) | 31 (2.3%) |
| 5 to 9 Years | 96 (8.4%) | 54 (4.0%) |
| 10 to 14 Years | 31 (2.7%) | 45 (3.3%) |
| 15 to 19 Years | 19 (1.7%) | 38 (2.8%) |
| 20 to 24 Years | 0 (0.0%) | 20 (1.5%) |
| 25 to 29 Years | 126 (11.1%) | 122 (8.9%) |
| 30 to 34 Years | 21 (1.8%) | 50 (3.7%) |
| 35 to 39 Years | 30 (2.6%) | 132 (9.7%) |
| 40 to 44 Years | 77 (6.8%) | 46 (3.4%) |
| 45 to 49 Years | 66 (5.8%) | 63 (4.6%) |
| 50 to 54 Years | 70 (6.1%) | 125 (9.2%) |
| 55 to 59 Years | 61 (5.4%) | 198 (14.5%) |
| 60 to 64 Years | 197 (17.3%) | 63 (4.6%) |
| 65 to 69 Years | 93 (8.2%) | 83 (6.1%) |
| 70 to 74 Years | 76 (6.7%) | 127 (9.3%) |
| 75 to 79 Years | 85 (7.5%) | 87 (6.4%) |
| 80 to 84 Years | 57 (5.0%) | 22 (1.6%) |
| 85 Years and over | 11 (1.0%) | 59 (4.3%) |
| Total | 1,139 (100.0%) | 1,365 (100.0%) |
Families and Households in Apalachicola
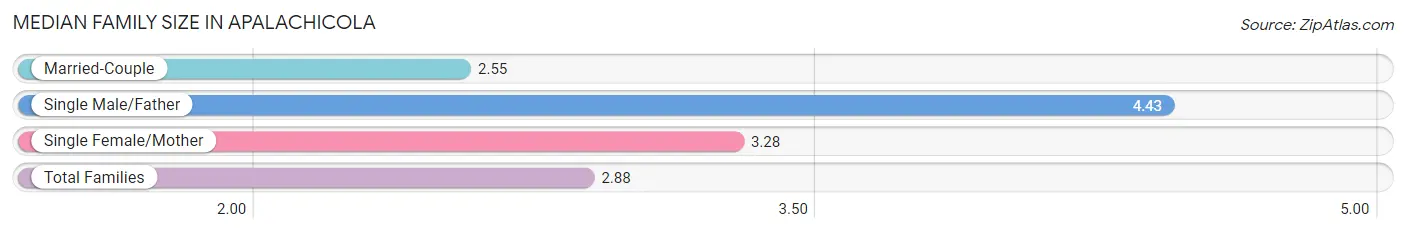
Median Family Size in Apalachicola
The median family size in Apalachicola is 2.88 persons per family, with single male/father families (21 | 3.3%) accounting for the largest median family size of 4.43 persons per family. On the other hand, married-couple families (382 | 59.5%) represent the smallest median family size with 2.55 persons per family.
| Family Type | # Families | Family Size |
| Married-Couple | 382 (59.5%) | 2.55 |
| Single Male/Father | 21 (3.3%) | 4.43 |
| Single Female/Mother | 239 (37.2%) | 3.28 |
| Total Families | 642 (100.0%) | 2.88 |
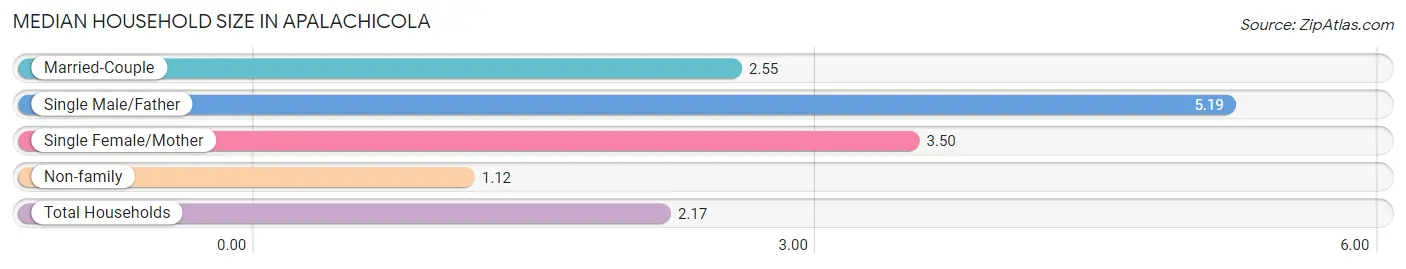
Median Household Size in Apalachicola
The median household size in Apalachicola is 2.17 persons per household, with single male/father households (21 | 1.8%) accounting for the largest median household size of 5.19 persons per household. non-family households (507 | 44.1%) represent the smallest median household size with 1.12 persons per household.
| Household Type | # Households | Household Size |
| Married-Couple | 382 (33.3%) | 2.55 |
| Single Male/Father | 21 (1.8%) | 5.19 |
| Single Female/Mother | 239 (20.8%) | 3.50 |
| Non-family | 507 (44.1%) | 1.12 |
| Total Households | 1,149 (100.0%) | 2.17 |
Household Size by Marriage Status in Apalachicola
Out of a total of 1,149 households in Apalachicola, 642 (55.9%) are family households, while 507 (44.1%) are nonfamily households. The most numerous type of family households are 2-person households, comprising 374, and the most common type of nonfamily households are 1-person households, comprising 395.
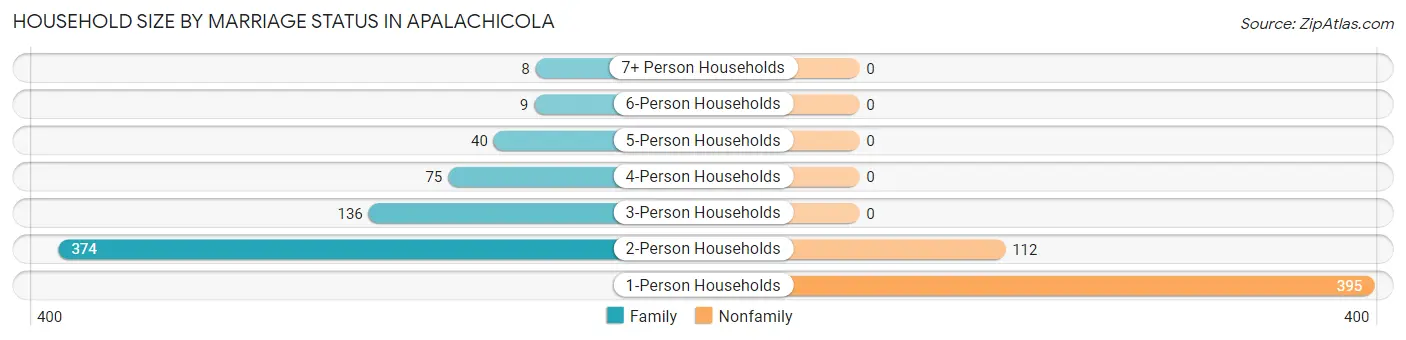
| Household Size | Family Households | Nonfamily Households |
| 1-Person Households | - | 395 (34.4%) |
| 2-Person Households | 374 (32.6%) | 112 (9.8%) |
| 3-Person Households | 136 (11.8%) | 0 (0.0%) |
| 4-Person Households | 75 (6.5%) | 0 (0.0%) |
| 5-Person Households | 40 (3.5%) | 0 (0.0%) |
| 6-Person Households | 9 (0.8%) | 0 (0.0%) |
| 7+ Person Households | 8 (0.7%) | 0 (0.0%) |
| Total | 642 (55.9%) | 507 (44.1%) |
Female Fertility in Apalachicola
Fertility by Age in Apalachicola
| Age Bracket | Women with Births | Births / 1,000 Women |
| 15 to 19 years | 0 (0.0%) | 0.0 |
| 20 to 34 years | 0 (0.0%) | 0.0 |
| 35 to 50 years | 0 (0.0%) | 0.0 |
| Total | 0 (0.0%) | 0.0 |
Fertility by Age by Marriage Status in Apalachicola
| Age Bracket | Married | Unmarried |
| 15 to 19 years | 0 (0.0%) | 0 (0.0%) |
| 20 to 34 years | 0 (0.0%) | 0 (0.0%) |
| 35 to 50 years | 0 (0.0%) | 0 (0.0%) |
| Total | 0 (0.0%) | 0 (0.0%) |
Fertility by Education in Apalachicola
| Educational Attainment | Women with Births | Births / 1,000 Women |
| Less than High School | 0 (0.0%) | 0.0 |
| High School Diploma | 0 (0.0%) | 0.0 |
| College or Associate's Degree | 0 (0.0%) | 0.0 |
| Bachelor's Degree | 0 (0.0%) | 0.0 |
| Graduate Degree | 0 (0.0%) | 0.0 |
| Total | 0 (0.0%) | 0.0 |
Fertility by Education by Marriage Status in Apalachicola
| Educational Attainment | Married | Unmarried |
| Less than High School | 0 (0.0%) | 0 (0.0%) |
| High School Diploma | 0 (0.0%) | 0 (0.0%) |
| College or Associate's Degree | 0 (0.0%) | 0 (0.0%) |
| Bachelor's Degree | 0 (0.0%) | 0 (0.0%) |
| Graduate Degree | 0 (0.0%) | 0 (0.0%) |
| Total | 0 (0.0%) | 0 (0.0%) |
Employment Characteristics in Apalachicola
Employment by Class of Employer in Apalachicola
Among the 1,013 employed individuals in Apalachicola, private company employees (491 | 48.5%), not-for-profit organizations (140 | 13.8%), and self-employed (not incorporated) (117 | 11.6%) make up the most common classes of employment.
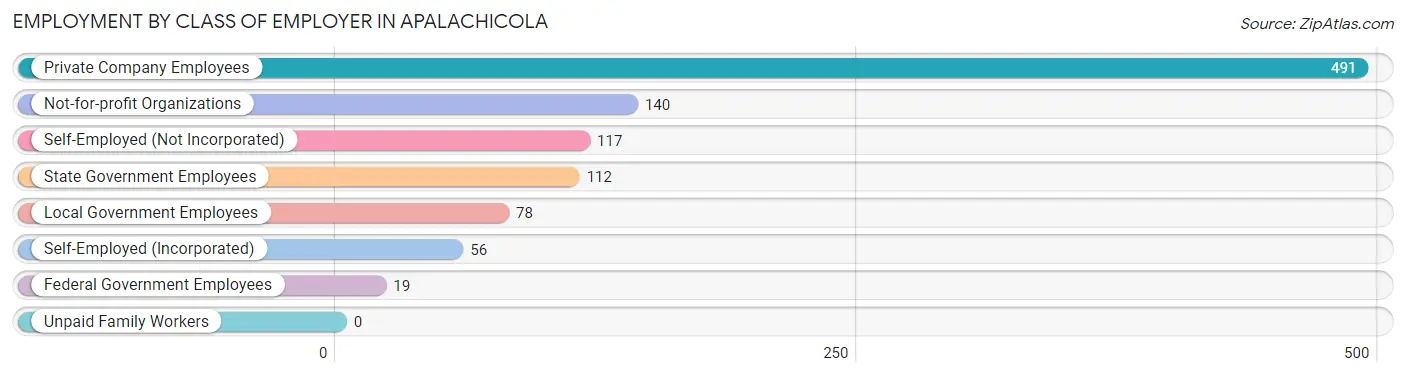
| Employer Class | # Employees | % Employees |
| Private Company Employees | 491 | 48.5% |
| Self-Employed (Incorporated) | 56 | 5.5% |
| Self-Employed (Not Incorporated) | 117 | 11.6% |
| Not-for-profit Organizations | 140 | 13.8% |
| Local Government Employees | 78 | 7.7% |
| State Government Employees | 112 | 11.1% |
| Federal Government Employees | 19 | 1.9% |
| Unpaid Family Workers | 0 | 0.0% |
| Total | 1,013 | 100.0% |
Employment Status by Age in Apalachicola
According to the labor force statistics for Apalachicola, out of the total population over 16 years of age (2,208), 51.0% or 1,126 individuals are in the labor force, with 8.1% or 91 of them unemployed. The age group with the highest labor force participation rate is 20 to 24 years, with 100.0% or 20 individuals in the labor force. Within the labor force, the 25 to 29 years age range has the highest percentage of unemployed individuals, with 20.1% or 28 of them being unemployed.
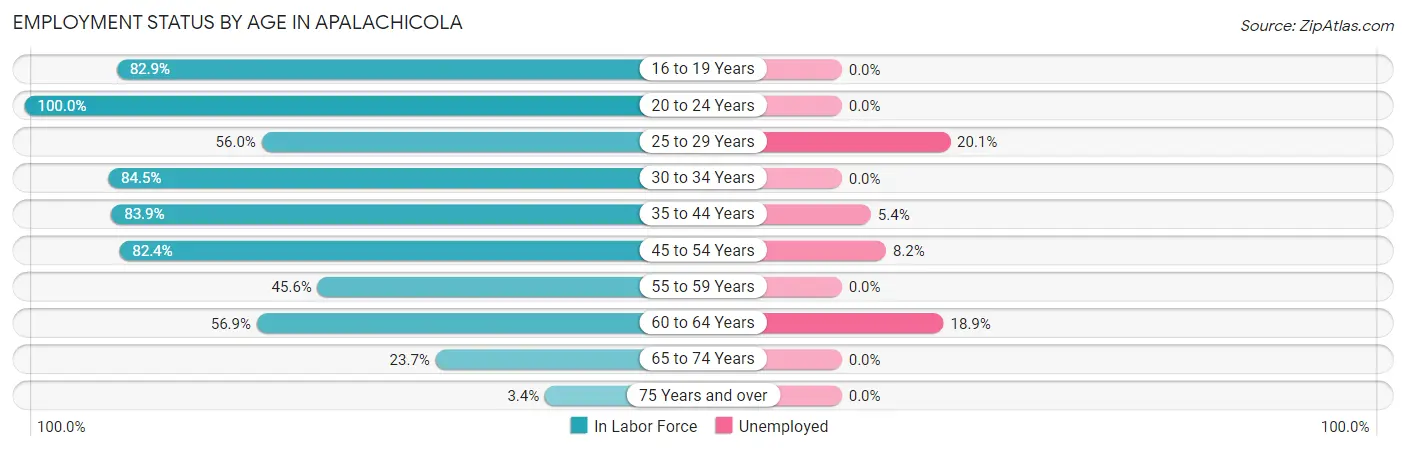
| Age Bracket | In Labor Force | Unemployed |
| 16 to 19 Years | 34 (82.9%) | 0 (0.0%) |
| 20 to 24 Years | 20 (100.0%) | 0 (0.0%) |
| 25 to 29 Years | 139 (56.0%) | 28 (20.1%) |
| 30 to 34 Years | 60 (84.5%) | 0 (0.0%) |
| 35 to 44 Years | 239 (83.9%) | 13 (5.4%) |
| 45 to 54 Years | 267 (82.4%) | 22 (8.2%) |
| 55 to 59 Years | 118 (45.6%) | 0 (0.0%) |
| 60 to 64 Years | 148 (56.9%) | 28 (18.9%) |
| 65 to 74 Years | 90 (23.7%) | 0 (0.0%) |
| 75 Years and over | 11 (3.4%) | 0 (0.0%) |
| Total | 1,126 (51.0%) | 91 (8.1%) |
Employment Status by Educational Attainment in Apalachicola
According to labor force statistics for Apalachicola, 67.1% of individuals (971) out of the total population between 25 and 64 years of age (1,447) are in the labor force, with 9.4% or 91 of them being unemployed. The group with the highest labor force participation rate are those with the educational attainment of bachelor's degree or higher, with 79.7% or 358 individuals in the labor force. Within the labor force, individuals with bachelor's degree or higher education have the highest percentage of unemployment, with 24.9% or 89 of them being unemployed.
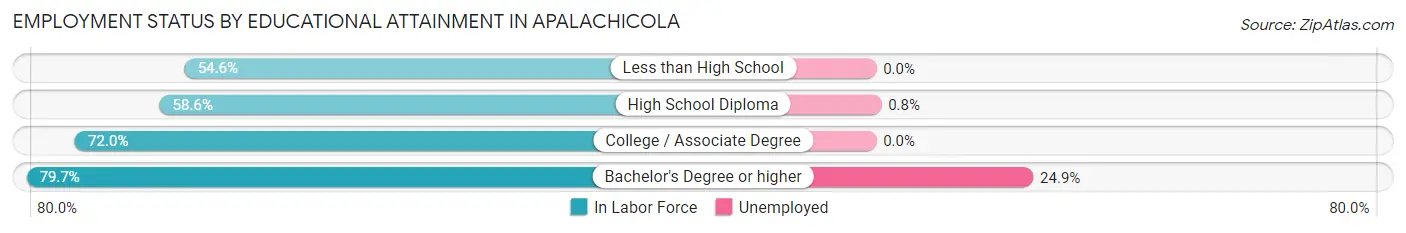
| Educational Attainment | In Labor Force | Unemployed |
| Less than High School | 154 (54.6%) | 0 (0.0%) |
| High School Diploma | 246 (58.6%) | 3 (0.8%) |
| College / Associate Degree | 213 (72.0%) | 0 (0.0%) |
| Bachelor's Degree or higher | 358 (79.7%) | 112 (24.9%) |
| Total | 971 (67.1%) | 136 (9.4%) |
Employment Occupations by Sex in Apalachicola
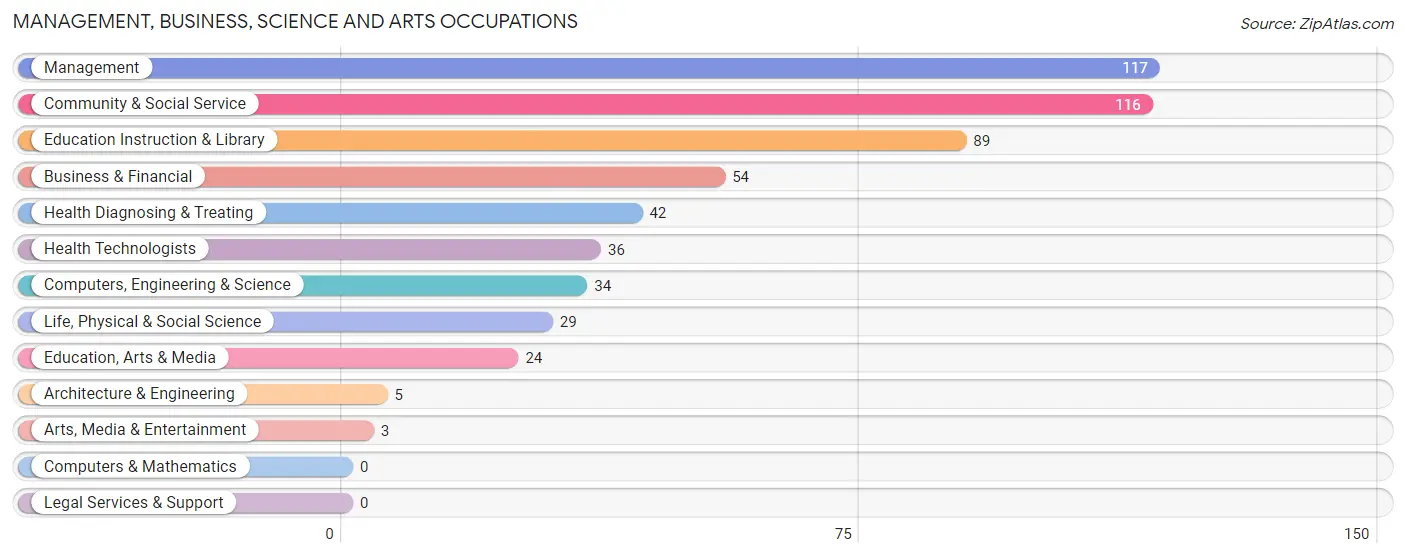
Management, Business, Science and Arts Occupations
The most common Management, Business, Science and Arts occupations in Apalachicola are Management (117 | 11.3%), Community & Social Service (116 | 11.2%), Education Instruction & Library (89 | 8.6%), Business & Financial (54 | 5.2%), and Health Diagnosing & Treating (42 | 4.1%).
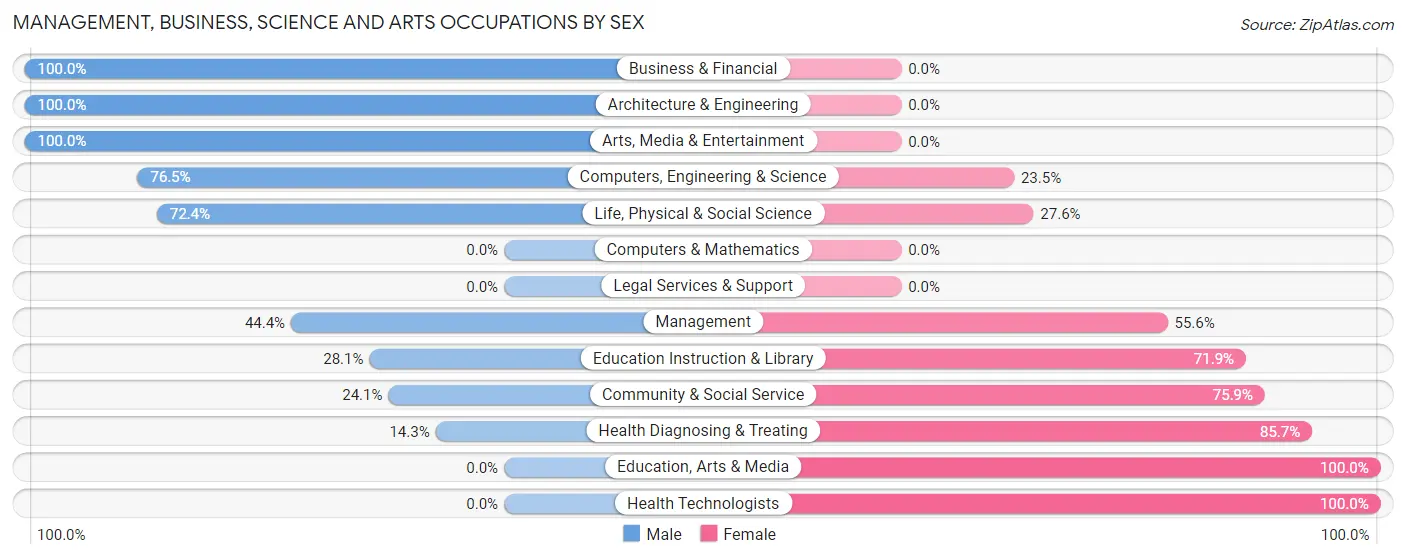
Management, Business, Science and Arts Occupations by Sex
Within the Management, Business, Science and Arts occupations in Apalachicola, the most male-oriented occupations are Business & Financial (100.0%), Architecture & Engineering (100.0%), and Arts, Media & Entertainment (100.0%), while the most female-oriented occupations are Education, Arts & Media (100.0%), Health Technologists (100.0%), and Health Diagnosing & Treating (85.7%).
| Occupation | Male | Female |
| Management | 52 (44.4%) | 65 (55.6%) |
| Business & Financial | 54 (100.0%) | 0 (0.0%) |
| Computers, Engineering & Science | 26 (76.5%) | 8 (23.5%) |
| Computers & Mathematics | 0 (0.0%) | 0 (0.0%) |
| Architecture & Engineering | 5 (100.0%) | 0 (0.0%) |
| Life, Physical & Social Science | 21 (72.4%) | 8 (27.6%) |
| Community & Social Service | 28 (24.1%) | 88 (75.9%) |
| Education, Arts & Media | 0 (0.0%) | 24 (100.0%) |
| Legal Services & Support | 0 (0.0%) | 0 (0.0%) |
| Education Instruction & Library | 25 (28.1%) | 64 (71.9%) |
| Arts, Media & Entertainment | 3 (100.0%) | 0 (0.0%) |
| Health Diagnosing & Treating | 6 (14.3%) | 36 (85.7%) |
| Health Technologists | 0 (0.0%) | 36 (100.0%) |
| Total (Category) | 166 (45.7%) | 197 (54.3%) |
| Total (Overall) | 494 (47.7%) | 541 (52.3%) |
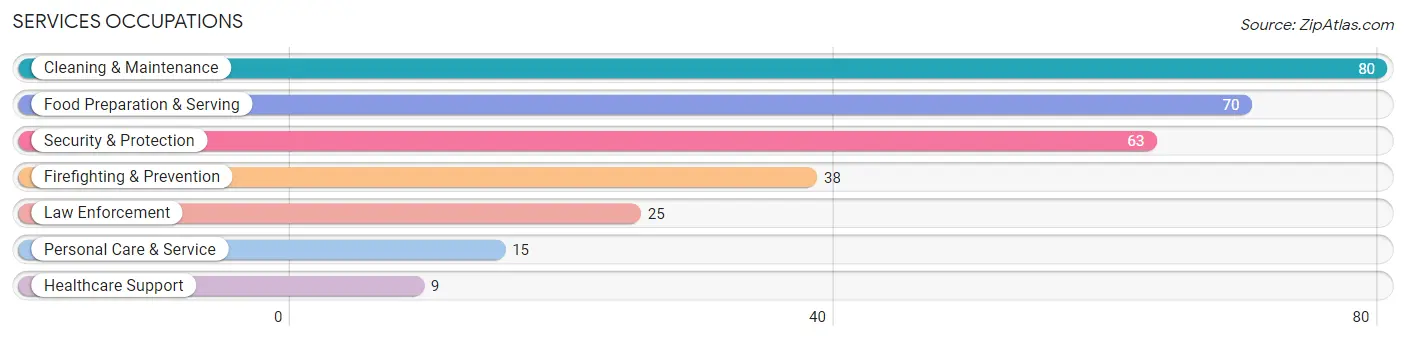
Services Occupations
The most common Services occupations in Apalachicola are Cleaning & Maintenance (80 | 7.7%), Food Preparation & Serving (70 | 6.8%), Security & Protection (63 | 6.1%), Firefighting & Prevention (38 | 3.7%), and Law Enforcement (25 | 2.4%).
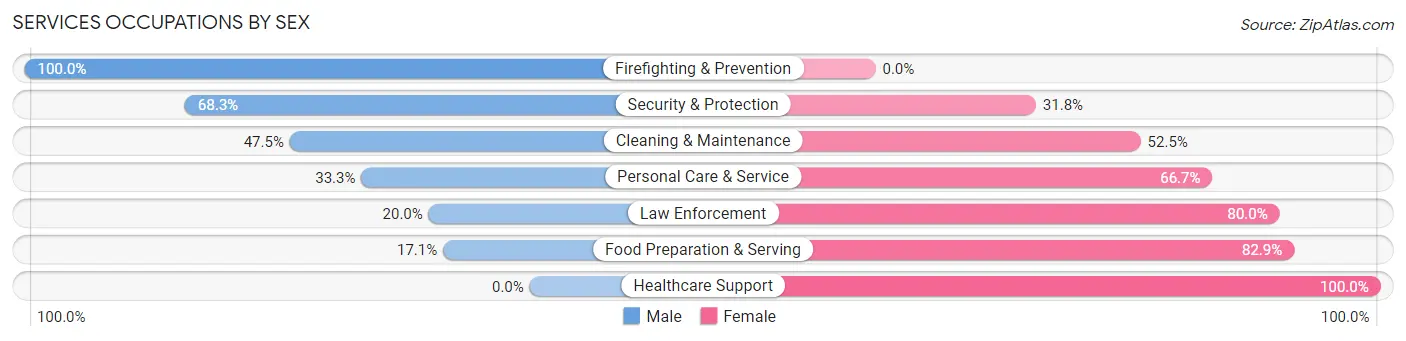
Services Occupations by Sex
Within the Services occupations in Apalachicola, the most male-oriented occupations are Firefighting & Prevention (100.0%), Security & Protection (68.2%), and Cleaning & Maintenance (47.5%), while the most female-oriented occupations are Healthcare Support (100.0%), Food Preparation & Serving (82.9%), and Law Enforcement (80.0%).
| Occupation | Male | Female |
| Healthcare Support | 0 (0.0%) | 9 (100.0%) |
| Security & Protection | 43 (68.2%) | 20 (31.8%) |
| Firefighting & Prevention | 38 (100.0%) | 0 (0.0%) |
| Law Enforcement | 5 (20.0%) | 20 (80.0%) |
| Food Preparation & Serving | 12 (17.1%) | 58 (82.9%) |
| Cleaning & Maintenance | 38 (47.5%) | 42 (52.5%) |
| Personal Care & Service | 5 (33.3%) | 10 (66.7%) |
| Total (Category) | 98 (41.3%) | 139 (58.7%) |
| Total (Overall) | 494 (47.7%) | 541 (52.3%) |
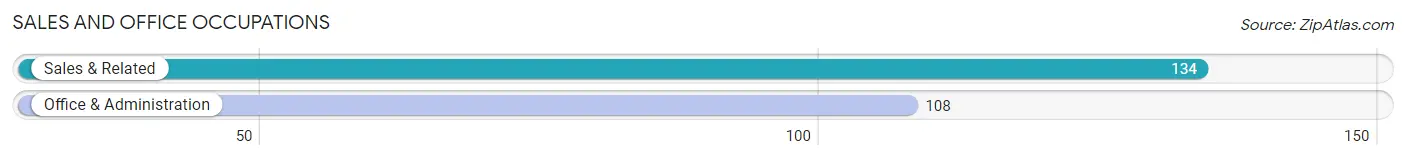
Sales and Office Occupations
The most common Sales and Office occupations in Apalachicola are Sales & Related (134 | 13.0%), and Office & Administration (108 | 10.4%).
Sales and Office Occupations by Sex
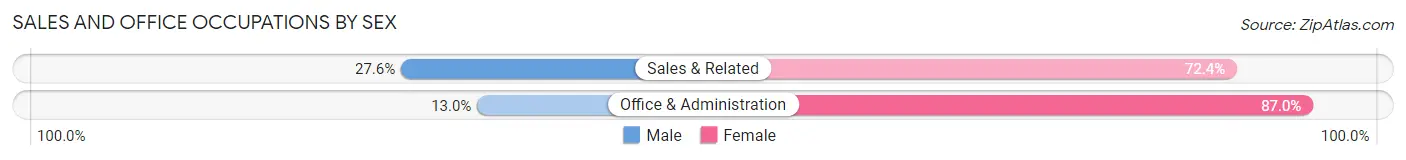
| Occupation | Male | Female |
| Sales & Related | 37 (27.6%) | 97 (72.4%) |
| Office & Administration | 14 (13.0%) | 94 (87.0%) |
| Total (Category) | 51 (21.1%) | 191 (78.9%) |
| Total (Overall) | 494 (47.7%) | 541 (52.3%) |
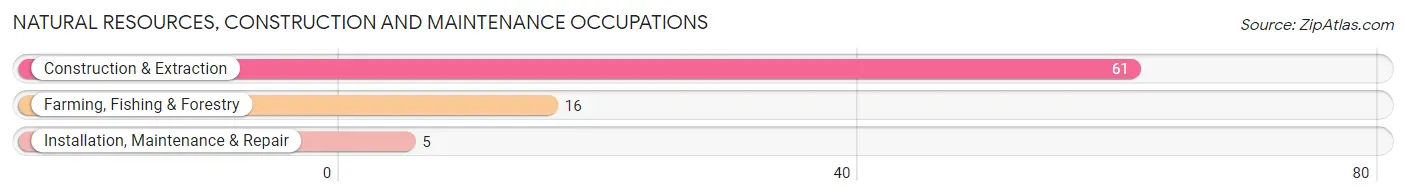
Natural Resources, Construction and Maintenance Occupations
The most common Natural Resources, Construction and Maintenance occupations in Apalachicola are Construction & Extraction (61 | 5.9%), Farming, Fishing & Forestry (16 | 1.5%), and Installation, Maintenance & Repair (5 | 0.5%).
Natural Resources, Construction and Maintenance Occupations by Sex
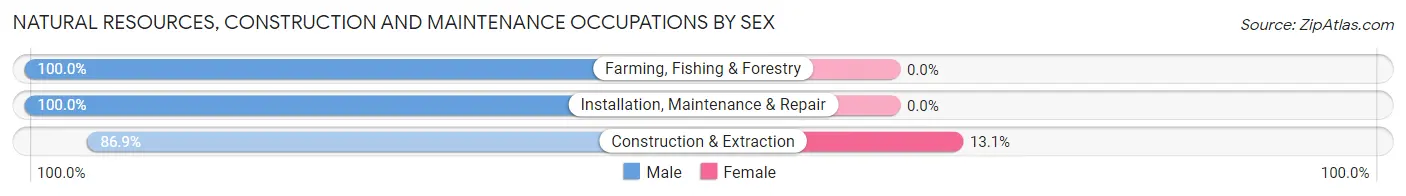
| Occupation | Male | Female |
| Farming, Fishing & Forestry | 16 (100.0%) | 0 (0.0%) |
| Construction & Extraction | 53 (86.9%) | 8 (13.1%) |
| Installation, Maintenance & Repair | 5 (100.0%) | 0 (0.0%) |
| Total (Category) | 74 (90.2%) | 8 (9.8%) |
| Total (Overall) | 494 (47.7%) | 541 (52.3%) |
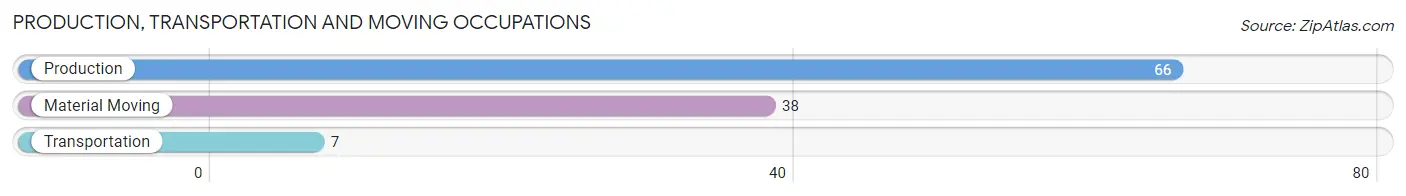
Production, Transportation and Moving Occupations
The most common Production, Transportation and Moving occupations in Apalachicola are Production (66 | 6.4%), Material Moving (38 | 3.7%), and Transportation (7 | 0.7%).
Production, Transportation and Moving Occupations by Sex
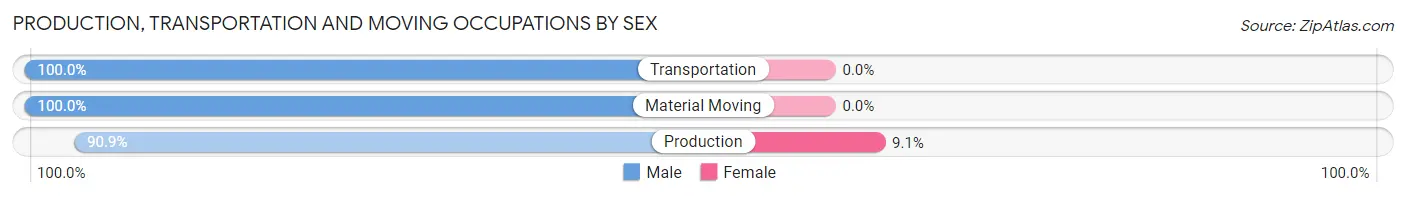
| Occupation | Male | Female |
| Production | 60 (90.9%) | 6 (9.1%) |
| Transportation | 7 (100.0%) | 0 (0.0%) |
| Material Moving | 38 (100.0%) | 0 (0.0%) |
| Total (Category) | 105 (94.6%) | 6 (5.4%) |
| Total (Overall) | 494 (47.7%) | 541 (52.3%) |
Employment Industries by Sex in Apalachicola
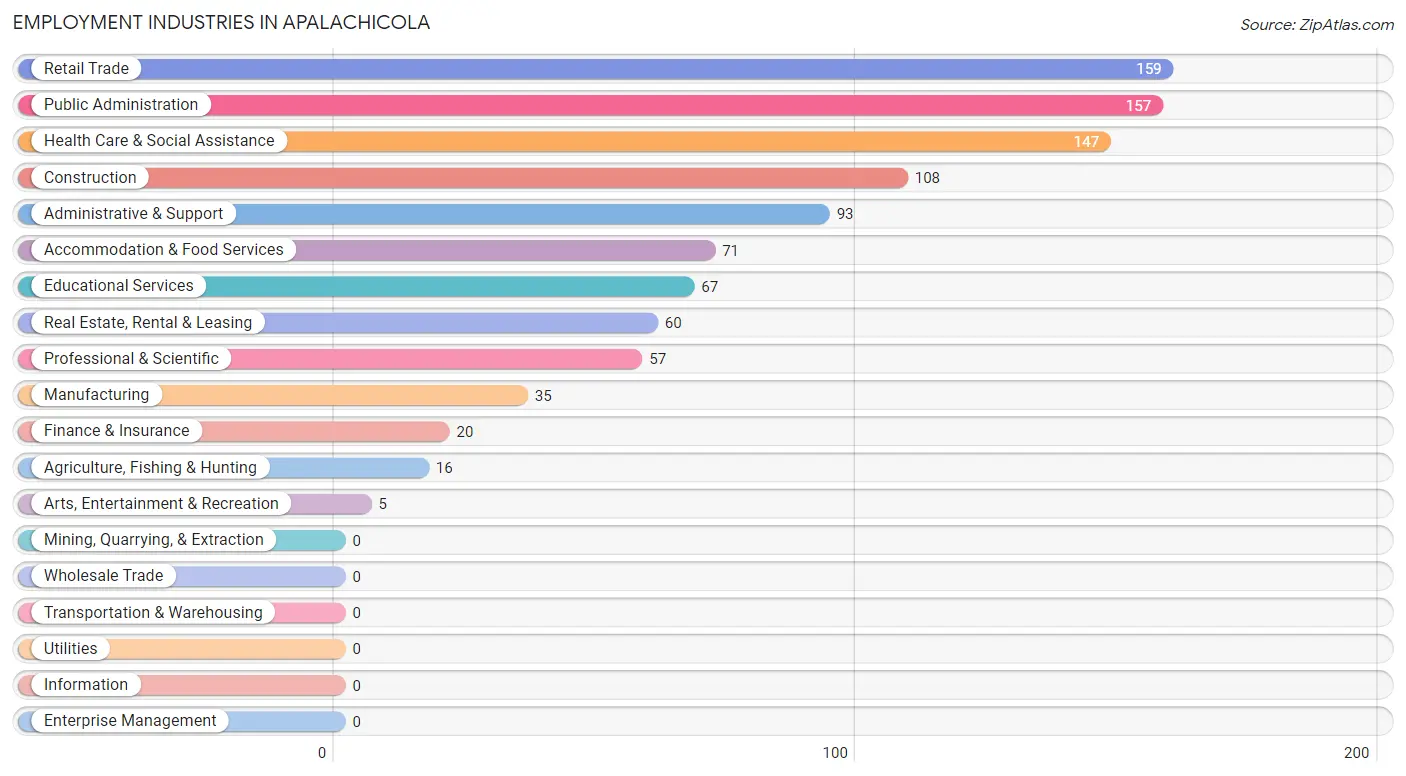
Employment Industries in Apalachicola
The major employment industries in Apalachicola include Retail Trade (159 | 15.4%), Public Administration (157 | 15.2%), Health Care & Social Assistance (147 | 14.2%), Construction (108 | 10.4%), and Administrative & Support (93 | 9.0%).
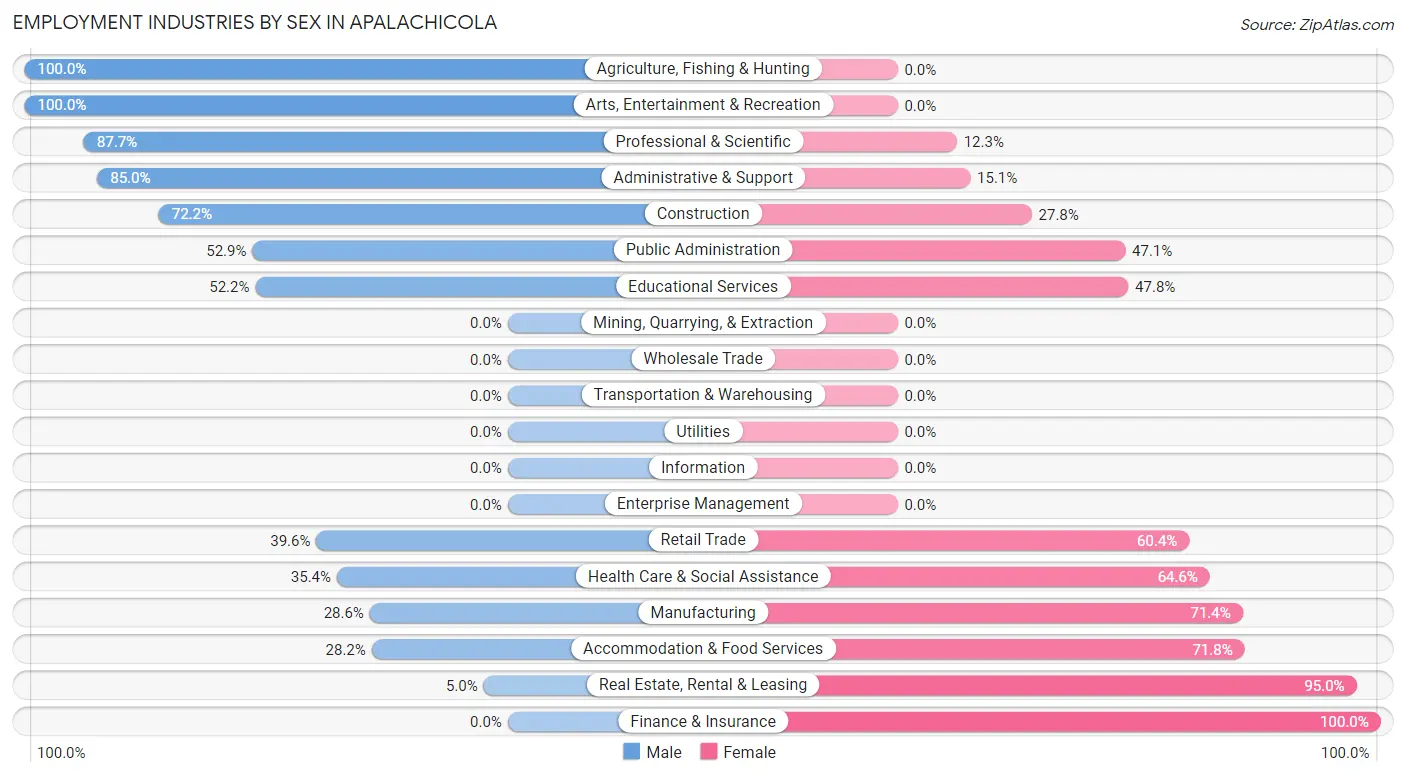
Employment Industries by Sex in Apalachicola
The Apalachicola industries that see more men than women are Agriculture, Fishing & Hunting (100.0%), Arts, Entertainment & Recreation (100.0%), and Professional & Scientific (87.7%), whereas the industries that tend to have a higher number of women are Finance & Insurance (100.0%), Real Estate, Rental & Leasing (95.0%), and Accommodation & Food Services (71.8%).
| Industry | Male | Female |
| Agriculture, Fishing & Hunting | 16 (100.0%) | 0 (0.0%) |
| Mining, Quarrying, & Extraction | 0 (0.0%) | 0 (0.0%) |
| Construction | 78 (72.2%) | 30 (27.8%) |
| Manufacturing | 10 (28.6%) | 25 (71.4%) |
| Wholesale Trade | 0 (0.0%) | 0 (0.0%) |
| Retail Trade | 63 (39.6%) | 96 (60.4%) |
| Transportation & Warehousing | 0 (0.0%) | 0 (0.0%) |
| Utilities | 0 (0.0%) | 0 (0.0%) |
| Information | 0 (0.0%) | 0 (0.0%) |
| Finance & Insurance | 0 (0.0%) | 20 (100.0%) |
| Real Estate, Rental & Leasing | 3 (5.0%) | 57 (95.0%) |
| Professional & Scientific | 50 (87.7%) | 7 (12.3%) |
| Enterprise Management | 0 (0.0%) | 0 (0.0%) |
| Administrative & Support | 79 (85.0%) | 14 (15.0%) |
| Educational Services | 35 (52.2%) | 32 (47.8%) |
| Health Care & Social Assistance | 52 (35.4%) | 95 (64.6%) |
| Arts, Entertainment & Recreation | 5 (100.0%) | 0 (0.0%) |
| Accommodation & Food Services | 20 (28.2%) | 51 (71.8%) |
| Public Administration | 83 (52.9%) | 74 (47.1%) |
| Total | 494 (47.7%) | 541 (52.3%) |
Education in Apalachicola
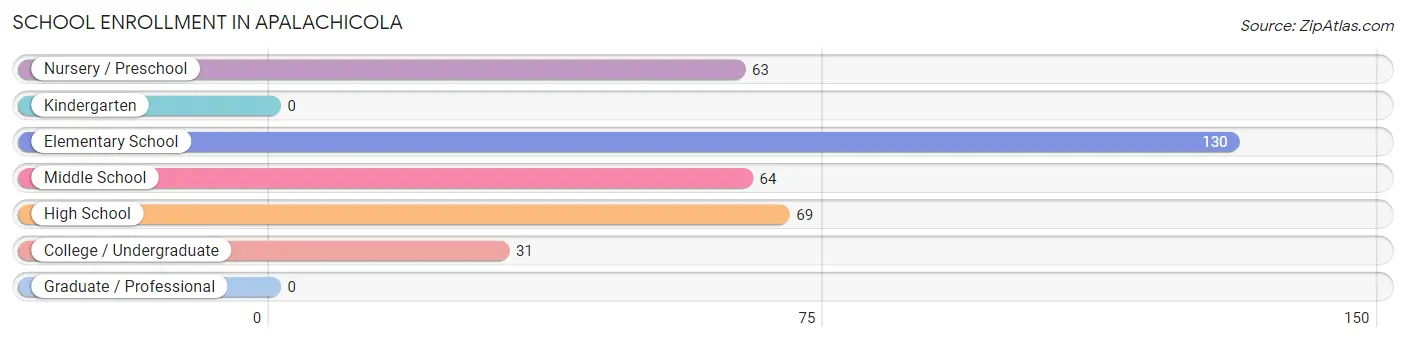
School Enrollment in Apalachicola
The most common levels of schooling among the 357 students in Apalachicola are elementary school (130 | 36.4%), high school (69 | 19.3%), and middle school (64 | 17.9%).
| School Level | # Students | % Students |
| Nursery / Preschool | 63 | 17.6% |
| Kindergarten | 0 | 0.0% |
| Elementary School | 130 | 36.4% |
| Middle School | 64 | 17.9% |
| High School | 69 | 19.3% |
| College / Undergraduate | 31 | 8.7% |
| Graduate / Professional | 0 | 0.0% |
| Total | 357 | 100.0% |
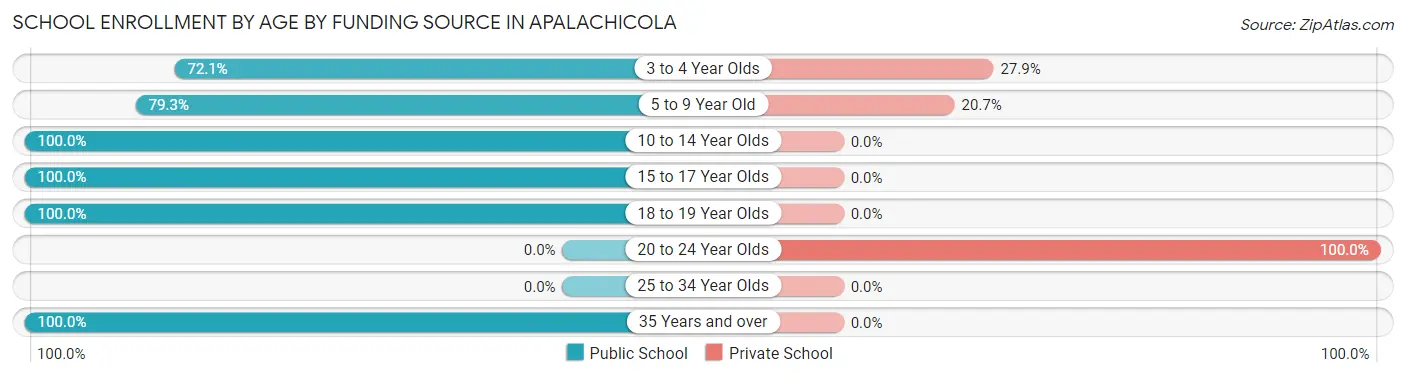
School Enrollment by Age by Funding Source in Apalachicola
Out of a total of 357 students who are enrolled in schools in Apalachicola, 63 (17.6%) attend a private institution, while the remaining 294 (82.4%) are enrolled in public schools. The age group of 20 to 24 year olds has the highest likelihood of being enrolled in private schools, with 20 (100.0% in the age bracket) enrolled. Conversely, the age group of 10 to 14 year olds has the lowest likelihood of being enrolled in a private school, with 76 (100.0% in the age bracket) attending a public institution.
| Age Bracket | Public School | Private School |
| 3 to 4 Year Olds | 31 (72.1%) | 12 (27.9%) |
| 5 to 9 Year Old | 119 (79.3%) | 31 (20.7%) |
| 10 to 14 Year Olds | 76 (100.0%) | 0 (0.0%) |
| 15 to 17 Year Olds | 28 (100.0%) | 0 (0.0%) |
| 18 to 19 Year Olds | 29 (100.0%) | 0 (0.0%) |
| 20 to 24 Year Olds | 0 (0.0%) | 20 (100.0%) |
| 25 to 34 Year Olds | 0 (0.0%) | 0 (0.0%) |
| 35 Years and over | 11 (100.0%) | 0 (0.0%) |
| Total | 294 (82.4%) | 63 (17.6%) |
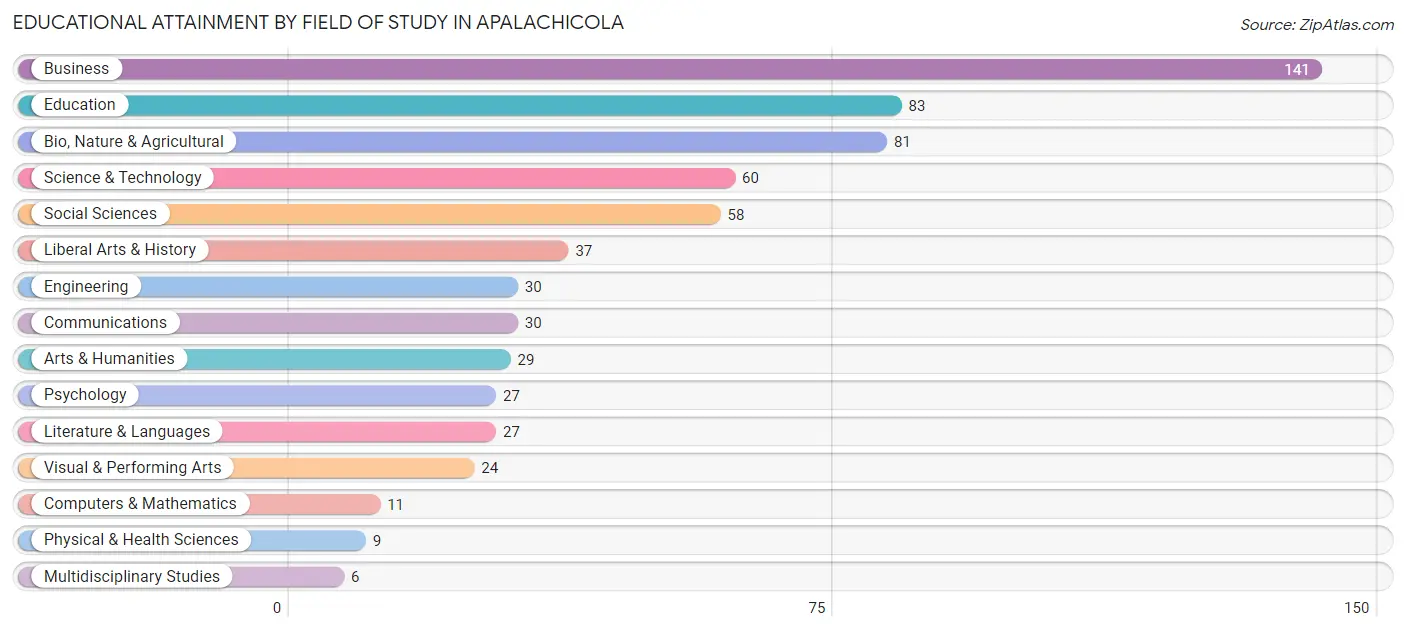
Educational Attainment by Field of Study in Apalachicola
Business (141 | 21.6%), education (83 | 12.7%), bio, nature & agricultural (81 | 12.4%), science & technology (60 | 9.2%), and social sciences (58 | 8.9%) are the most common fields of study among 653 individuals in Apalachicola who have obtained a bachelor's degree or higher.
| Field of Study | # Graduates | % Graduates |
| Computers & Mathematics | 11 | 1.7% |
| Bio, Nature & Agricultural | 81 | 12.4% |
| Physical & Health Sciences | 9 | 1.4% |
| Psychology | 27 | 4.1% |
| Social Sciences | 58 | 8.9% |
| Engineering | 30 | 4.6% |
| Multidisciplinary Studies | 6 | 0.9% |
| Science & Technology | 60 | 9.2% |
| Business | 141 | 21.6% |
| Education | 83 | 12.7% |
| Literature & Languages | 27 | 4.1% |
| Liberal Arts & History | 37 | 5.7% |
| Visual & Performing Arts | 24 | 3.7% |
| Communications | 30 | 4.6% |
| Arts & Humanities | 29 | 4.4% |
| Total | 653 | 100.0% |
Transportation & Commute in Apalachicola
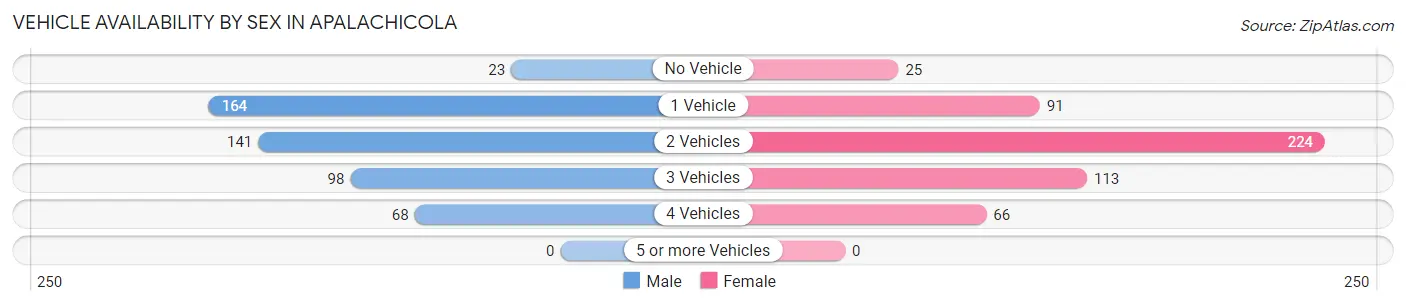
Vehicle Availability by Sex in Apalachicola
The most prevalent vehicle ownership categories in Apalachicola are males with 1 vehicle (164, accounting for 33.2%) and females with 1 vehicle (91, making up 31.6%).
| Vehicles Available | Male | Female |
| No Vehicle | 23 (4.7%) | 25 (4.8%) |
| 1 Vehicle | 164 (33.2%) | 91 (17.5%) |
| 2 Vehicles | 141 (28.5%) | 224 (43.2%) |
| 3 Vehicles | 98 (19.8%) | 113 (21.8%) |
| 4 Vehicles | 68 (13.8%) | 66 (12.7%) |
| 5 or more Vehicles | 0 (0.0%) | 0 (0.0%) |
| Total | 494 (100.0%) | 519 (100.0%) |
Commute Time in Apalachicola
The most frequently occuring commute durations in Apalachicola are 5 to 9 minutes (275 commuters, 28.1%), 10 to 14 minutes (177 commuters, 18.1%), and 15 to 19 minutes (101 commuters, 10.3%).
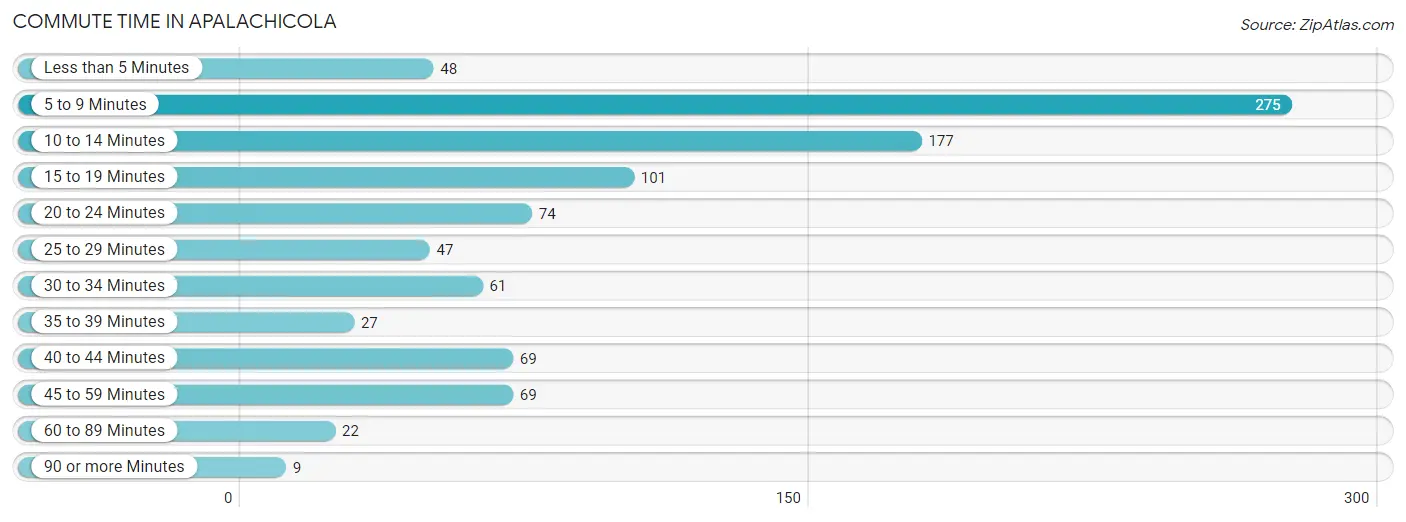
| Commute Time | # Commuters | % Commuters |
| Less than 5 Minutes | 48 | 4.9% |
| 5 to 9 Minutes | 275 | 28.1% |
| 10 to 14 Minutes | 177 | 18.1% |
| 15 to 19 Minutes | 101 | 10.3% |
| 20 to 24 Minutes | 74 | 7.6% |
| 25 to 29 Minutes | 47 | 4.8% |
| 30 to 34 Minutes | 61 | 6.2% |
| 35 to 39 Minutes | 27 | 2.8% |
| 40 to 44 Minutes | 69 | 7.0% |
| 45 to 59 Minutes | 69 | 7.0% |
| 60 to 89 Minutes | 22 | 2.2% |
| 90 or more Minutes | 9 | 0.9% |
Commute Time by Sex in Apalachicola
The most common commute times in Apalachicola are 5 to 9 minutes (133 commuters, 27.6%) for males and 10 to 14 minutes (158 commuters, 31.8%) for females.
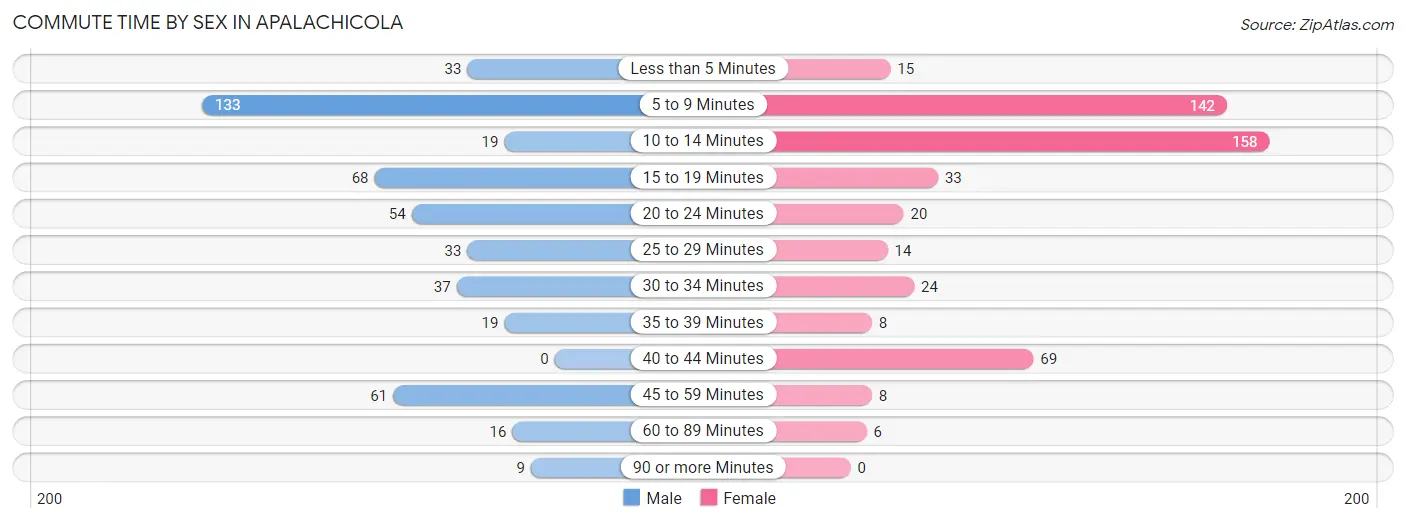
| Commute Time | Male | Female |
| Less than 5 Minutes | 33 (6.9%) | 15 (3.0%) |
| 5 to 9 Minutes | 133 (27.6%) | 142 (28.6%) |
| 10 to 14 Minutes | 19 (3.9%) | 158 (31.8%) |
| 15 to 19 Minutes | 68 (14.1%) | 33 (6.6%) |
| 20 to 24 Minutes | 54 (11.2%) | 20 (4.0%) |
| 25 to 29 Minutes | 33 (6.9%) | 14 (2.8%) |
| 30 to 34 Minutes | 37 (7.7%) | 24 (4.8%) |
| 35 to 39 Minutes | 19 (3.9%) | 8 (1.6%) |
| 40 to 44 Minutes | 0 (0.0%) | 69 (13.9%) |
| 45 to 59 Minutes | 61 (12.7%) | 8 (1.6%) |
| 60 to 89 Minutes | 16 (3.3%) | 6 (1.2%) |
| 90 or more Minutes | 9 (1.9%) | 0 (0.0%) |
Time of Departure to Work by Sex in Apalachicola
The most frequent times of departure to work in Apalachicola are 7:30 AM to 7:59 AM (83, 17.2%) for males and 7:00 AM to 7:29 AM (94, 18.9%) for females.
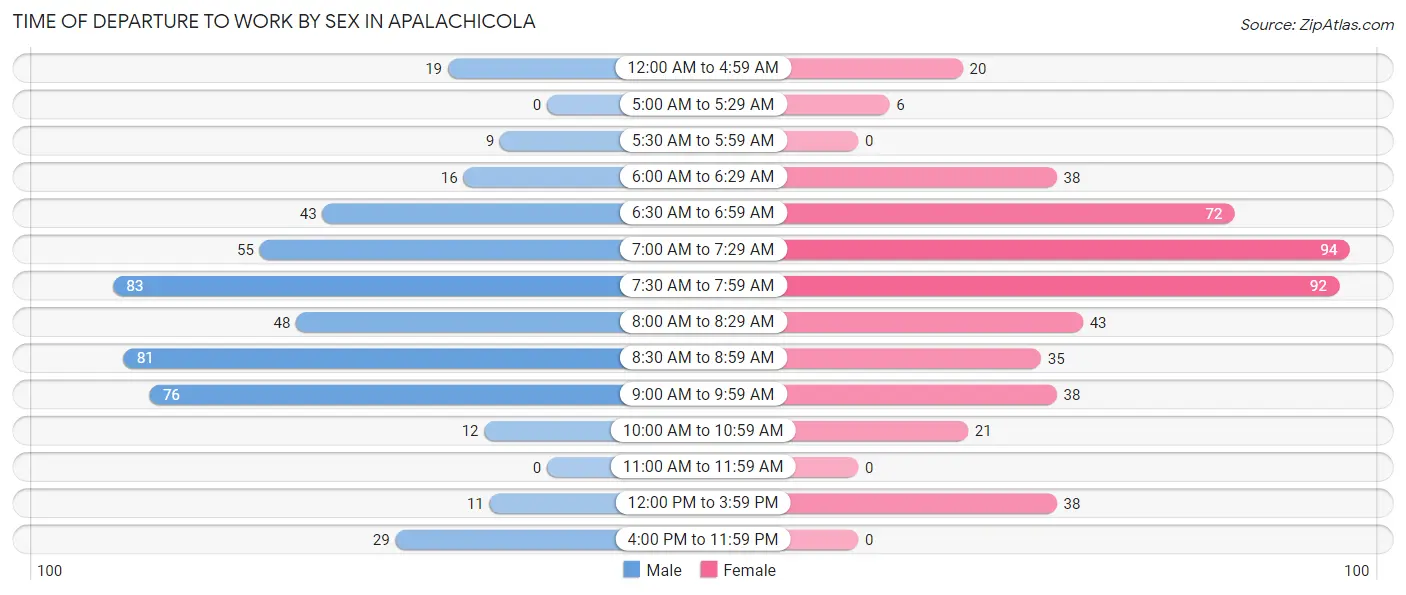
| Time of Departure | Male | Female |
| 12:00 AM to 4:59 AM | 19 (3.9%) | 20 (4.0%) |
| 5:00 AM to 5:29 AM | 0 (0.0%) | 6 (1.2%) |
| 5:30 AM to 5:59 AM | 9 (1.9%) | 0 (0.0%) |
| 6:00 AM to 6:29 AM | 16 (3.3%) | 38 (7.6%) |
| 6:30 AM to 6:59 AM | 43 (8.9%) | 72 (14.5%) |
| 7:00 AM to 7:29 AM | 55 (11.4%) | 94 (18.9%) |
| 7:30 AM to 7:59 AM | 83 (17.2%) | 92 (18.5%) |
| 8:00 AM to 8:29 AM | 48 (10.0%) | 43 (8.6%) |
| 8:30 AM to 8:59 AM | 81 (16.8%) | 35 (7.0%) |
| 9:00 AM to 9:59 AM | 76 (15.8%) | 38 (7.6%) |
| 10:00 AM to 10:59 AM | 12 (2.5%) | 21 (4.2%) |
| 11:00 AM to 11:59 AM | 0 (0.0%) | 0 (0.0%) |
| 12:00 PM to 3:59 PM | 11 (2.3%) | 38 (7.6%) |
| 4:00 PM to 11:59 PM | 29 (6.0%) | 0 (0.0%) |
| Total | 482 (100.0%) | 497 (100.0%) |
Housing Occupancy in Apalachicola
Occupancy by Ownership in Apalachicola
Of the total 1,149 dwellings in Apalachicola, owner-occupied units account for 759 (66.1%), while renter-occupied units make up 390 (33.9%).
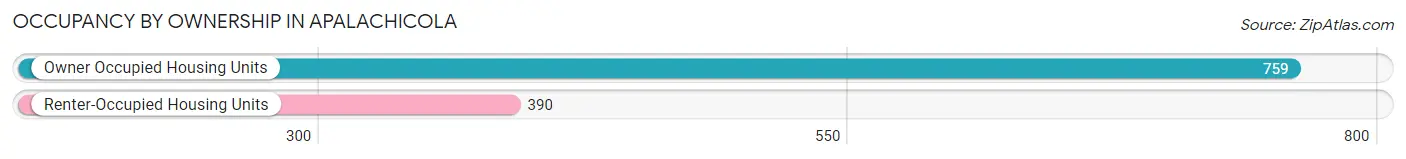
| Occupancy | # Housing Units | % Housing Units |
| Owner Occupied Housing Units | 759 | 66.1% |
| Renter-Occupied Housing Units | 390 | 33.9% |
| Total Occupied Housing Units | 1,149 | 100.0% |
Occupancy by Household Size in Apalachicola
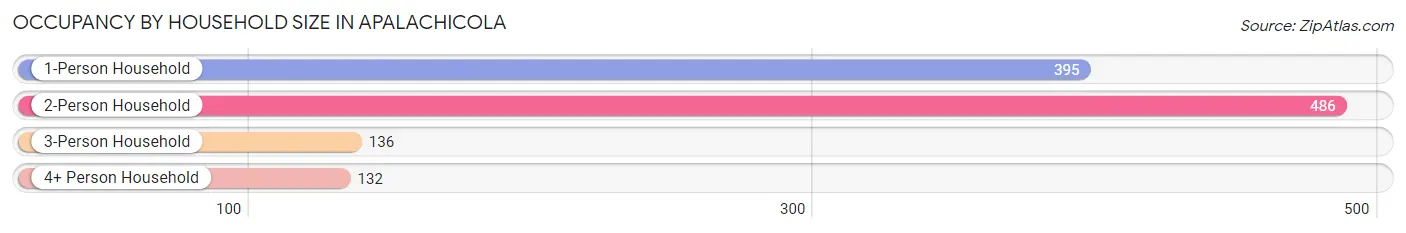
| Household Size | # Housing Units | % Housing Units |
| 1-Person Household | 395 | 34.4% |
| 2-Person Household | 486 | 42.3% |
| 3-Person Household | 136 | 11.8% |
| 4+ Person Household | 132 | 11.5% |
| Total Housing Units | 1,149 | 100.0% |
Occupancy by Ownership by Household Size in Apalachicola
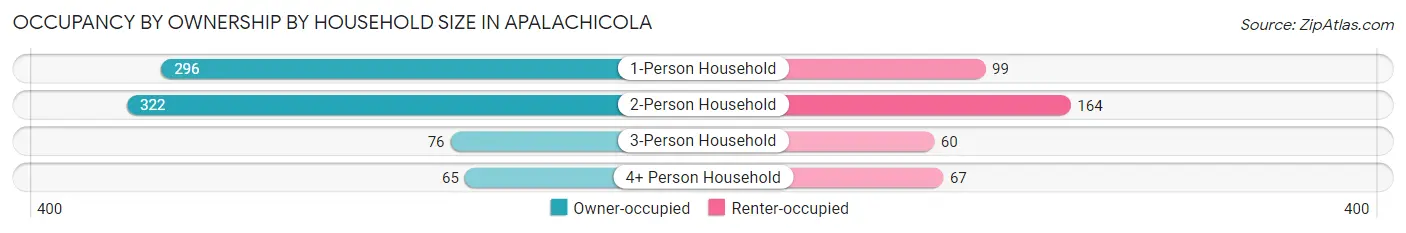
| Household Size | Owner-occupied | Renter-occupied |
| 1-Person Household | 296 (74.9%) | 99 (25.1%) |
| 2-Person Household | 322 (66.3%) | 164 (33.7%) |
| 3-Person Household | 76 (55.9%) | 60 (44.1%) |
| 4+ Person Household | 65 (49.2%) | 67 (50.8%) |
| Total Housing Units | 759 (66.1%) | 390 (33.9%) |
Occupancy by Educational Attainment in Apalachicola
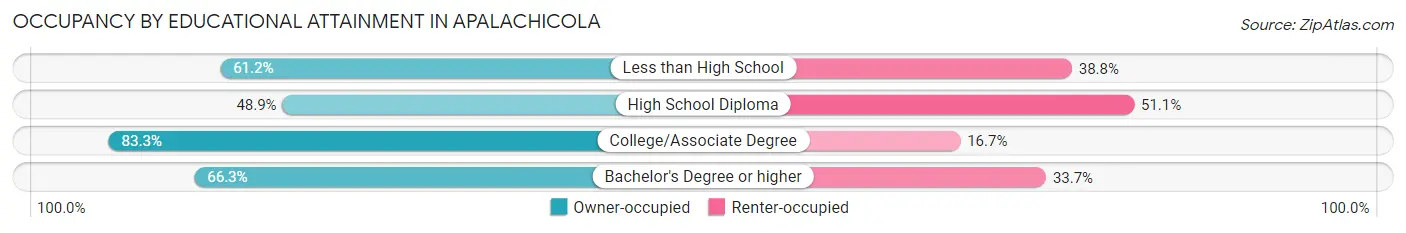
| Household Size | Owner-occupied | Renter-occupied |
| Less than High School | 101 (61.2%) | 64 (38.8%) |
| High School Diploma | 131 (48.9%) | 137 (51.1%) |
| College/Associate Degree | 255 (83.3%) | 51 (16.7%) |
| Bachelor's Degree or higher | 272 (66.3%) | 138 (33.7%) |
Occupancy by Age of Householder in Apalachicola
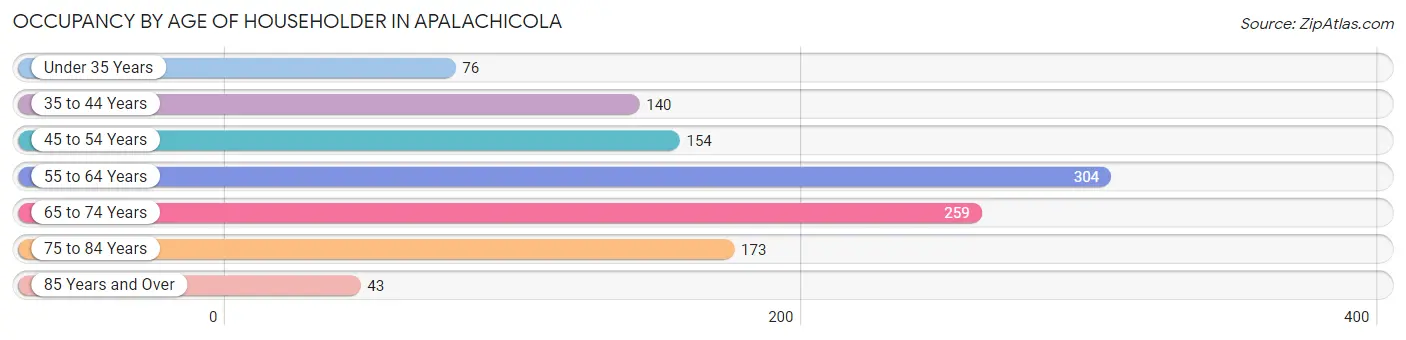
| Age Bracket | # Households | % Households |
| Under 35 Years | 76 | 6.6% |
| 35 to 44 Years | 140 | 12.2% |
| 45 to 54 Years | 154 | 13.4% |
| 55 to 64 Years | 304 | 26.5% |
| 65 to 74 Years | 259 | 22.5% |
| 75 to 84 Years | 173 | 15.1% |
| 85 Years and Over | 43 | 3.7% |
| Total | 1,149 | 100.0% |
Housing Finances in Apalachicola
Median Income by Occupancy in Apalachicola
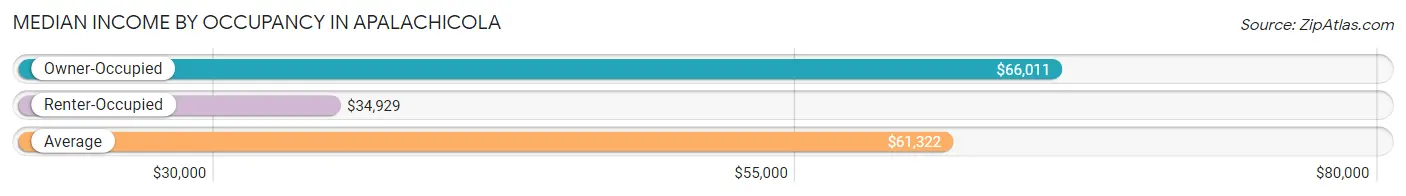
| Occupancy Type | # Households | Median Income |
| Owner-Occupied | 759 (66.1%) | $66,011 |
| Renter-Occupied | 390 (33.9%) | $34,929 |
| Average | 1,149 (100.0%) | $61,322 |
Occupancy by Householder Income Bracket in Apalachicola
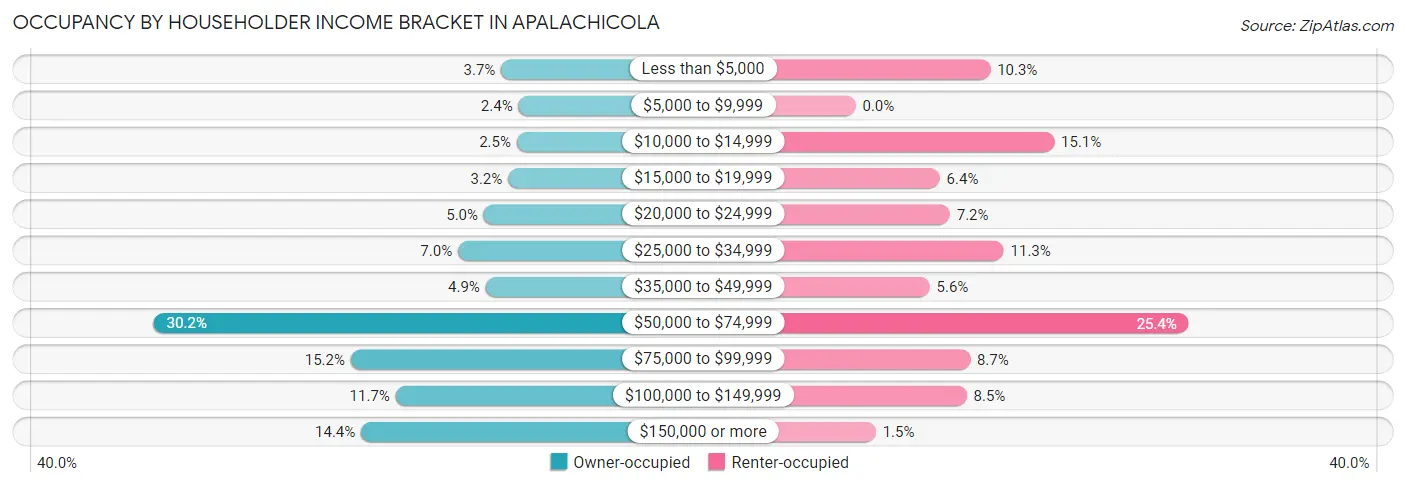
| Income Bracket | Owner-occupied | Renter-occupied |
| Less than $5,000 | 28 (3.7%) | 40 (10.3%) |
| $5,000 to $9,999 | 18 (2.4%) | 0 (0.0%) |
| $10,000 to $14,999 | 19 (2.5%) | 59 (15.1%) |
| $15,000 to $19,999 | 24 (3.2%) | 25 (6.4%) |
| $20,000 to $24,999 | 38 (5.0%) | 28 (7.2%) |
| $25,000 to $34,999 | 53 (7.0%) | 44 (11.3%) |
| $35,000 to $49,999 | 37 (4.9%) | 22 (5.6%) |
| $50,000 to $74,999 | 229 (30.2%) | 99 (25.4%) |
| $75,000 to $99,999 | 115 (15.1%) | 34 (8.7%) |
| $100,000 to $149,999 | 89 (11.7%) | 33 (8.5%) |
| $150,000 or more | 109 (14.4%) | 6 (1.5%) |
| Total | 759 (100.0%) | 390 (100.0%) |
Monthly Housing Cost Tiers in Apalachicola
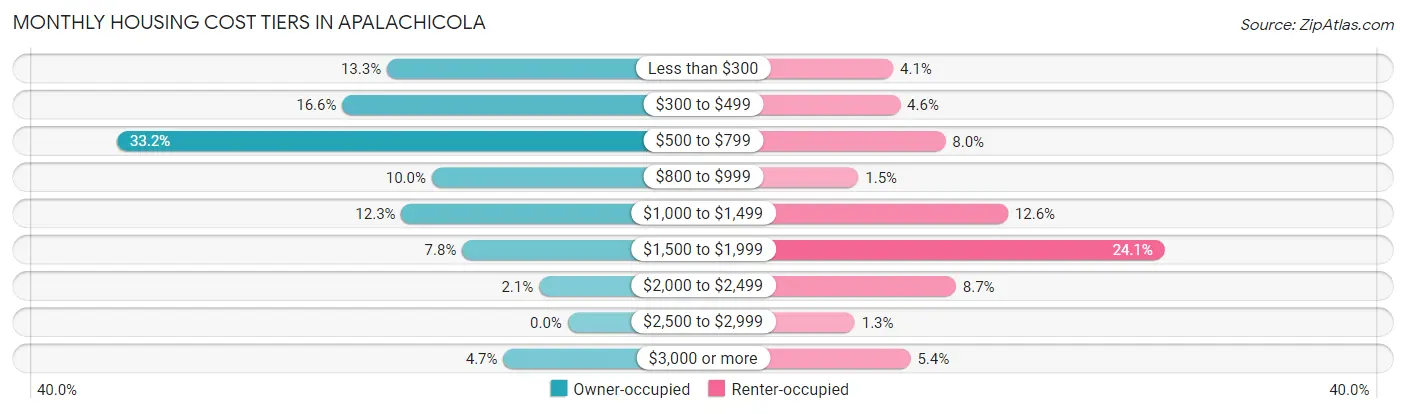
| Monthly Cost | Owner-occupied | Renter-occupied |
| Less than $300 | 101 (13.3%) | 16 (4.1%) |
| $300 to $499 | 126 (16.6%) | 18 (4.6%) |
| $500 to $799 | 252 (33.2%) | 31 (8.0%) |
| $800 to $999 | 76 (10.0%) | 6 (1.5%) |
| $1,000 to $1,499 | 93 (12.2%) | 49 (12.6%) |
| $1,500 to $1,999 | 59 (7.8%) | 94 (24.1%) |
| $2,000 to $2,499 | 16 (2.1%) | 34 (8.7%) |
| $2,500 to $2,999 | 0 (0.0%) | 5 (1.3%) |
| $3,000 or more | 36 (4.7%) | 21 (5.4%) |
| Total | 759 (100.0%) | 390 (100.0%) |
Physical Housing Characteristics in Apalachicola
Housing Structures in Apalachicola
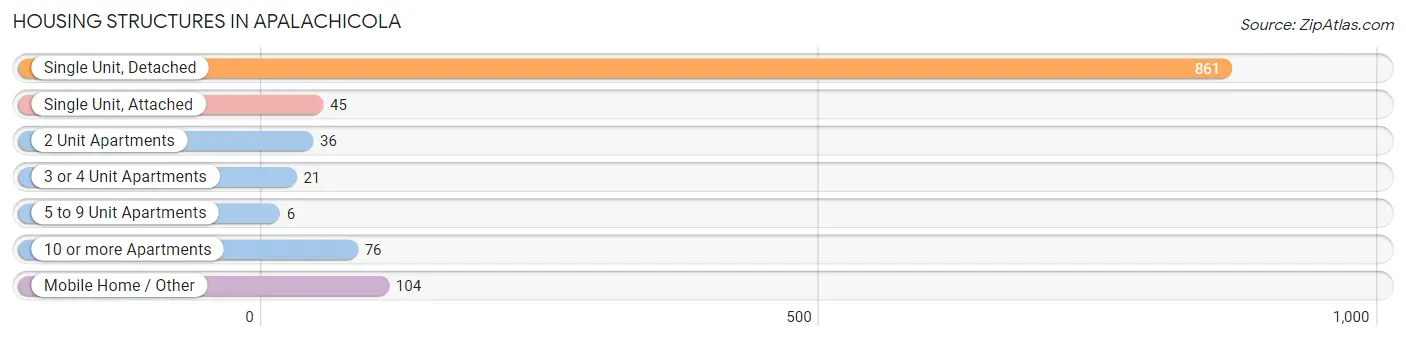
| Structure Type | # Housing Units | % Housing Units |
| Single Unit, Detached | 861 | 74.9% |
| Single Unit, Attached | 45 | 3.9% |
| 2 Unit Apartments | 36 | 3.1% |
| 3 or 4 Unit Apartments | 21 | 1.8% |
| 5 to 9 Unit Apartments | 6 | 0.5% |
| 10 or more Apartments | 76 | 6.6% |
| Mobile Home / Other | 104 | 9.0% |
| Total | 1,149 | 100.0% |
Housing Structures by Occupancy in Apalachicola
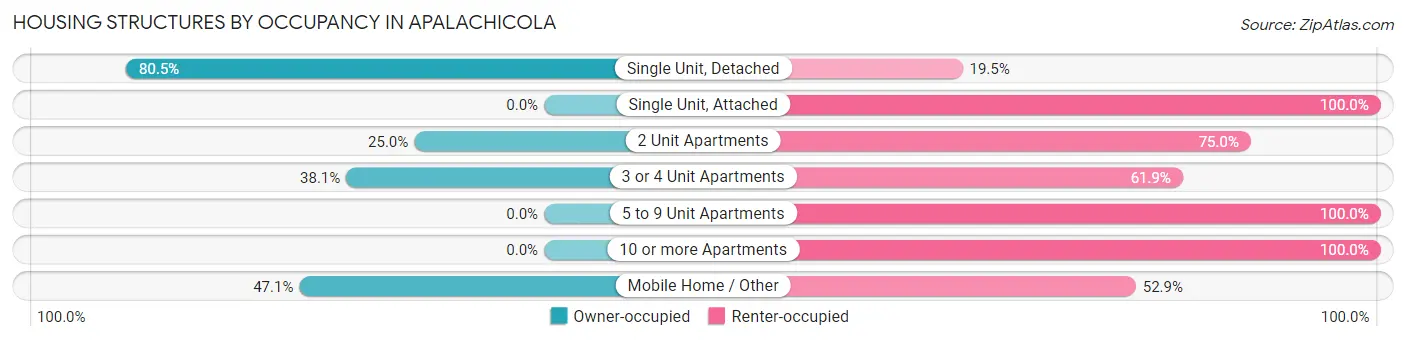
| Structure Type | Owner-occupied | Renter-occupied |
| Single Unit, Detached | 693 (80.5%) | 168 (19.5%) |
| Single Unit, Attached | 0 (0.0%) | 45 (100.0%) |
| 2 Unit Apartments | 9 (25.0%) | 27 (75.0%) |
| 3 or 4 Unit Apartments | 8 (38.1%) | 13 (61.9%) |
| 5 to 9 Unit Apartments | 0 (0.0%) | 6 (100.0%) |
| 10 or more Apartments | 0 (0.0%) | 76 (100.0%) |
| Mobile Home / Other | 49 (47.1%) | 55 (52.9%) |
| Total | 759 (66.1%) | 390 (33.9%) |
Housing Structures by Number of Rooms in Apalachicola
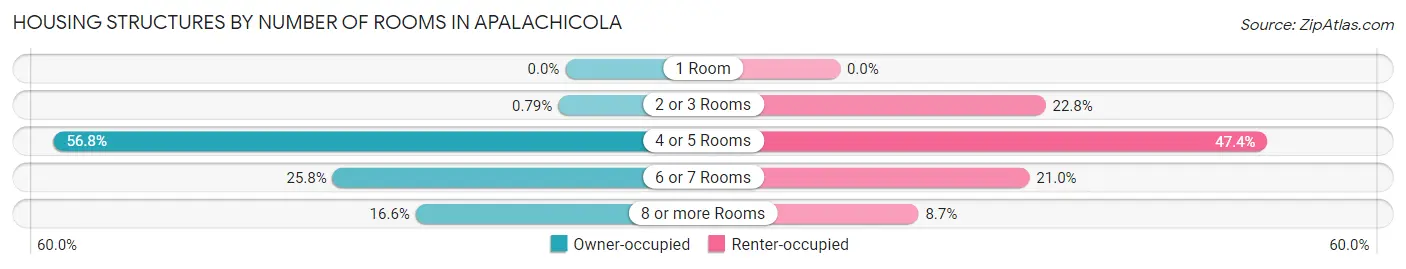
| Number of Rooms | Owner-occupied | Renter-occupied |
| 1 Room | 0 (0.0%) | 0 (0.0%) |
| 2 or 3 Rooms | 6 (0.8%) | 89 (22.8%) |
| 4 or 5 Rooms | 431 (56.8%) | 185 (47.4%) |
| 6 or 7 Rooms | 196 (25.8%) | 82 (21.0%) |
| 8 or more Rooms | 126 (16.6%) | 34 (8.7%) |
| Total | 759 (100.0%) | 390 (100.0%) |
Housing Structure by Heating Type in Apalachicola
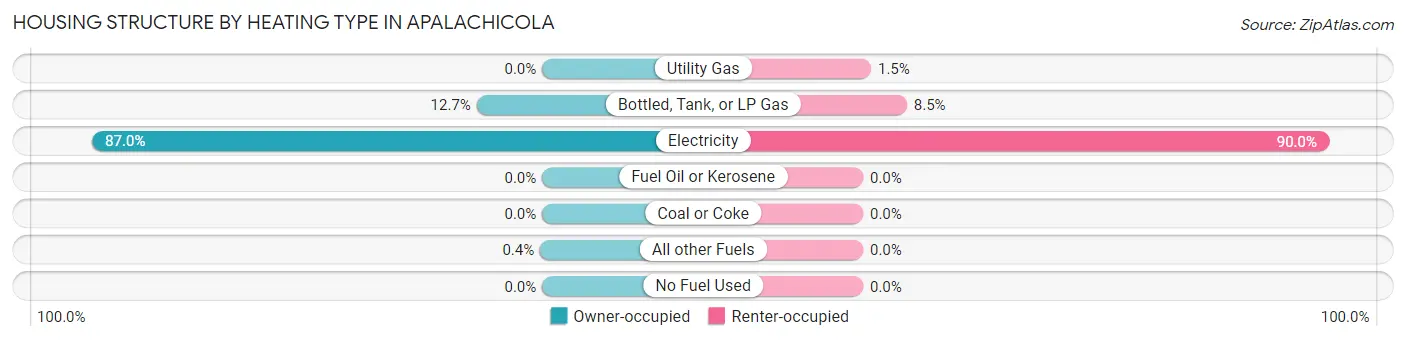
| Heating Type | Owner-occupied | Renter-occupied |
| Utility Gas | 0 (0.0%) | 6 (1.5%) |
| Bottled, Tank, or LP Gas | 96 (12.7%) | 33 (8.5%) |
| Electricity | 660 (87.0%) | 351 (90.0%) |
| Fuel Oil or Kerosene | 0 (0.0%) | 0 (0.0%) |
| Coal or Coke | 0 (0.0%) | 0 (0.0%) |
| All other Fuels | 3 (0.4%) | 0 (0.0%) |
| No Fuel Used | 0 (0.0%) | 0 (0.0%) |
| Total | 759 (100.0%) | 390 (100.0%) |
Household Vehicle Usage in Apalachicola
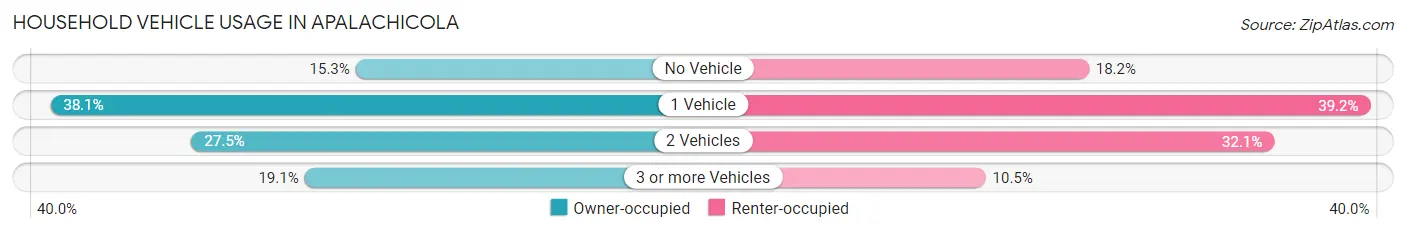
| Vehicles per Household | Owner-occupied | Renter-occupied |
| No Vehicle | 116 (15.3%) | 71 (18.2%) |
| 1 Vehicle | 289 (38.1%) | 153 (39.2%) |
| 2 Vehicles | 209 (27.5%) | 125 (32.1%) |
| 3 or more Vehicles | 145 (19.1%) | 41 (10.5%) |
| Total | 759 (100.0%) | 390 (100.0%) |
Real Estate & Mortgages in Apalachicola
Real Estate and Mortgage Overview in Apalachicola
| Characteristic | Without Mortgage | With Mortgage |
| Housing Units | 554 | 205 |
| Median Property Value | $229,200 | $275,600 |
| Median Household Income | $65,221 | $72 |
| Monthly Housing Costs | $532 | $36 |
| Real Estate Taxes | $1,287 | $0 |
Property Value by Mortgage Status in Apalachicola
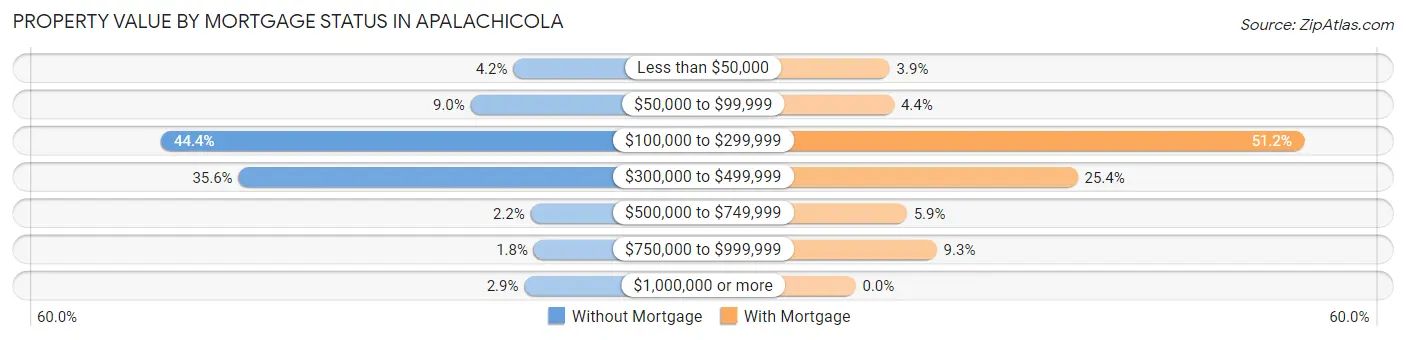
| Property Value | Without Mortgage | With Mortgage |
| Less than $50,000 | 23 (4.2%) | 8 (3.9%) |
| $50,000 to $99,999 | 50 (9.0%) | 9 (4.4%) |
| $100,000 to $299,999 | 246 (44.4%) | 105 (51.2%) |
| $300,000 to $499,999 | 197 (35.6%) | 52 (25.4%) |
| $500,000 to $749,999 | 12 (2.2%) | 12 (5.9%) |
| $750,000 to $999,999 | 10 (1.8%) | 19 (9.3%) |
| $1,000,000 or more | 16 (2.9%) | 0 (0.0%) |
| Total | 554 (100.0%) | 205 (100.0%) |
Household Income by Mortgage Status in Apalachicola
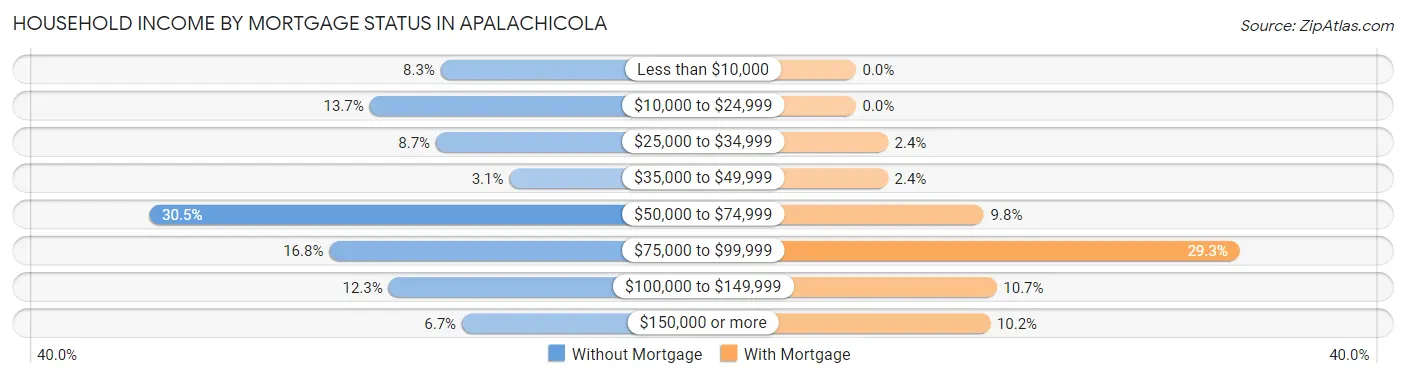
| Household Income | Without Mortgage | With Mortgage |
| Less than $10,000 | 46 (8.3%) | 0 (0.0%) |
| $10,000 to $24,999 | 76 (13.7%) | 0 (0.0%) |
| $25,000 to $34,999 | 48 (8.7%) | 5 (2.4%) |
| $35,000 to $49,999 | 17 (3.1%) | 5 (2.4%) |
| $50,000 to $74,999 | 169 (30.5%) | 20 (9.8%) |
| $75,000 to $99,999 | 93 (16.8%) | 60 (29.3%) |
| $100,000 to $149,999 | 68 (12.3%) | 22 (10.7%) |
| $150,000 or more | 37 (6.7%) | 21 (10.2%) |
| Total | 554 (100.0%) | 205 (100.0%) |
Property Value to Household Income Ratio in Apalachicola
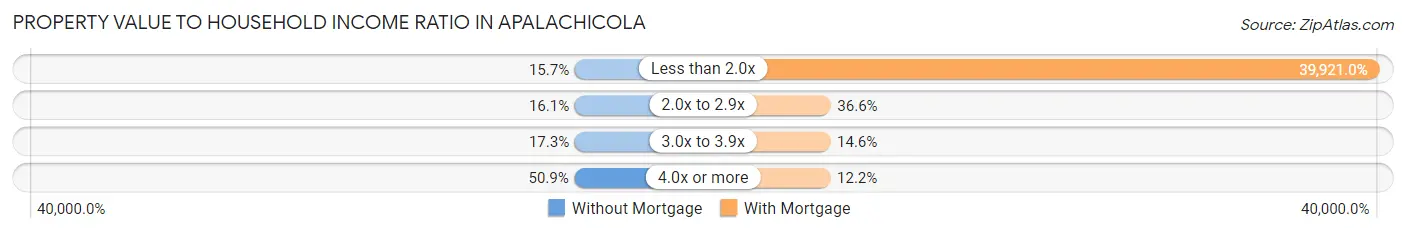
| Value-to-Income Ratio | Without Mortgage | With Mortgage |
| Less than 2.0x | 87 (15.7%) | 81,838 (39,921.0%) |
| 2.0x to 2.9x | 89 (16.1%) | 75 (36.6%) |
| 3.0x to 3.9x | 96 (17.3%) | 30 (14.6%) |
| 4.0x or more | 282 (50.9%) | 25 (12.2%) |
| Total | 554 (100.0%) | 205 (100.0%) |
Real Estate Taxes by Mortgage Status in Apalachicola
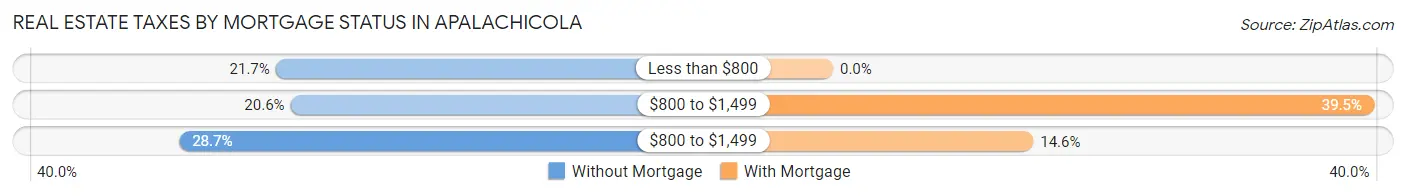
| Property Taxes | Without Mortgage | With Mortgage |
| Less than $800 | 120 (21.7%) | 0 (0.0%) |
| $800 to $1,499 | 114 (20.6%) | 81 (39.5%) |
| $800 to $1,499 | 159 (28.7%) | 30 (14.6%) |
| Total | 554 (100.0%) | 205 (100.0%) |
Health & Disability in Apalachicola
Health Insurance Coverage by Age in Apalachicola
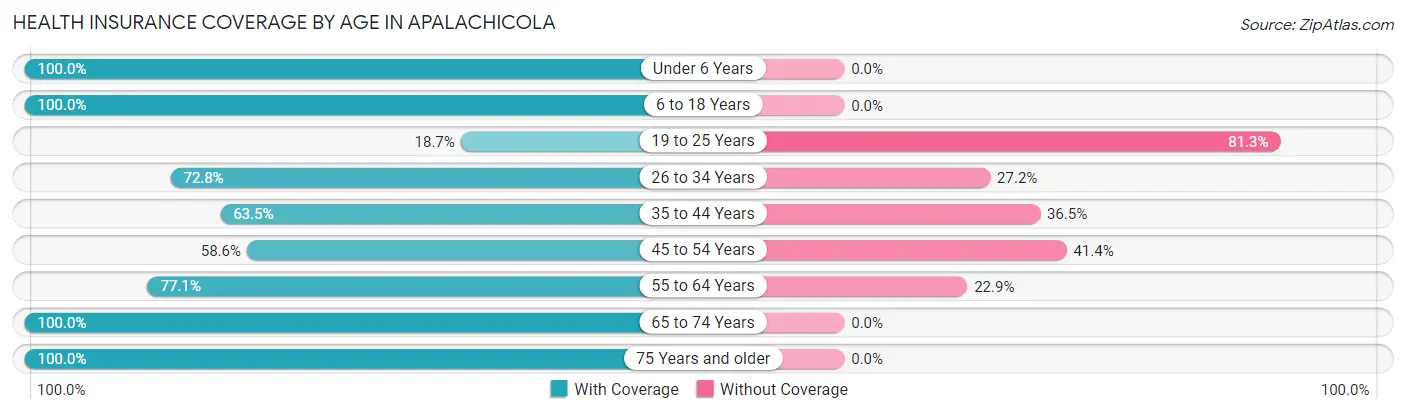
| Age Bracket | With Coverage | Without Coverage |
| Under 6 Years | 74 (100.0%) | 0 (0.0%) |
| 6 to 18 Years | 234 (100.0%) | 0 (0.0%) |
| 19 to 25 Years | 20 (18.7%) | 87 (81.3%) |
| 26 to 34 Years | 190 (72.8%) | 71 (27.2%) |
| 35 to 44 Years | 181 (63.5%) | 104 (36.5%) |
| 45 to 54 Years | 188 (58.6%) | 133 (41.4%) |
| 55 to 64 Years | 400 (77.1%) | 119 (22.9%) |
| 65 to 74 Years | 375 (100.0%) | 0 (0.0%) |
| 75 Years and older | 314 (100.0%) | 0 (0.0%) |
| Total | 1,976 (79.4%) | 514 (20.6%) |
Health Insurance Coverage by Citizenship Status in Apalachicola
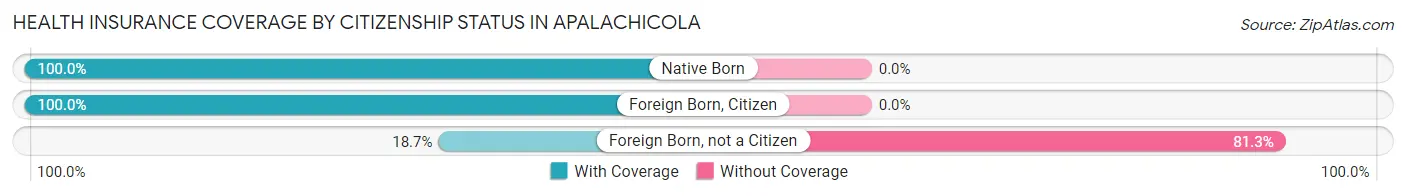
| Citizenship Status | With Coverage | Without Coverage |
| Native Born | 74 (100.0%) | 0 (0.0%) |
| Foreign Born, Citizen | 234 (100.0%) | 0 (0.0%) |
| Foreign Born, not a Citizen | 20 (18.7%) | 87 (81.3%) |
Health Insurance Coverage by Household Income in Apalachicola
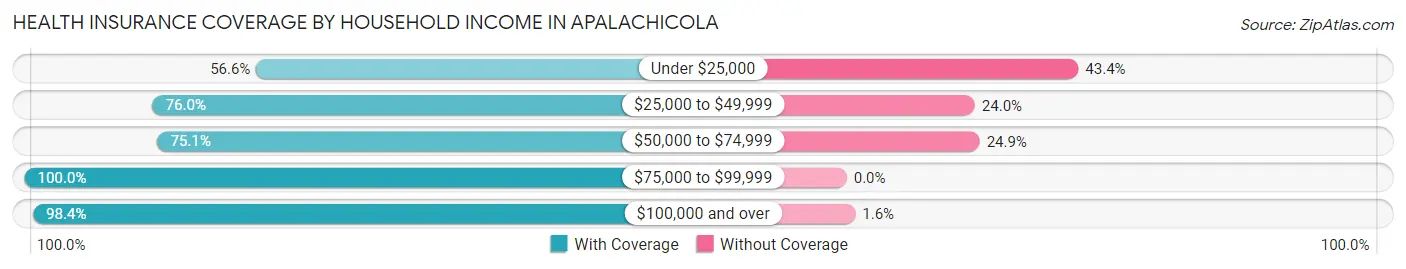
| Household Income | With Coverage | Without Coverage |
| Under $25,000 | 291 (56.6%) | 223 (43.4%) |
| $25,000 to $49,999 | 304 (76.0%) | 96 (24.0%) |
| $50,000 to $74,999 | 558 (75.1%) | 185 (24.9%) |
| $75,000 to $99,999 | 270 (100.0%) | 0 (0.0%) |
| $100,000 and over | 552 (98.4%) | 9 (1.6%) |
Public vs Private Health Insurance Coverage by Age in Apalachicola
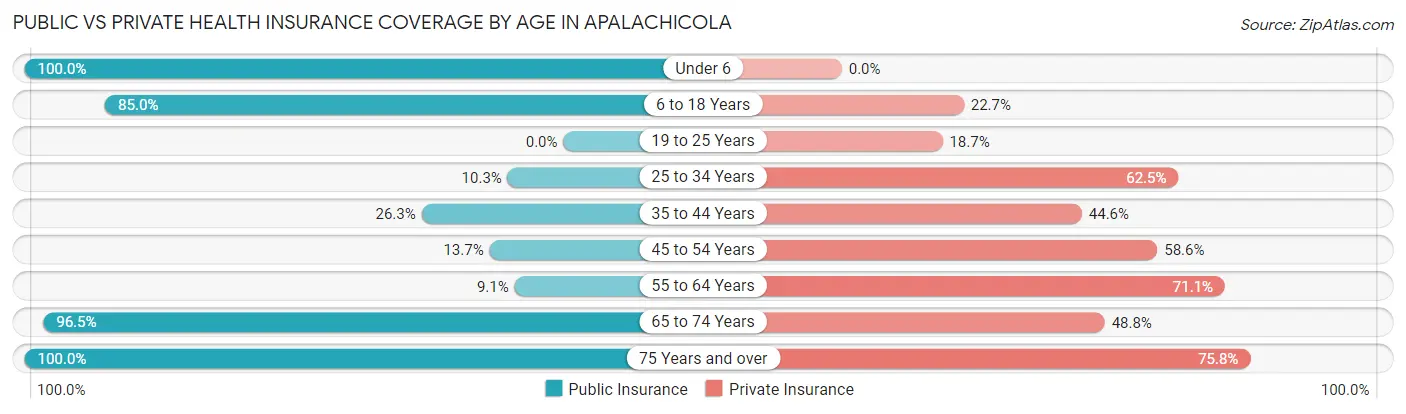
| Age Bracket | Public Insurance | Private Insurance |
| Under 6 | 74 (100.0%) | 0 (0.0%) |
| 6 to 18 Years | 199 (85.0%) | 53 (22.7%) |
| 19 to 25 Years | 0 (0.0%) | 20 (18.7%) |
| 25 to 34 Years | 27 (10.3%) | 163 (62.5%) |
| 35 to 44 Years | 75 (26.3%) | 127 (44.6%) |
| 45 to 54 Years | 44 (13.7%) | 188 (58.6%) |
| 55 to 64 Years | 47 (9.1%) | 369 (71.1%) |
| 65 to 74 Years | 362 (96.5%) | 183 (48.8%) |
| 75 Years and over | 314 (100.0%) | 238 (75.8%) |
| Total | 1,142 (45.9%) | 1,341 (53.9%) |
Disability Status by Sex by Age in Apalachicola
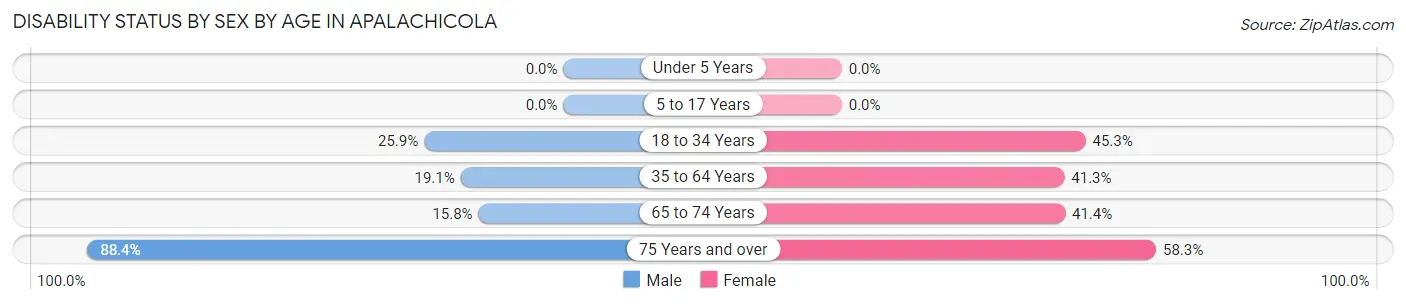
| Age Bracket | Male | Female |
| Under 5 Years | 0 (0.0%) | 0 (0.0%) |
| 5 to 17 Years | 0 (0.0%) | 0 (0.0%) |
| 18 to 34 Years | 38 (25.9%) | 100 (45.3%) |
| 35 to 64 Years | 95 (19.1%) | 259 (41.3%) |
| 65 to 74 Years | 26 (15.8%) | 87 (41.4%) |
| 75 Years and over | 129 (88.4%) | 98 (58.3%) |
Disability Class by Sex by Age in Apalachicola
Disability Class: Hearing Difficulty
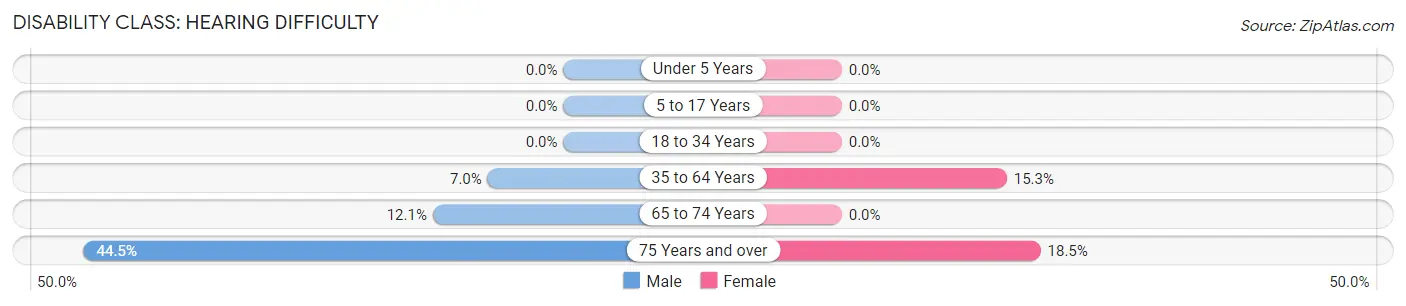
| Age Bracket | Male | Female |
| Under 5 Years | 0 (0.0%) | 0 (0.0%) |
| 5 to 17 Years | 0 (0.0%) | 0 (0.0%) |
| 18 to 34 Years | 0 (0.0%) | 0 (0.0%) |
| 35 to 64 Years | 35 (7.0%) | 96 (15.3%) |
| 65 to 74 Years | 20 (12.1%) | 0 (0.0%) |
| 75 Years and over | 65 (44.5%) | 31 (18.4%) |
Disability Class: Vision Difficulty
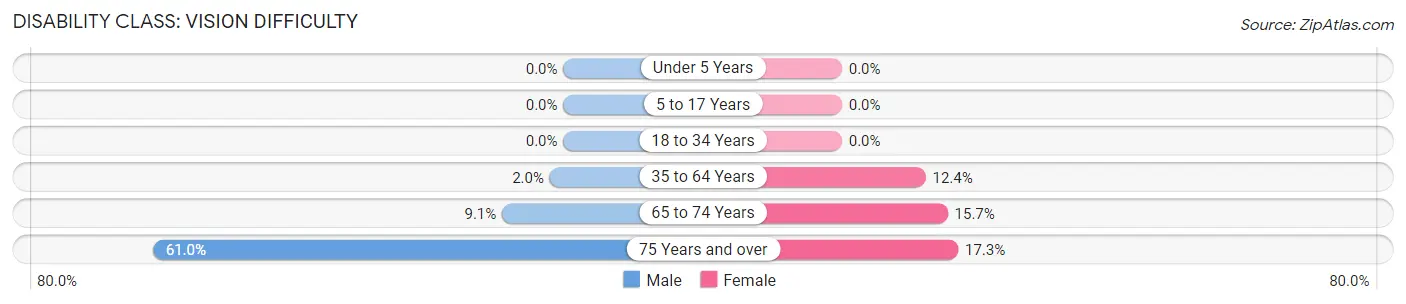
| Age Bracket | Male | Female |
| Under 5 Years | 0 (0.0%) | 0 (0.0%) |
| 5 to 17 Years | 0 (0.0%) | 0 (0.0%) |
| 18 to 34 Years | 0 (0.0%) | 0 (0.0%) |
| 35 to 64 Years | 10 (2.0%) | 78 (12.4%) |
| 65 to 74 Years | 15 (9.1%) | 33 (15.7%) |
| 75 Years and over | 89 (61.0%) | 29 (17.3%) |
Disability Class: Cognitive Difficulty
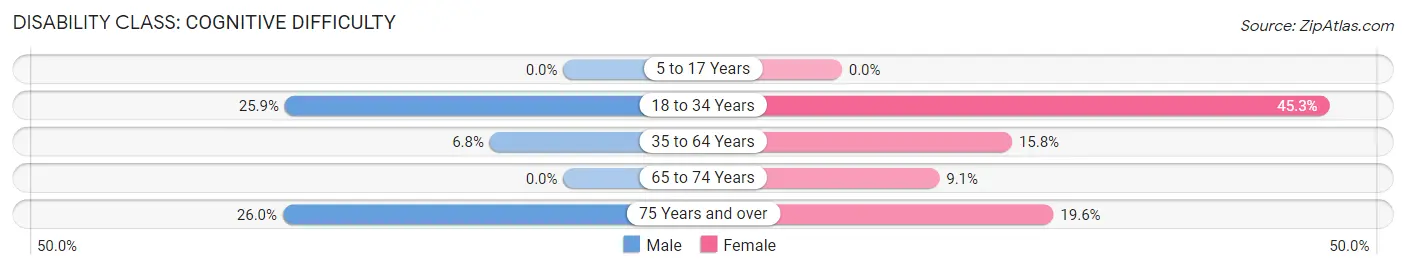
| Age Bracket | Male | Female |
| 5 to 17 Years | 0 (0.0%) | 0 (0.0%) |
| 18 to 34 Years | 38 (25.9%) | 100 (45.3%) |
| 35 to 64 Years | 34 (6.8%) | 99 (15.8%) |
| 65 to 74 Years | 0 (0.0%) | 19 (9.0%) |
| 75 Years and over | 38 (26.0%) | 33 (19.6%) |
Disability Class: Ambulatory Difficulty
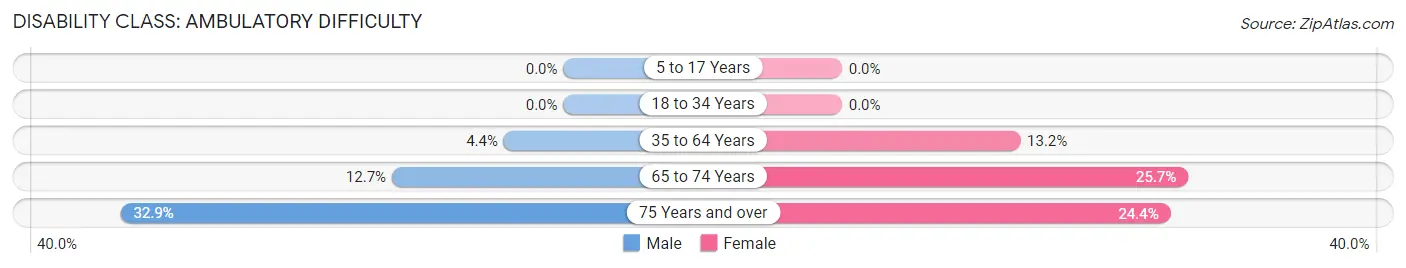
| Age Bracket | Male | Female |
| 5 to 17 Years | 0 (0.0%) | 0 (0.0%) |
| 18 to 34 Years | 0 (0.0%) | 0 (0.0%) |
| 35 to 64 Years | 22 (4.4%) | 83 (13.2%) |
| 65 to 74 Years | 21 (12.7%) | 54 (25.7%) |
| 75 Years and over | 48 (32.9%) | 41 (24.4%) |
Disability Class: Self-Care Difficulty
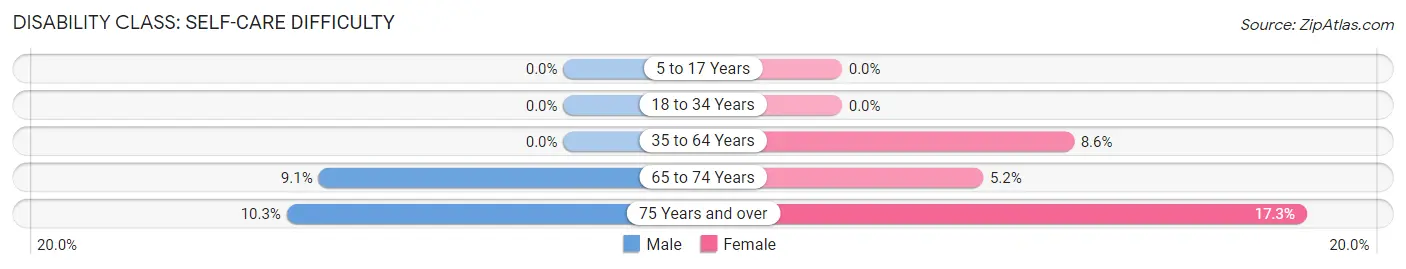
| Age Bracket | Male | Female |
| 5 to 17 Years | 0 (0.0%) | 0 (0.0%) |
| 18 to 34 Years | 0 (0.0%) | 0 (0.0%) |
| 35 to 64 Years | 0 (0.0%) | 54 (8.6%) |
| 65 to 74 Years | 15 (9.1%) | 11 (5.2%) |
| 75 Years and over | 15 (10.3%) | 29 (17.3%) |
Technology Access in Apalachicola
Computing Device Access in Apalachicola
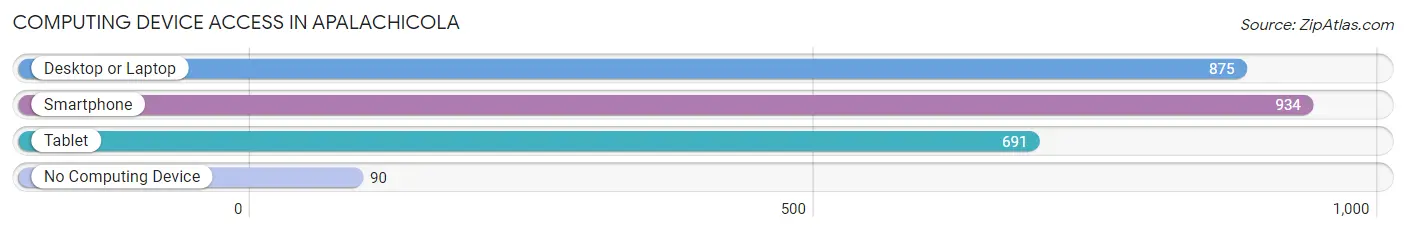
| Device Type | # Households | % Households |
| Desktop or Laptop | 875 | 76.1% |
| Smartphone | 934 | 81.3% |
| Tablet | 691 | 60.1% |
| No Computing Device | 90 | 7.8% |
| Total | 1,149 | 100.0% |
Internet Access in Apalachicola
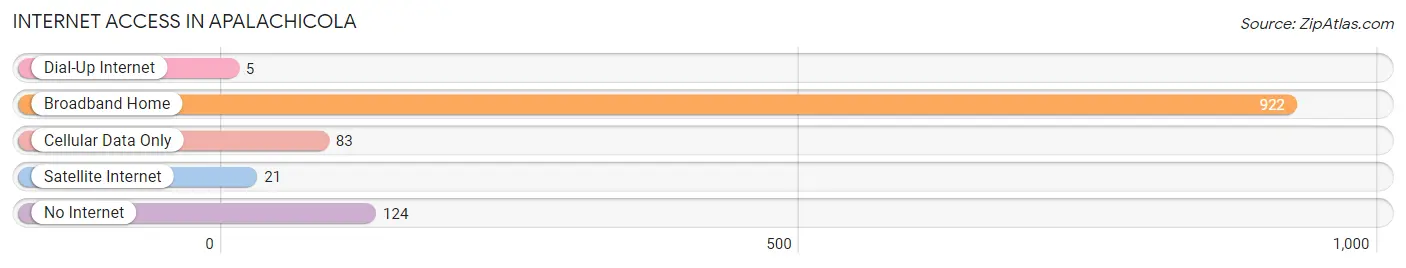
| Internet Type | # Households | % Households |
| Dial-Up Internet | 5 | 0.4% |
| Broadband Home | 922 | 80.2% |
| Cellular Data Only | 83 | 7.2% |
| Satellite Internet | 21 | 1.8% |
| No Internet | 124 | 10.8% |
| Total | 1,149 | 100.0% |
Apalachicola Summary
Apalachicola is a city located in Franklin County, Florida, United States. It is situated along the Apalachicola River, approximately 90 miles south of Tallahassee. The city is the county seat of Franklin County and is the largest city in the county. As of the 2010 census, the population was 2,231, making it the least populous city in Florida.
History
The area around Apalachicola has been inhabited for thousands of years by indigenous peoples. The Apalachicola tribe, a Muskogean-speaking people, had a village in the area when the first Europeans arrived in the 16th century. The first Europeans to visit the area were Spanish explorers, who arrived in 1528. The area was part of the Spanish colony of Florida until 1821, when it became part of the United States.
In 1836, the town of Apalachicola was founded by John Gorrie, a physician and inventor. Gorrie had come to the area to treat patients suffering from yellow fever. He built a steam-powered ice machine, which he used to make ice for his patients. The town was named after the Apalachicola tribe, which had inhabited the area for centuries.
In the 19th century, Apalachicola became a major port for the shipping of cotton and other goods. The town was also a center for the seafood industry, with oysters, shrimp, and other seafood being harvested from the nearby Apalachicola Bay.
Geography
Apalachicola is located in Franklin County, Florida, at the mouth of the Apalachicola River. The city is situated on the Gulf of Mexico, approximately 90 miles south of Tallahassee. The city has a total area of 4.2 square miles, of which 3.9 square miles is land and 0.3 square miles is water.
Economy
Apalachicola is a major center for the seafood industry, with oysters, shrimp, and other seafood being harvested from the nearby Apalachicola Bay. The city is also home to several seafood processing plants.
The city is also a popular tourist destination, with visitors coming to enjoy the city's historic downtown, its waterfront parks, and its many seafood restaurants.
Demographics
As of the 2010 census, there were 2,231 people, 990 households, and 545 families residing in the city. The population density was 571.2 people per square mile. There were 1,093 housing units at an average density of 279.3 per square mile. The racial makeup of the city was 79.2% White, 17.3% African American, 0.3% Native American, 0.7% Asian, 0.1% Pacific Islander, 0.7% from other races, and 1.7% from two or more races. Hispanic or Latino of any race were 3.2% of the population.
There were 990 households, out of which 22.2% had children under the age of 18 living with them, 37.2% were married couples living together, 16.3% had a female householder with no husband present, and 41.7% were non-families. 35.2% of all households were made up of individuals, and 14.2% had someone living alone who was 65 years of age or older. The average household size was 2.20 and the average family size was 2.80.
In the city, the population was spread out, with 21.2% under the age of 18, 8.2% from 18 to 24, 24.2% from 25 to 44, 27.2% from 45 to 64, and 19.2% who were 65 years of age or older. The median age was 41 years. For every 100 females, there were 87.2 males. For every 100 females age 18 and over, there were 83.2 males.
The median income for a household in the city was $27,917, and the median income for a family was $35,625. Males had a median income of $27,917 versus $21,250 for females. The per capita income for the city was $17,845. About 16.2% of families and 20.2% of the population were below the poverty line, including 28.2% of those under age 18 and 16.7% of those age 65 or over.
Common Questions
What is Per Capita Income in Apalachicola?
Per Capita income in Apalachicola is $36,053.
What is the Median Family Income in Apalachicola?
Median Family Income in Apalachicola is $63,125.
What is the Median Household income in Apalachicola?
Median Household Income in Apalachicola is $61,322.
What is Income or Wage Gap in Apalachicola?
Income or Wage Gap in Apalachicola is 5.5%.
Women in Apalachicola earn 94.5 cents for every dollar earned by a man.
What is Inequality or Gini Index in Apalachicola?
Inequality or Gini Index in Apalachicola is 0.46.
What is the Total Population of Apalachicola?
Total Population of Apalachicola is 2,504.
What is the Total Male Population of Apalachicola?
Total Male Population of Apalachicola is 1,139.
What is the Total Female Population of Apalachicola?
Total Female Population of Apalachicola is 1,365.
What is the Ratio of Males per 100 Females in Apalachicola?
There are 83.44 Males per 100 Females in Apalachicola.
What is the Ratio of Females per 100 Males in Apalachicola?
There are 119.84 Females per 100 Males in Apalachicola.
What is the Median Population Age in Apalachicola?
Median Population Age in Apalachicola is 53.8 Years.
What is the Average Family Size in Apalachicola
Average Family Size in Apalachicola is 2.9 People.
What is the Average Household Size in Apalachicola
Average Household Size in Apalachicola is 2.2 People.
How Large is the Labor Force in Apalachicola?
There are 1,126 People in the Labor Forcein in Apalachicola.
What is the Percentage of People in the Labor Force in Apalachicola?
51.0% of People are in the Labor Force in Apalachicola.
What is the Unemployment Rate in Apalachicola?
Unemployment Rate in Apalachicola is 8.1%.