Subsaharan African vs Immigrants from Serbia Births to Unmarried Women
COMPARE
Subsaharan African
Immigrants from Serbia
Births to Unmarried Women
Births to Unmarried Women Comparison
Sub-Saharan Africans
Immigrants from Serbia
36.7%
BIRTHS TO UNMARRIED WOMEN
0.1/ 100
METRIC RATING
264th/ 347
METRIC RANK
28.3%
BIRTHS TO UNMARRIED WOMEN
98.9/ 100
METRIC RATING
63rd/ 347
METRIC RANK
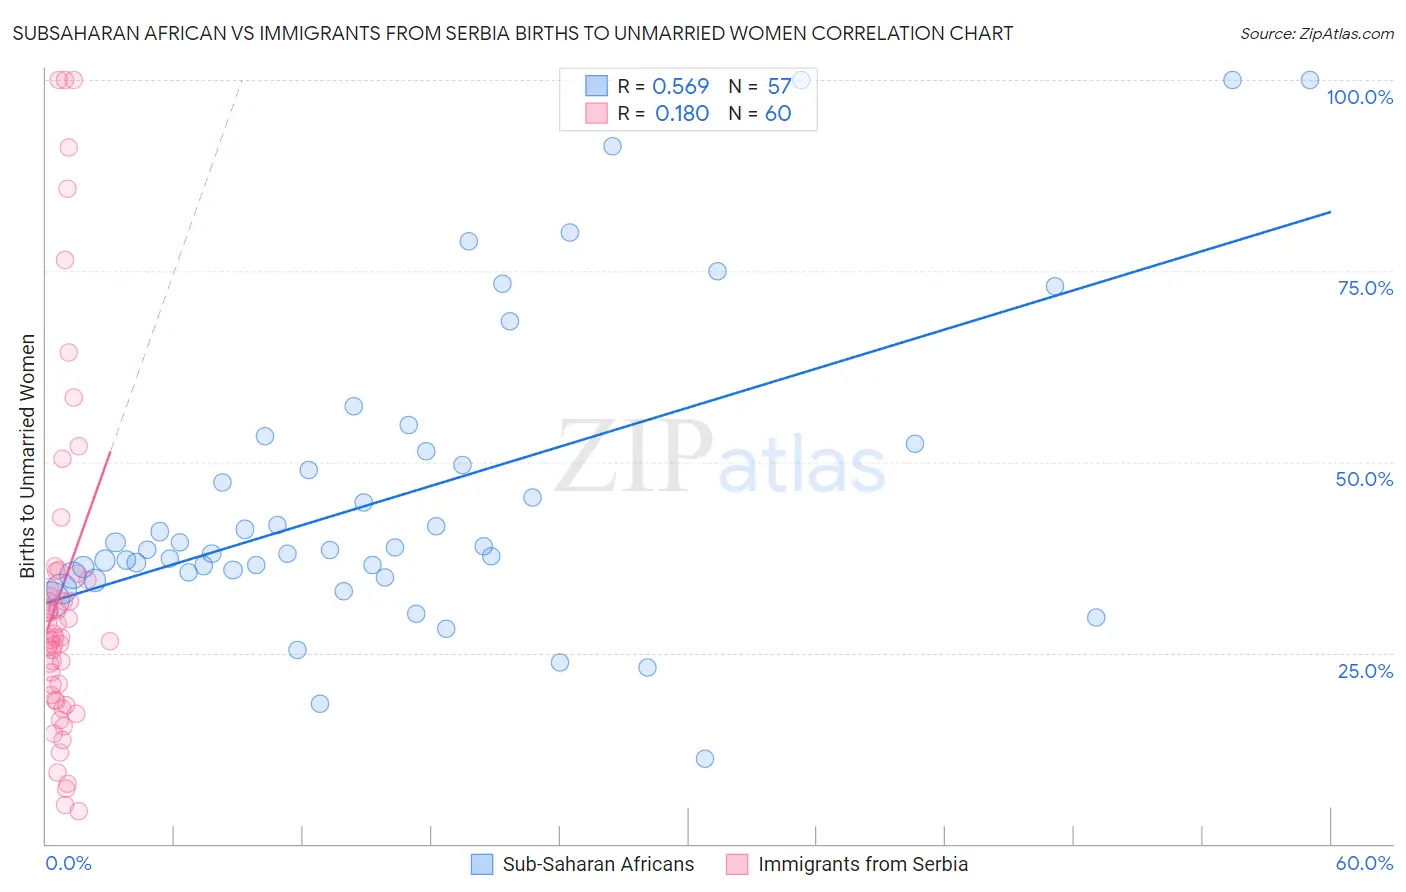
Subsaharan African vs Immigrants from Serbia Births to Unmarried Women Correlation Chart
The statistical analysis conducted on geographies consisting of 468,897,335 people shows a substantial positive correlation between the proportion of Sub-Saharan Africans and percentage of births to unmarried women in the United States with a correlation coefficient (R) of 0.569 and weighted average of 36.7%. Similarly, the statistical analysis conducted on geographies consisting of 126,646,358 people shows a poor positive correlation between the proportion of Immigrants from Serbia and percentage of births to unmarried women in the United States with a correlation coefficient (R) of 0.180 and weighted average of 28.3%, a difference of 29.6%.
Births to Unmarried Women Correlation Summary
| Measurement | Subsaharan African | Immigrants from Serbia |
| Minimum | 11.1% | 4.2% |
| Maximum | 100.0% | 100.0% |
| Range | 88.9% | 95.8% |
| Mean | 45.9% | 33.1% |
| Median | 38.5% | 27.0% |
| Interquartile 25% (IQ1) | 35.3% | 19.1% |
| Interquartile 75% (IQ3) | 51.9% | 35.0% |
| Interquartile Range (IQR) | 16.5% | 15.8% |
| Standard Deviation (Sample) | 20.2% | 23.2% |
| Standard Deviation (Population) | 20.0% | 23.0% |
Similar Demographics by Births to Unmarried Women
Demographics Similar to Sub-Saharan Africans by Births to Unmarried Women
In terms of births to unmarried women, the demographic groups most similar to Sub-Saharan Africans are Cherokee (36.7%, a difference of 0.050%), Immigrants from Senegal (36.7%, a difference of 0.10%), Nicaraguan (36.6%, a difference of 0.12%), French American Indian (36.6%, a difference of 0.14%), and Central American (36.7%, a difference of 0.17%).
| Demographics | Rating | Rank | Births to Unmarried Women |
| Immigrants | Grenada | 0.2 /100 | #257 | Tragic 36.3% |
| Americans | 0.2 /100 | #258 | Tragic 36.4% |
| Immigrants | El Salvador | 0.2 /100 | #259 | Tragic 36.4% |
| Ottawa | 0.2 /100 | #260 | Tragic 36.5% |
| Trinidadians and Tobagonians | 0.2 /100 | #261 | Tragic 36.5% |
| French American Indians | 0.1 /100 | #262 | Tragic 36.6% |
| Nicaraguans | 0.1 /100 | #263 | Tragic 36.6% |
| Sub-Saharan Africans | 0.1 /100 | #264 | Tragic 36.7% |
| Cherokee | 0.1 /100 | #265 | Tragic 36.7% |
| Immigrants | Senegal | 0.1 /100 | #266 | Tragic 36.7% |
| Central Americans | 0.1 /100 | #267 | Tragic 36.7% |
| Comanche | 0.1 /100 | #268 | Tragic 36.7% |
| Senegalese | 0.1 /100 | #269 | Tragic 36.8% |
| Immigrants | Congo | 0.1 /100 | #270 | Tragic 36.8% |
| Immigrants | Barbados | 0.1 /100 | #271 | Tragic 36.8% |
Demographics Similar to Immigrants from Serbia by Births to Unmarried Women
In terms of births to unmarried women, the demographic groups most similar to Immigrants from Serbia are Egyptian (28.2%, a difference of 0.14%), Tongan (28.4%, a difference of 0.38%), Immigrants from Czechoslovakia (28.4%, a difference of 0.40%), Immigrants from Egypt (28.4%, a difference of 0.42%), and Immigrants from North Macedonia (28.1%, a difference of 0.46%).
| Demographics | Rating | Rank | Births to Unmarried Women |
| Immigrants | Belgium | 99.3 /100 | #56 | Exceptional 28.0% |
| Russians | 99.2 /100 | #57 | Exceptional 28.0% |
| Immigrants | Albania | 99.2 /100 | #58 | Exceptional 28.0% |
| Immigrants | Kazakhstan | 99.1 /100 | #59 | Exceptional 28.1% |
| Immigrants | Turkey | 99.1 /100 | #60 | Exceptional 28.1% |
| Immigrants | North Macedonia | 99.1 /100 | #61 | Exceptional 28.1% |
| Egyptians | 99.0 /100 | #62 | Exceptional 28.2% |
| Immigrants | Serbia | 98.9 /100 | #63 | Exceptional 28.3% |
| Tongans | 98.8 /100 | #64 | Exceptional 28.4% |
| Immigrants | Czechoslovakia | 98.8 /100 | #65 | Exceptional 28.4% |
| Immigrants | Egypt | 98.8 /100 | #66 | Exceptional 28.4% |
| Palestinians | 98.7 /100 | #67 | Exceptional 28.4% |
| Immigrants | Europe | 98.7 /100 | #68 | Exceptional 28.4% |
| Bolivians | 98.7 /100 | #69 | Exceptional 28.5% |
| Laotians | 98.6 /100 | #70 | Exceptional 28.5% |