Immigrants from Sierra Leone vs Immigrants from Kuwait Married-couple Households
COMPARE
Immigrants from Sierra Leone
Immigrants from Kuwait
Married-couple Households
Married-couple Households Comparison
Immigrants from Sierra Leone
Immigrants from Kuwait
43.3%
MARRIED-COUPLE HOUSEHOLDS
0.1/ 100
METRIC RATING
269th/ 347
METRIC RANK
46.0%
MARRIED-COUPLE HOUSEHOLDS
25.6/ 100
METRIC RATING
190th/ 347
METRIC RANK
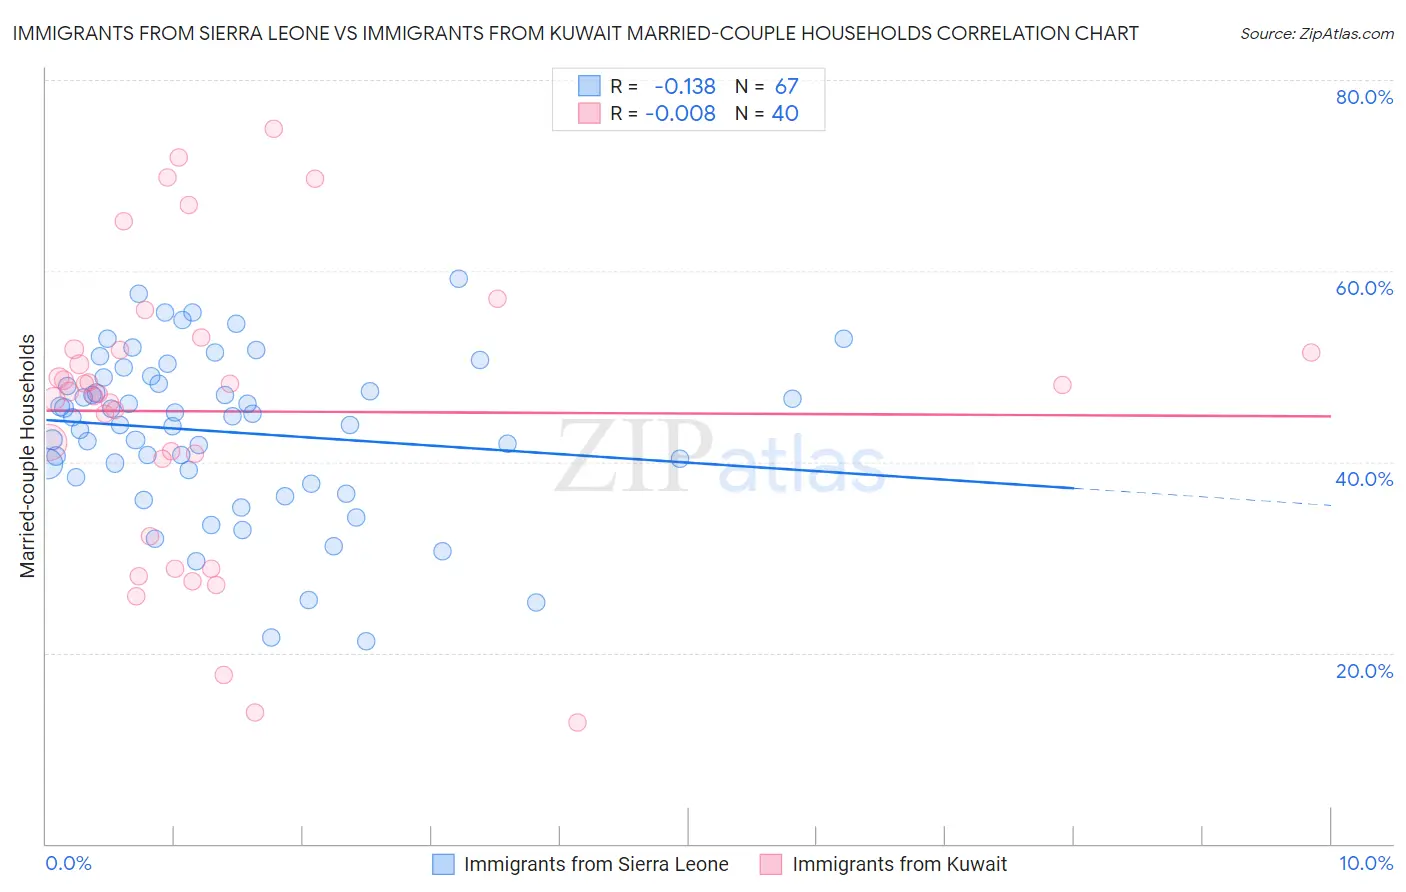
Immigrants from Sierra Leone vs Immigrants from Kuwait Married-couple Households Correlation Chart
The statistical analysis conducted on geographies consisting of 101,644,825 people shows a poor negative correlation between the proportion of Immigrants from Sierra Leone and percentage of married-couple family households in the United States with a correlation coefficient (R) of -0.138 and weighted average of 43.3%. Similarly, the statistical analysis conducted on geographies consisting of 136,888,250 people shows no correlation between the proportion of Immigrants from Kuwait and percentage of married-couple family households in the United States with a correlation coefficient (R) of -0.008 and weighted average of 46.0%, a difference of 6.1%.
Married-couple Households Correlation Summary
| Measurement | Immigrants from Sierra Leone | Immigrants from Kuwait |
| Minimum | 21.3% | 12.7% |
| Maximum | 59.2% | 74.9% |
| Range | 37.9% | 62.1% |
| Mean | 43.1% | 45.3% |
| Median | 44.6% | 47.2% |
| Interquartile 25% (IQ1) | 38.3% | 36.3% |
| Interquartile 75% (IQ3) | 48.8% | 51.7% |
| Interquartile Range (IQR) | 10.5% | 15.5% |
| Standard Deviation (Sample) | 8.5% | 15.3% |
| Standard Deviation (Population) | 8.4% | 15.1% |
Similar Demographics by Married-couple Households
Demographics Similar to Immigrants from Sierra Leone by Married-couple Households
In terms of married-couple households, the demographic groups most similar to Immigrants from Sierra Leone are Yuman (43.3%, a difference of 0.050%), Guatemalan (43.3%, a difference of 0.15%), Immigrants from Burma/Myanmar (43.4%, a difference of 0.21%), Immigrants from Nigeria (43.2%, a difference of 0.26%), and Native/Alaskan (43.5%, a difference of 0.31%).
| Demographics | Rating | Rank | Married-couple Households |
| Vietnamese | 0.2 /100 | #262 | Tragic 43.6% |
| Cree | 0.1 /100 | #263 | Tragic 43.6% |
| Bangladeshis | 0.1 /100 | #264 | Tragic 43.5% |
| Moroccans | 0.1 /100 | #265 | Tragic 43.5% |
| Ecuadorians | 0.1 /100 | #266 | Tragic 43.5% |
| Natives/Alaskans | 0.1 /100 | #267 | Tragic 43.5% |
| Immigrants | Burma/Myanmar | 0.1 /100 | #268 | Tragic 43.4% |
| Immigrants | Sierra Leone | 0.1 /100 | #269 | Tragic 43.3% |
| Yuman | 0.1 /100 | #270 | Tragic 43.3% |
| Guatemalans | 0.1 /100 | #271 | Tragic 43.3% |
| Immigrants | Nigeria | 0.1 /100 | #272 | Tragic 43.2% |
| Ethiopians | 0.1 /100 | #273 | Tragic 43.2% |
| Nigerians | 0.1 /100 | #274 | Tragic 43.2% |
| Immigrants | Bangladesh | 0.0 /100 | #275 | Tragic 43.1% |
| Immigrants | Ethiopia | 0.0 /100 | #276 | Tragic 43.1% |
Demographics Similar to Immigrants from Kuwait by Married-couple Households
In terms of married-couple households, the demographic groups most similar to Immigrants from Kuwait are Choctaw (46.0%, a difference of 0.030%), Immigrants from Northern Africa (46.0%, a difference of 0.050%), Immigrants from Latvia (46.0%, a difference of 0.060%), Taiwanese (45.9%, a difference of 0.11%), and Mexican American Indian (45.9%, a difference of 0.12%).
| Demographics | Rating | Rank | Married-couple Households |
| Immigrants | Brazil | 38.3 /100 | #183 | Fair 46.2% |
| Immigrants | Switzerland | 36.9 /100 | #184 | Fair 46.2% |
| Brazilians | 35.9 /100 | #185 | Fair 46.2% |
| Albanians | 31.1 /100 | #186 | Fair 46.1% |
| Fijians | 29.2 /100 | #187 | Fair 46.1% |
| South American Indians | 28.4 /100 | #188 | Fair 46.0% |
| Immigrants | Latvia | 26.9 /100 | #189 | Fair 46.0% |
| Immigrants | Kuwait | 25.6 /100 | #190 | Fair 46.0% |
| Choctaw | 24.9 /100 | #191 | Fair 46.0% |
| Immigrants | Northern Africa | 24.6 /100 | #192 | Fair 46.0% |
| Taiwanese | 23.4 /100 | #193 | Fair 45.9% |
| Mexican American Indians | 23.3 /100 | #194 | Fair 45.9% |
| Chickasaw | 22.7 /100 | #195 | Fair 45.9% |
| Immigrants | South America | 22.2 /100 | #196 | Fair 45.9% |
| Cambodians | 21.3 /100 | #197 | Fair 45.9% |