Immigrants from Sierra Leone vs Immigrants from Uruguay Married-couple Households
COMPARE
Immigrants from Sierra Leone
Immigrants from Uruguay
Married-couple Households
Married-couple Households Comparison
Immigrants from Sierra Leone
Immigrants from Uruguay
43.3%
MARRIED-COUPLE HOUSEHOLDS
0.1/ 100
METRIC RATING
269th/ 347
METRIC RANK
44.5%
MARRIED-COUPLE HOUSEHOLDS
1.1/ 100
METRIC RATING
238th/ 347
METRIC RANK
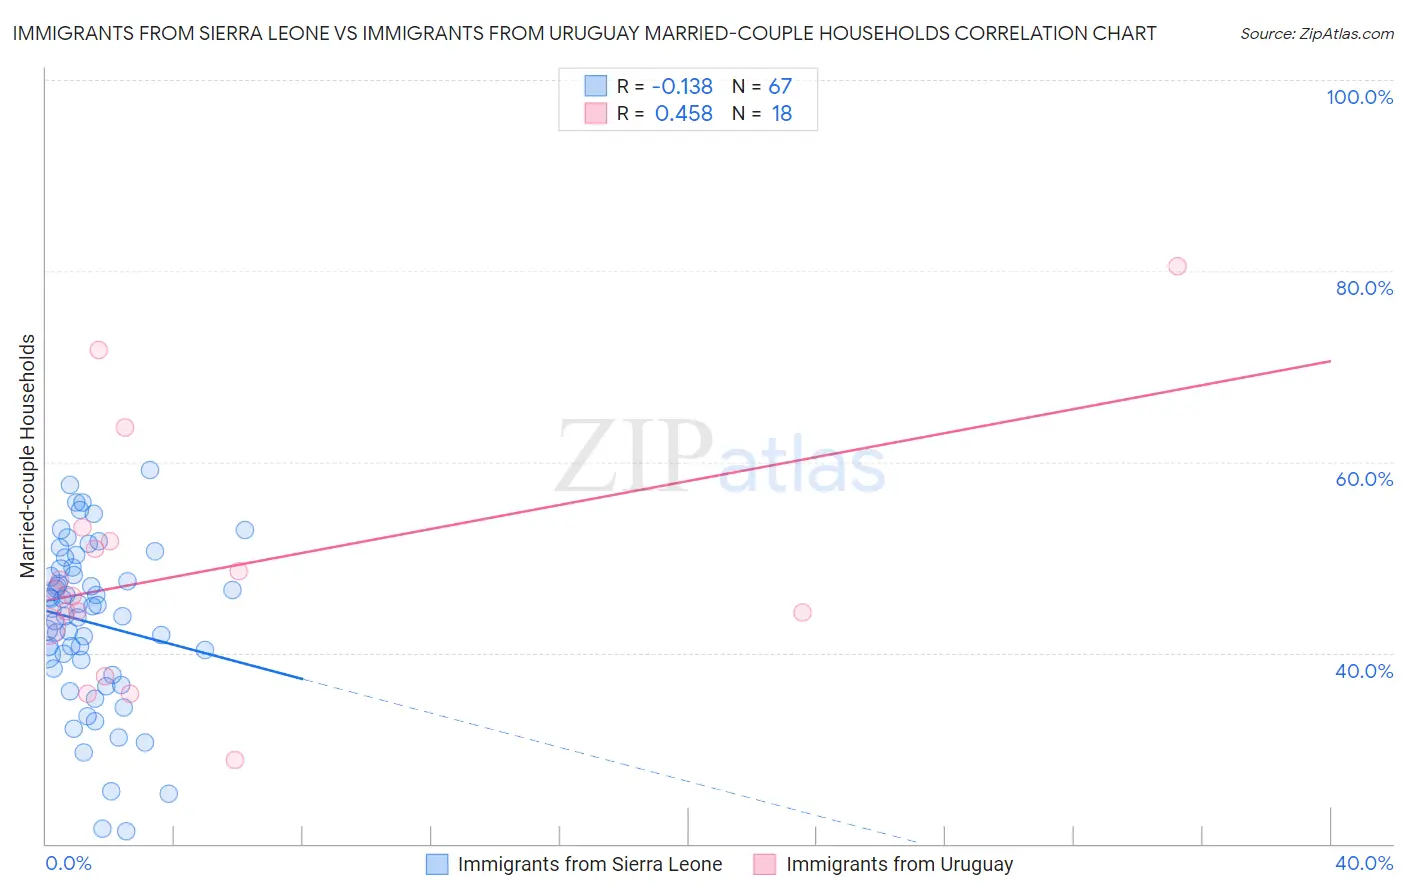
Immigrants from Sierra Leone vs Immigrants from Uruguay Married-couple Households Correlation Chart
The statistical analysis conducted on geographies consisting of 101,644,825 people shows a poor negative correlation between the proportion of Immigrants from Sierra Leone and percentage of married-couple family households in the United States with a correlation coefficient (R) of -0.138 and weighted average of 43.3%. Similarly, the statistical analysis conducted on geographies consisting of 133,245,142 people shows a moderate positive correlation between the proportion of Immigrants from Uruguay and percentage of married-couple family households in the United States with a correlation coefficient (R) of 0.458 and weighted average of 44.5%, a difference of 2.7%.
Married-couple Households Correlation Summary
| Measurement | Immigrants from Sierra Leone | Immigrants from Uruguay |
| Minimum | 21.3% | 28.8% |
| Maximum | 59.2% | 80.5% |
| Range | 37.9% | 51.7% |
| Mean | 43.1% | 48.5% |
| Median | 44.6% | 46.2% |
| Interquartile 25% (IQ1) | 38.3% | 42.8% |
| Interquartile 75% (IQ3) | 48.8% | 51.7% |
| Interquartile Range (IQR) | 10.5% | 8.9% |
| Standard Deviation (Sample) | 8.5% | 12.7% |
| Standard Deviation (Population) | 8.4% | 12.4% |
Similar Demographics by Married-couple Households
Demographics Similar to Immigrants from Sierra Leone by Married-couple Households
In terms of married-couple households, the demographic groups most similar to Immigrants from Sierra Leone are Yuman (43.3%, a difference of 0.050%), Guatemalan (43.3%, a difference of 0.15%), Immigrants from Burma/Myanmar (43.4%, a difference of 0.21%), Immigrants from Nigeria (43.2%, a difference of 0.26%), and Native/Alaskan (43.5%, a difference of 0.31%).
| Demographics | Rating | Rank | Married-couple Households |
| Vietnamese | 0.2 /100 | #262 | Tragic 43.6% |
| Cree | 0.1 /100 | #263 | Tragic 43.6% |
| Bangladeshis | 0.1 /100 | #264 | Tragic 43.5% |
| Moroccans | 0.1 /100 | #265 | Tragic 43.5% |
| Ecuadorians | 0.1 /100 | #266 | Tragic 43.5% |
| Natives/Alaskans | 0.1 /100 | #267 | Tragic 43.5% |
| Immigrants | Burma/Myanmar | 0.1 /100 | #268 | Tragic 43.4% |
| Immigrants | Sierra Leone | 0.1 /100 | #269 | Tragic 43.3% |
| Yuman | 0.1 /100 | #270 | Tragic 43.3% |
| Guatemalans | 0.1 /100 | #271 | Tragic 43.3% |
| Immigrants | Nigeria | 0.1 /100 | #272 | Tragic 43.2% |
| Ethiopians | 0.1 /100 | #273 | Tragic 43.2% |
| Nigerians | 0.1 /100 | #274 | Tragic 43.2% |
| Immigrants | Bangladesh | 0.0 /100 | #275 | Tragic 43.1% |
| Immigrants | Ethiopia | 0.0 /100 | #276 | Tragic 43.1% |
Demographics Similar to Immigrants from Uruguay by Married-couple Households
In terms of married-couple households, the demographic groups most similar to Immigrants from Uruguay are Spanish American (44.5%, a difference of 0.020%), Comanche (44.5%, a difference of 0.050%), Yaqui (44.5%, a difference of 0.080%), Immigrants from Nicaragua (44.5%, a difference of 0.090%), and Ute (44.4%, a difference of 0.10%).
| Demographics | Rating | Rank | Married-couple Households |
| Houma | 1.5 /100 | #231 | Tragic 44.6% |
| Marshallese | 1.5 /100 | #232 | Tragic 44.6% |
| Immigrants | Uganda | 1.5 /100 | #233 | Tragic 44.6% |
| Immigrants | Panama | 1.3 /100 | #234 | Tragic 44.6% |
| Immigrants | Nicaragua | 1.2 /100 | #235 | Tragic 44.5% |
| Yaqui | 1.2 /100 | #236 | Tragic 44.5% |
| Comanche | 1.2 /100 | #237 | Tragic 44.5% |
| Immigrants | Uruguay | 1.1 /100 | #238 | Tragic 44.5% |
| Spanish Americans | 1.1 /100 | #239 | Tragic 44.5% |
| Ute | 1.0 /100 | #240 | Tragic 44.4% |
| Immigrants | Bosnia and Herzegovina | 1.0 /100 | #241 | Tragic 44.4% |
| Immigrants | Albania | 1.0 /100 | #242 | Tragic 44.4% |
| Immigrants | Saudi Arabia | 0.9 /100 | #243 | Tragic 44.4% |
| Immigrants | Armenia | 0.7 /100 | #244 | Tragic 44.3% |
| Immigrants | El Salvador | 0.7 /100 | #245 | Tragic 44.3% |