Immigrants from Sierra Leone vs Immigrants from Kuwait Median Earnings

COMPARE

Immigrants from Sierra Leone
Race
Ancestry
AfghanAfricanAlaska NativeAlaskan AthabascanAlbanianAleutAlsatianAmericanApacheArabArapahoArgentineanArmenianAssyrian/Chaldean/SyriacAustralianAustrianBahamianBangladeshiBarbadianBasqueBelgianBelizeanBermudanBhutaneseBlackfeetBolivianBrazilianBritishBritish West IndianBulgarianBurmeseCajunCambodianCanadianCape VerdeanCarpatho RusynCelticCentral AmericanCentral American IndianCherokeeCheyenneChickasawChileanChineseChippewaChoctawColombianColvilleComancheCosta RicanCreeCreekCroatianCrowCubanCypriotCzechCzechoslovakianDanishDelawareDominicanDutchDutch West IndianEastern EuropeanEcuadorianEgyptianEnglishEstonianEthiopianEuropeanFijianFilipinoFinnishFrenchFrench American IndianFrench CanadianGermanGerman RussianGhanaianGreekGuamanian/ChamorroGuatemalanGuyaneseHaitianHmongHonduranHopiHoumaHungarianIcelanderIndian (Asian)IndonesianInupiatIranianIraqiIrishIroquoisIsraeliItalianJamaicanJapaneseJordanianKenyanKiowaKoreanLaotianLatvianLebaneseLiberianLithuanianLumbeeLuxembourgerMacedonianMalaysianMalteseMarshalleseMenomineeMexicanMexican American IndianMongolianMoroccanNative HawaiianNavajoNepaleseNew ZealanderNicaraguanNigerianNorthern EuropeanNorwegianOkinawanOsageOttawaPaiutePakistaniPalestinianPanamanianParaguayanPennsylvania GermanPeruvianPimaPolishPortuguesePotawatomiPuebloPuerto RicanPuget Sound SalishRomanianRussianSalvadoranSamoanScandinavianScotch-IrishScottishSeminoleSenegaleseSerbianShoshoneSierra LeoneanSiouxSlavicSlovakSloveneSomaliSouth AfricanSouth AmericanSouth American IndianSoviet UnionSpaniardSpanishSpanish AmericanSpanish American IndianSri LankanSubsaharan AfricanSudaneseSwedishSwissSyrianTaiwaneseThaiTlingit-HaidaTohono O'OdhamTonganTrinidadian and TobagonianTsimshianTurkishU.S. Virgin IslanderUgandanUkrainianUruguayanUteVenezuelanVietnameseWelshWest IndianYakamaYaquiYugoslavianYumanYup'ikZimbabwean
Immigration
NonimmigrantsImmigrantsAfghanistanAfricaAlbaniaArgentinaArmeniaAsiaAustraliaAustriaBahamasBangladeshBarbadosBelarusBelgiumBelizeBoliviaBosnia and HerzegovinaBrazilBulgariaBurma/MyanmarCabo VerdeCambodiaCameroonCanadaCaribbeanCentral AmericaChileChinaColombiaCongoCosta RicaCroatiaCubaCzechoslovakiaDenmarkDominicaDominican RepublicEastern AfricaEastern AsiaEastern EuropeEcuadorEgyptEl SalvadorEnglandEritreaEthiopiaEuropeFijiFranceGermanyGhanaGreeceGrenadaGuatemalaGuyanaHaitiHondurasHong KongHungaryIndiaIndonesiaIranIraqIrelandIsraelItalyJamaicaJapanJordanKazakhstanKenyaKoreaLaosLatin AmericaLatviaLebanonLiberiaLithuaniaMalaysiaMexicoMicronesiaMiddle AfricaMoldovaMoroccoNepalNetherlandsNicaraguaNigeriaNorth AmericaNorth MacedoniaNorthern AfricaNorthern EuropeNorwayOceaniaPakistanPanamaPeruPhilippinesPolandPortugalRomaniaRussiaSaudi ArabiaScotlandSenegalSerbiaSierra LeoneSingaporeSomaliaSouth AfricaSouth AmericaSouth Central AsiaSouth Eastern AsiaSouthern EuropeSpainSri LankaSt. Vincent and the GrenadinesSudanSwedenSwitzerlandSyriaTaiwanThailandTrinidad and TobagoTurkeyUgandaUkraineUruguayUzbekistanVenezuelaVietnamWest IndiesWestern AfricaWestern AsiaWestern EuropeYemenZaireZimbabweAzores
Immigrants from Kuwait
Race
Ancestry
AfghanAfricanAlaska NativeAlaskan AthabascanAlbanianAleutAlsatianAmericanApacheArabArapahoArgentineanArmenianAssyrian/Chaldean/SyriacAustralianAustrianBahamianBangladeshiBarbadianBasqueBelgianBelizeanBermudanBhutaneseBlackfeetBolivianBrazilianBritishBritish West IndianBulgarianBurmeseCajunCambodianCanadianCape VerdeanCarpatho RusynCelticCentral AmericanCentral American IndianCherokeeCheyenneChickasawChileanChineseChippewaChoctawColombianColvilleComancheCosta RicanCreeCreekCroatianCrowCubanCypriotCzechCzechoslovakianDanishDelawareDominicanDutchDutch West IndianEastern EuropeanEcuadorianEgyptianEnglishEstonianEthiopianEuropeanFijianFilipinoFinnishFrenchFrench American IndianFrench CanadianGermanGerman RussianGhanaianGreekGuamanian/ChamorroGuatemalanGuyaneseHaitianHmongHonduranHopiHoumaHungarianIcelanderIndian (Asian)IndonesianInupiatIranianIraqiIrishIroquoisIsraeliItalianJamaicanJapaneseJordanianKenyanKiowaKoreanLaotianLatvianLebaneseLiberianLithuanianLumbeeLuxembourgerMacedonianMalaysianMalteseMarshalleseMenomineeMexicanMexican American IndianMongolianMoroccanNative HawaiianNavajoNepaleseNew ZealanderNicaraguanNigerianNorthern EuropeanNorwegianOkinawanOsageOttawaPaiutePakistaniPalestinianPanamanianParaguayanPennsylvania GermanPeruvianPimaPolishPortuguesePotawatomiPuebloPuerto RicanPuget Sound SalishRomanianRussianSalvadoranSamoanScandinavianScotch-IrishScottishSeminoleSenegaleseSerbianShoshoneSierra LeoneanSiouxSlavicSlovakSloveneSomaliSouth AfricanSouth AmericanSouth American IndianSoviet UnionSpaniardSpanishSpanish AmericanSpanish American IndianSri LankanSubsaharan AfricanSudaneseSwedishSwissSyrianTaiwaneseThaiTlingit-HaidaTohono O'OdhamTonganTrinidadian and TobagonianTsimshianTurkishU.S. Virgin IslanderUgandanUkrainianUruguayanUteVenezuelanVietnameseWelshWest IndianYakamaYaquiYugoslavianYumanYup'ikZimbabwean
Immigration
NonimmigrantsImmigrantsAfghanistanAfricaAlbaniaArgentinaArmeniaAsiaAustraliaAustriaBahamasBangladeshBarbadosBelarusBelgiumBelizeBoliviaBosnia and HerzegovinaBrazilBulgariaBurma/MyanmarCabo VerdeCambodiaCameroonCanadaCaribbeanCentral AmericaChileChinaColombiaCongoCosta RicaCroatiaCubaCzechoslovakiaDenmarkDominicaDominican RepublicEastern AfricaEastern AsiaEastern EuropeEcuadorEgyptEl SalvadorEnglandEritreaEthiopiaEuropeFijiFranceGermanyGhanaGreeceGrenadaGuatemalaGuyanaHaitiHondurasHong KongHungaryIndiaIndonesiaIranIraqIrelandIsraelItalyJamaicaJapanJordanKazakhstanKenyaKoreaKuwaitLaosLatin AmericaLatviaLebanonLiberiaLithuaniaMalaysiaMexicoMicronesiaMiddle AfricaMoldovaMoroccoNepalNetherlandsNicaraguaNigeriaNorth AmericaNorth MacedoniaNorthern AfricaNorthern EuropeNorwayOceaniaPakistanPanamaPeruPhilippinesPolandPortugalRomaniaRussiaSaudi ArabiaScotlandSenegalSerbiaSingaporeSomaliaSouth AfricaSouth AmericaSouth Central AsiaSouth Eastern AsiaSouthern EuropeSpainSri LankaSt. Vincent and the GrenadinesSudanSwedenSwitzerlandSyriaTaiwanThailandTrinidad and TobagoTurkeyUgandaUkraineUruguayUzbekistanVenezuelaVietnamWest IndiesWestern AfricaWestern AsiaWestern EuropeYemenZaireZimbabweAzores
Median Earnings
Income
Poverty
Unemployment
Labor Participation
Family Structure
Vehicle Availability
Education Level
Disability

Median Earnings Comparison

Immigrants from Sierra Leone

Immigrants from Kuwait

Excellent
Exceptional
$47,875
MEDIAN EARNINGS
88.3/ 100
METRIC RATING
141st/ 347
METRIC RANK
$48,861
MEDIAN EARNINGS
96.8/ 100
METRIC RATING
113th/ 347
METRIC RANK

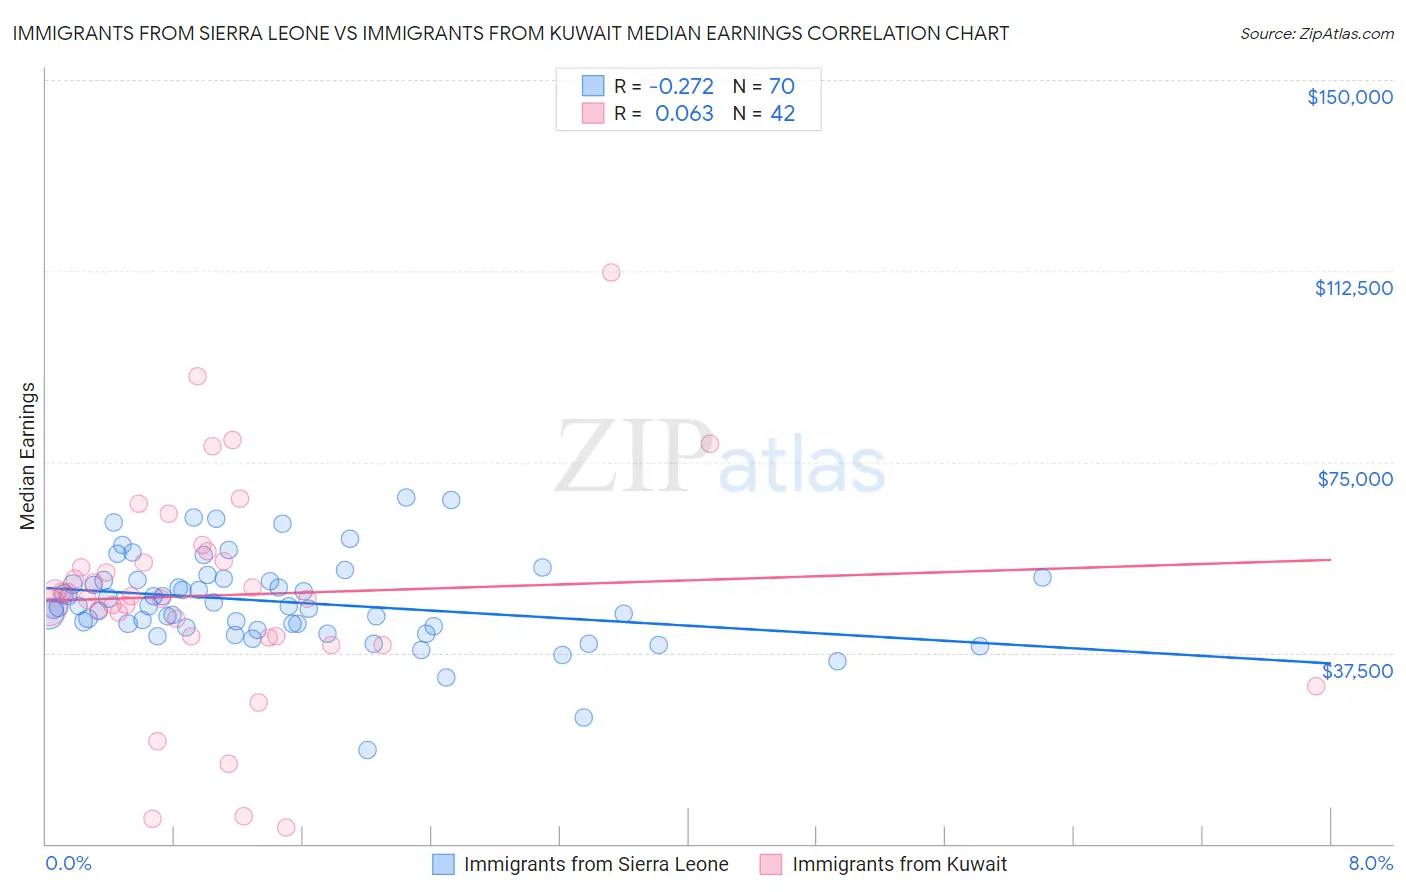
Immigrants from Sierra Leone vs Immigrants from Kuwait Median Earnings Correlation Chart

The statistical analysis conducted on geographies consisting of 101,648,548 people shows a weak negative correlation between the proportion of Immigrants from Sierra Leone and median earnings in the United States with a correlation coefficient (R) of -0.272 and weighted average of $47,875. Similarly, the statistical analysis conducted on geographies consisting of 136,904,336 people shows a slight positive correlation between the proportion of Immigrants from Kuwait and median earnings in the United States with a correlation coefficient (R) of 0.063 and weighted average of $48,861, a difference of 2.1%.
Immigrants from Sierra Leone vs Immigrants from Kuwait Median Earnings

Median Earnings Correlation Summary

MeasurementImmigrants from Sierra LeoneImmigrants from Kuwait
Minimum$18,466$3,079
Maximum$67,883$112,212
Range$49,417$109,133
Mean$47,536$48,846
Median$46,582$48,319
Interquartile 25% (IQ1)$42,603$40,771
Interquartile 75% (IQ3)$51,717$55,536
Interquartile Range (IQR)$9,114$14,765
Standard Deviation (Sample)$8,851$21,440
Standard Deviation (Population)$8,787$21,183

Similar Demographics by Median Earnings

Demographics Similar to Immigrants from Sierra Leone by Median Earnings

In terms of median earnings, the demographic groups most similar to Immigrants from Sierra Leone are Ugandan ($47,854, a difference of 0.040%), Swedish ($47,851, a difference of 0.050%), Taiwanese ($47,902, a difference of 0.060%), European ($47,915, a difference of 0.080%), and Canadian ($47,911, a difference of 0.080%).
DemographicsRating | RankMedian Earnings
Sri Lankans
90.5
/100
|
#134
Exceptional
$48,040
Portuguese
90.4
/100
|
#135
Exceptional
$48,032
Slovenes
90.0
/100
|
#136
Excellent
$47,995
Immigrants | Nepal
89.0
/100
|
#137
Excellent
$47,925
Europeans
88.9
/100
|
#138
Excellent
$47,915
Canadians
88.8
/100
|
#139
Excellent
$47,911
Taiwanese
88.7
/100
|
#140
Excellent
$47,902
Immigrants | Sierra Leone
88.3
/100
|
#141
Excellent
$47,875
Ugandans
88.0
/100
|
#142
Excellent
$47,854
Swedes
88.0
/100
|
#143
Excellent
$47,851
Hungarians
87.1
/100
|
#144
Excellent
$47,795
Immigrants | Saudi Arabia
85.6
/100
|
#145
Excellent
$47,704
Immigrants | Chile
85.5
/100
|
#146
Excellent
$47,697
Immigrants | South Eastern Asia
85.0
/100
|
#147
Excellent
$47,671
Immigrants | Eritrea
84.8
/100
|
#148
Excellent
$47,657

Demographics Similar to Immigrants from Kuwait by Median Earnings

In terms of median earnings, the demographic groups most similar to Immigrants from Kuwait are Northern European ($48,887, a difference of 0.050%), Moroccan ($48,838, a difference of 0.050%), Chinese ($48,836, a difference of 0.050%), Immigrants from Zimbabwe ($48,913, a difference of 0.11%), and Immigrants from Ethiopia ($48,924, a difference of 0.13%).
DemographicsRating | RankMedian Earnings
Immigrants | Albania
98.4
/100
|
#106
Exceptional
$49,377
Immigrants | Morocco
98.4
/100
|
#107
Exceptional
$49,368
Palestinians
98.0
/100
|
#108
Exceptional
$49,209
Syrians
97.1
/100
|
#109
Exceptional
$48,934
Immigrants | Ethiopia
97.1
/100
|
#110
Exceptional
$48,924
Immigrants | Zimbabwe
97.0
/100
|
#111
Exceptional
$48,913
Northern Europeans
96.9
/100
|
#112
Exceptional
$48,887
Immigrants | Kuwait
96.8
/100
|
#113
Exceptional
$48,861
Moroccans
96.7
/100
|
#114
Exceptional
$48,838
Chinese
96.7
/100
|
#115
Exceptional
$48,836
Koreans
96.2
/100
|
#116
Exceptional
$48,727
Serbians
95.9
/100
|
#117
Exceptional
$48,677
Immigrants | Jordan
95.9
/100
|
#118
Exceptional
$48,673
Poles
95.8
/100
|
#119
Exceptional
$48,659
Carpatho Rusyns
95.5
/100
|
#120
Exceptional
$48,617