Peruvian vs Immigrants from Kuwait Married-couple Households
COMPARE
Peruvian
Immigrants from Kuwait
Married-couple Households
Married-couple Households Comparison
Peruvians
Immigrants from Kuwait
47.6%
MARRIED-COUPLE HOUSEHOLDS
93.8/ 100
METRIC RATING
112th/ 347
METRIC RANK
46.0%
MARRIED-COUPLE HOUSEHOLDS
25.6/ 100
METRIC RATING
190th/ 347
METRIC RANK
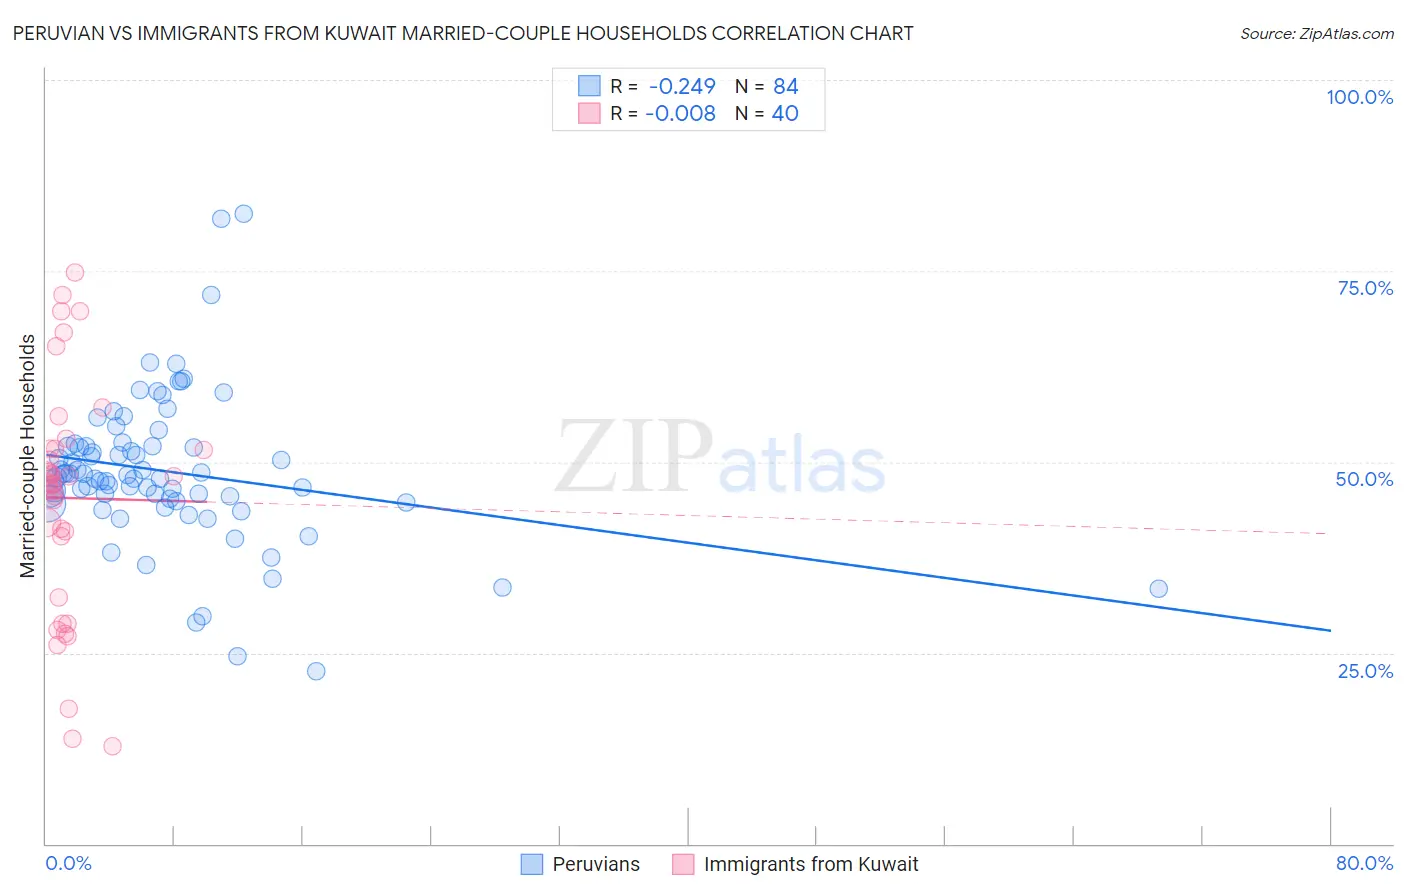
Peruvian vs Immigrants from Kuwait Married-couple Households Correlation Chart
The statistical analysis conducted on geographies consisting of 362,959,523 people shows a weak negative correlation between the proportion of Peruvians and percentage of married-couple family households in the United States with a correlation coefficient (R) of -0.249 and weighted average of 47.6%. Similarly, the statistical analysis conducted on geographies consisting of 136,888,250 people shows no correlation between the proportion of Immigrants from Kuwait and percentage of married-couple family households in the United States with a correlation coefficient (R) of -0.008 and weighted average of 46.0%, a difference of 3.6%.
Married-couple Households Correlation Summary
| Measurement | Peruvian | Immigrants from Kuwait |
| Minimum | 22.6% | 12.7% |
| Maximum | 82.5% | 74.9% |
| Range | 60.0% | 62.1% |
| Mean | 48.8% | 45.3% |
| Median | 48.1% | 47.2% |
| Interquartile 25% (IQ1) | 45.0% | 36.3% |
| Interquartile 75% (IQ3) | 52.0% | 51.7% |
| Interquartile Range (IQR) | 7.0% | 15.5% |
| Standard Deviation (Sample) | 9.8% | 15.3% |
| Standard Deviation (Population) | 9.8% | 15.1% |
Similar Demographics by Married-couple Households
Demographics Similar to Peruvians by Married-couple Households
In terms of married-couple households, the demographic groups most similar to Peruvians are Syrian (47.6%, a difference of 0.010%), Venezuelan (47.6%, a difference of 0.010%), Macedonian (47.6%, a difference of 0.020%), Immigrants from Europe (47.6%, a difference of 0.020%), and Immigrants from Jordan (47.7%, a difference of 0.040%).
| Demographics | Rating | Rank | Married-couple Households |
| Immigrants | Czechoslovakia | 95.5 /100 | #105 | Exceptional 47.8% |
| Portuguese | 95.5 /100 | #106 | Exceptional 47.8% |
| Estonians | 94.7 /100 | #107 | Exceptional 47.7% |
| Immigrants | Japan | 94.4 /100 | #108 | Exceptional 47.7% |
| Immigrants | Jordan | 94.1 /100 | #109 | Exceptional 47.7% |
| Macedonians | 93.9 /100 | #110 | Exceptional 47.6% |
| Syrians | 93.9 /100 | #111 | Exceptional 47.6% |
| Peruvians | 93.8 /100 | #112 | Exceptional 47.6% |
| Venezuelans | 93.8 /100 | #113 | Exceptional 47.6% |
| Immigrants | Europe | 93.7 /100 | #114 | Exceptional 47.6% |
| Slovaks | 92.9 /100 | #115 | Exceptional 47.6% |
| Argentineans | 92.5 /100 | #116 | Exceptional 47.5% |
| French Canadians | 92.4 /100 | #117 | Exceptional 47.5% |
| Immigrants | Germany | 92.4 /100 | #118 | Exceptional 47.5% |
| Chileans | 92.2 /100 | #119 | Exceptional 47.5% |
Demographics Similar to Immigrants from Kuwait by Married-couple Households
In terms of married-couple households, the demographic groups most similar to Immigrants from Kuwait are Choctaw (46.0%, a difference of 0.030%), Immigrants from Northern Africa (46.0%, a difference of 0.050%), Immigrants from Latvia (46.0%, a difference of 0.060%), Taiwanese (45.9%, a difference of 0.11%), and Mexican American Indian (45.9%, a difference of 0.12%).
| Demographics | Rating | Rank | Married-couple Households |
| Immigrants | Brazil | 38.3 /100 | #183 | Fair 46.2% |
| Immigrants | Switzerland | 36.9 /100 | #184 | Fair 46.2% |
| Brazilians | 35.9 /100 | #185 | Fair 46.2% |
| Albanians | 31.1 /100 | #186 | Fair 46.1% |
| Fijians | 29.2 /100 | #187 | Fair 46.1% |
| South American Indians | 28.4 /100 | #188 | Fair 46.0% |
| Immigrants | Latvia | 26.9 /100 | #189 | Fair 46.0% |
| Immigrants | Kuwait | 25.6 /100 | #190 | Fair 46.0% |
| Choctaw | 24.9 /100 | #191 | Fair 46.0% |
| Immigrants | Northern Africa | 24.6 /100 | #192 | Fair 46.0% |
| Taiwanese | 23.4 /100 | #193 | Fair 45.9% |
| Mexican American Indians | 23.3 /100 | #194 | Fair 45.9% |
| Chickasaw | 22.7 /100 | #195 | Fair 45.9% |
| Immigrants | South America | 22.2 /100 | #196 | Fair 45.9% |
| Cambodians | 21.3 /100 | #197 | Fair 45.9% |