Immigrants from Ecuador vs Immigrants from Kuwait Married-couple Households
COMPARE
Immigrants from Ecuador
Immigrants from Kuwait
Married-couple Households
Married-couple Households Comparison
Immigrants from Ecuador
Immigrants from Kuwait
42.9%
MARRIED-COUPLE HOUSEHOLDS
0.0/ 100
METRIC RATING
280th/ 347
METRIC RANK
46.0%
MARRIED-COUPLE HOUSEHOLDS
25.6/ 100
METRIC RATING
190th/ 347
METRIC RANK
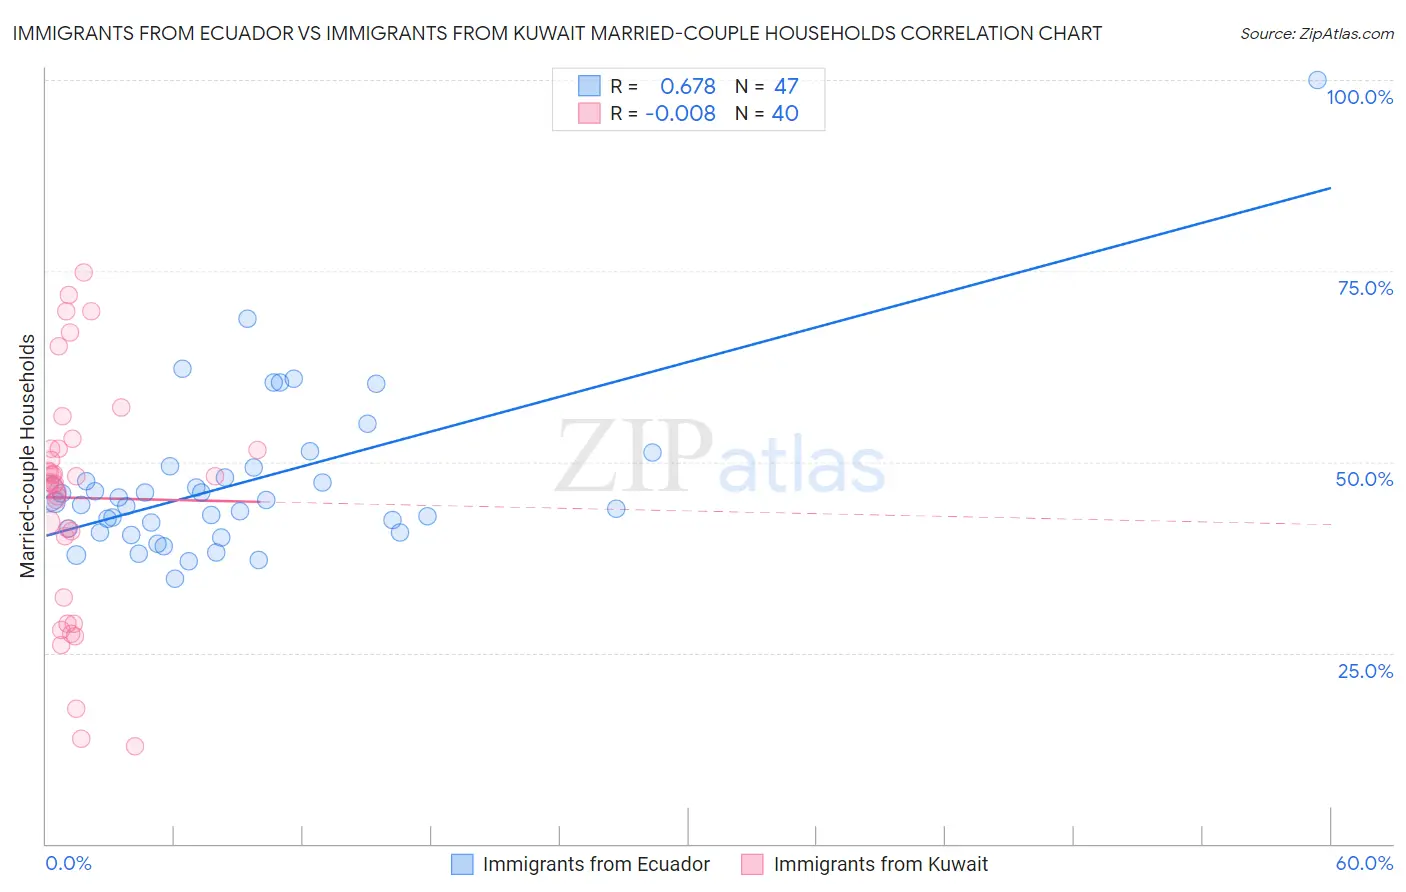
Immigrants from Ecuador vs Immigrants from Kuwait Married-couple Households Correlation Chart
The statistical analysis conducted on geographies consisting of 270,883,052 people shows a significant positive correlation between the proportion of Immigrants from Ecuador and percentage of married-couple family households in the United States with a correlation coefficient (R) of 0.678 and weighted average of 42.9%. Similarly, the statistical analysis conducted on geographies consisting of 136,888,250 people shows no correlation between the proportion of Immigrants from Kuwait and percentage of married-couple family households in the United States with a correlation coefficient (R) of -0.008 and weighted average of 46.0%, a difference of 7.3%.
Married-couple Households Correlation Summary
| Measurement | Immigrants from Ecuador | Immigrants from Kuwait |
| Minimum | 34.8% | 12.7% |
| Maximum | 100.0% | 74.9% |
| Range | 65.2% | 62.1% |
| Mean | 47.2% | 45.3% |
| Median | 44.7% | 47.2% |
| Interquartile 25% (IQ1) | 40.8% | 36.3% |
| Interquartile 75% (IQ3) | 49.2% | 51.7% |
| Interquartile Range (IQR) | 8.5% | 15.5% |
| Standard Deviation (Sample) | 10.9% | 15.3% |
| Standard Deviation (Population) | 10.8% | 15.1% |
Similar Demographics by Married-couple Households
Demographics Similar to Immigrants from Ecuador by Married-couple Households
In terms of married-couple households, the demographic groups most similar to Immigrants from Ecuador are Sierra Leonean (42.9%, a difference of 0.050%), Immigrants from Guatemala (42.8%, a difference of 0.070%), Immigrants from Africa (42.9%, a difference of 0.080%), Immigrants from Eastern Africa (42.9%, a difference of 0.19%), and Immigrants from Ethiopia (43.1%, a difference of 0.45%).
| Demographics | Rating | Rank | Married-couple Households |
| Ethiopians | 0.1 /100 | #273 | Tragic 43.2% |
| Nigerians | 0.1 /100 | #274 | Tragic 43.2% |
| Immigrants | Bangladesh | 0.0 /100 | #275 | Tragic 43.1% |
| Immigrants | Ethiopia | 0.0 /100 | #276 | Tragic 43.1% |
| Immigrants | Eastern Africa | 0.0 /100 | #277 | Tragic 42.9% |
| Immigrants | Africa | 0.0 /100 | #278 | Tragic 42.9% |
| Sierra Leoneans | 0.0 /100 | #279 | Tragic 42.9% |
| Immigrants | Ecuador | 0.0 /100 | #280 | Tragic 42.9% |
| Immigrants | Guatemala | 0.0 /100 | #281 | Tragic 42.8% |
| Bermudans | 0.0 /100 | #282 | Tragic 42.4% |
| Inupiat | 0.0 /100 | #283 | Tragic 42.4% |
| Cheyenne | 0.0 /100 | #284 | Tragic 42.3% |
| Ghanaians | 0.0 /100 | #285 | Tragic 42.2% |
| Belizeans | 0.0 /100 | #286 | Tragic 42.2% |
| Chippewa | 0.0 /100 | #287 | Tragic 42.1% |
Demographics Similar to Immigrants from Kuwait by Married-couple Households
In terms of married-couple households, the demographic groups most similar to Immigrants from Kuwait are Choctaw (46.0%, a difference of 0.030%), Immigrants from Northern Africa (46.0%, a difference of 0.050%), Immigrants from Latvia (46.0%, a difference of 0.060%), Taiwanese (45.9%, a difference of 0.11%), and Mexican American Indian (45.9%, a difference of 0.12%).
| Demographics | Rating | Rank | Married-couple Households |
| Immigrants | Brazil | 38.3 /100 | #183 | Fair 46.2% |
| Immigrants | Switzerland | 36.9 /100 | #184 | Fair 46.2% |
| Brazilians | 35.9 /100 | #185 | Fair 46.2% |
| Albanians | 31.1 /100 | #186 | Fair 46.1% |
| Fijians | 29.2 /100 | #187 | Fair 46.1% |
| South American Indians | 28.4 /100 | #188 | Fair 46.0% |
| Immigrants | Latvia | 26.9 /100 | #189 | Fair 46.0% |
| Immigrants | Kuwait | 25.6 /100 | #190 | Fair 46.0% |
| Choctaw | 24.9 /100 | #191 | Fair 46.0% |
| Immigrants | Northern Africa | 24.6 /100 | #192 | Fair 46.0% |
| Taiwanese | 23.4 /100 | #193 | Fair 45.9% |
| Mexican American Indians | 23.3 /100 | #194 | Fair 45.9% |
| Chickasaw | 22.7 /100 | #195 | Fair 45.9% |
| Immigrants | South America | 22.2 /100 | #196 | Fair 45.9% |
| Cambodians | 21.3 /100 | #197 | Fair 45.9% |