Subsaharan African vs Immigrants from Belgium No Schooling Completed

COMPARE

Subsaharan African
Race
Ancestry
AfghanAfricanAlaska NativeAlaskan AthabascanAlbanianAleutAlsatianAmericanApacheArabArapahoArgentineanArmenianAssyrian/Chaldean/SyriacAustralianAustrianBahamianBangladeshiBarbadianBasqueBelgianBelizeanBermudanBhutaneseBlackfeetBolivianBrazilianBritishBritish West IndianBulgarianBurmeseCajunCambodianCanadianCape VerdeanCarpatho RusynCelticCentral AmericanCentral American IndianCherokeeCheyenneChickasawChileanChineseChippewaChoctawColombianColvilleComancheCosta RicanCreeCreekCroatianCrowCubanCypriotCzechCzechoslovakianDanishDelawareDominicanDutchDutch West IndianEastern EuropeanEcuadorianEgyptianEnglishEstonianEthiopianEuropeanFijianFilipinoFinnishFrenchFrench American IndianFrench CanadianGermanGerman RussianGhanaianGreekGuamanian/ChamorroGuatemalanGuyaneseHaitianHmongHonduranHopiHoumaHungarianIcelanderIndian (Asian)IndonesianInupiatIranianIraqiIrishIroquoisIsraeliItalianJamaicanJapaneseJordanianKenyanKiowaKoreanLaotianLatvianLebaneseLiberianLithuanianLumbeeLuxembourgerMacedonianMalaysianMalteseMarshalleseMenomineeMexicanMexican American IndianMongolianMoroccanNative HawaiianNavajoNepaleseNew ZealanderNicaraguanNigerianNorthern EuropeanNorwegianOkinawanOsageOttawaPaiutePakistaniPalestinianPanamanianParaguayanPennsylvania GermanPeruvianPimaPolishPortuguesePotawatomiPuebloPuerto RicanPuget Sound SalishRomanianRussianSalvadoranSamoanScandinavianScotch-IrishScottishSeminoleSenegaleseSerbianShoshoneSierra LeoneanSiouxSlavicSlovakSloveneSomaliSouth AfricanSouth AmericanSouth American IndianSoviet UnionSpaniardSpanishSpanish AmericanSpanish American IndianSri LankanSubsaharan AfricanSudaneseSwedishSwissSyrianTaiwaneseThaiTlingit-HaidaTohono O'OdhamTonganTrinidadian and TobagonianTsimshianTurkishU.S. Virgin IslanderUgandanUkrainianUruguayanUteVenezuelanVietnameseWelshWest IndianYakamaYaquiYugoslavianYumanYup'ikZimbabwean
Immigration
NonimmigrantsImmigrantsAfghanistanAfricaAlbaniaArgentinaArmeniaAsiaAustraliaAustriaBahamasBangladeshBarbadosBelarusBelizeBoliviaBosnia and HerzegovinaBrazilBulgariaBurma/MyanmarCabo VerdeCambodiaCameroonCanadaCaribbeanCentral AmericaChileChinaColombiaCongoCosta RicaCroatiaCubaCzechoslovakiaDenmarkDominicaDominican RepublicEastern AfricaEastern AsiaEastern EuropeEcuadorEgyptEl SalvadorEnglandEritreaEthiopiaEuropeFijiFranceGermanyGhanaGreeceGrenadaGuatemalaGuyanaHaitiHondurasHong KongHungaryIndiaIndonesiaIranIraqIrelandIsraelItalyJamaicaJapanJordanKazakhstanKenyaKoreaKuwaitLaosLatin AmericaLatviaLebanonLiberiaLithuaniaMalaysiaMexicoMicronesiaMiddle AfricaMoldovaMoroccoNepalNetherlandsNicaraguaNigeriaNorth AmericaNorth MacedoniaNorthern AfricaNorthern EuropeNorwayOceaniaPakistanPanamaPeruPhilippinesPolandPortugalRomaniaRussiaSaudi ArabiaScotlandSenegalSerbiaSierra LeoneSingaporeSomaliaSouth AfricaSouth AmericaSouth Central AsiaSouth Eastern AsiaSouthern EuropeSpainSri LankaSt. Vincent and the GrenadinesSudanSwedenSwitzerlandSyriaTaiwanThailandTrinidad and TobagoTurkeyUgandaUkraineUruguayUzbekistanVenezuelaVietnamWest IndiesWestern AfricaWestern AsiaWestern EuropeYemenZaireZimbabweAzores
Immigrants from Belgium
Race
Ancestry
AfghanAfricanAlaska NativeAlaskan AthabascanAlbanianAleutAlsatianAmericanApacheArabArapahoArgentineanArmenianAssyrian/Chaldean/SyriacAustralianAustrianBahamianBangladeshiBarbadianBasqueBelgianBelizeanBermudanBhutaneseBlackfeetBolivianBrazilianBritishBritish West IndianBulgarianBurmeseCajunCambodianCanadianCape VerdeanCarpatho RusynCelticCentral AmericanCentral American IndianCherokeeCheyenneChickasawChileanChineseChippewaChoctawColombianColvilleComancheCosta RicanCreeCreekCroatianCrowCubanCypriotCzechCzechoslovakianDanishDelawareDominicanDutchDutch West IndianEastern EuropeanEcuadorianEgyptianEnglishEstonianEthiopianEuropeanFijianFilipinoFinnishFrenchFrench American IndianFrench CanadianGermanGerman RussianGhanaianGreekGuamanian/ChamorroGuatemalanGuyaneseHaitianHmongHonduranHopiHoumaHungarianIcelanderIndian (Asian)IndonesianInupiatIranianIraqiIrishIroquoisIsraeliItalianJamaicanJapaneseJordanianKenyanKiowaKoreanLaotianLatvianLebaneseLiberianLithuanianLumbeeLuxembourgerMacedonianMalaysianMalteseMarshalleseMenomineeMexicanMexican American IndianMongolianMoroccanNative HawaiianNavajoNepaleseNew ZealanderNicaraguanNigerianNorthern EuropeanNorwegianOkinawanOsageOttawaPaiutePakistaniPalestinianPanamanianParaguayanPennsylvania GermanPeruvianPimaPolishPortuguesePotawatomiPuebloPuerto RicanPuget Sound SalishRomanianRussianSalvadoranSamoanScandinavianScotch-IrishScottishSeminoleSenegaleseSerbianShoshoneSierra LeoneanSiouxSlavicSlovakSloveneSomaliSouth AfricanSouth AmericanSouth American IndianSoviet UnionSpaniardSpanishSpanish AmericanSpanish American IndianSri LankanSudaneseSwedishSwissSyrianTaiwaneseThaiTlingit-HaidaTohono O'OdhamTonganTrinidadian and TobagonianTsimshianTurkishU.S. Virgin IslanderUgandanUkrainianUruguayanUteVenezuelanVietnameseWelshWest IndianYakamaYaquiYugoslavianYumanYup'ikZimbabwean
Immigration
NonimmigrantsImmigrantsAfghanistanAfricaAlbaniaArgentinaArmeniaAsiaAustraliaAustriaBahamasBangladeshBarbadosBelarusBelgiumBelizeBoliviaBosnia and HerzegovinaBrazilBulgariaBurma/MyanmarCabo VerdeCambodiaCameroonCanadaCaribbeanCentral AmericaChileChinaColombiaCongoCosta RicaCroatiaCubaCzechoslovakiaDenmarkDominicaDominican RepublicEastern AfricaEastern AsiaEastern EuropeEcuadorEgyptEl SalvadorEnglandEritreaEthiopiaEuropeFijiFranceGermanyGhanaGreeceGrenadaGuatemalaGuyanaHaitiHondurasHong KongHungaryIndiaIndonesiaIranIraqIrelandIsraelItalyJamaicaJapanJordanKazakhstanKenyaKoreaKuwaitLaosLatin AmericaLatviaLebanonLiberiaLithuaniaMalaysiaMexicoMicronesiaMiddle AfricaMoldovaMoroccoNepalNetherlandsNicaraguaNigeriaNorth AmericaNorth MacedoniaNorthern AfricaNorthern EuropeNorwayOceaniaPakistanPanamaPeruPhilippinesPolandPortugalRomaniaRussiaSaudi ArabiaScotlandSenegalSerbiaSierra LeoneSingaporeSomaliaSouth AfricaSouth AmericaSouth Central AsiaSouth Eastern AsiaSouthern EuropeSpainSri LankaSt. Vincent and the GrenadinesSudanSwedenSwitzerlandSyriaTaiwanThailandTrinidad and TobagoTurkeyUgandaUkraineUruguayUzbekistanVenezuelaVietnamWest IndiesWestern AfricaWestern AsiaWestern EuropeYemenZaireZimbabweAzores
No Schooling Completed
Income
Poverty
Unemployment
Labor Participation
Family Structure
Vehicle Availability
Education Level
Disability

No Schooling Completed Comparison

Sub-Saharan Africans

Immigrants from Belgium

Tragic
Exceptional
2.3%
NO SCHOOLING COMPLETED
4.7/ 100
METRIC RATING
222nd/ 347
METRIC RANK
1.7%
NO SCHOOLING COMPLETED
99.3/ 100
METRIC RATING
75th/ 347
METRIC RANK

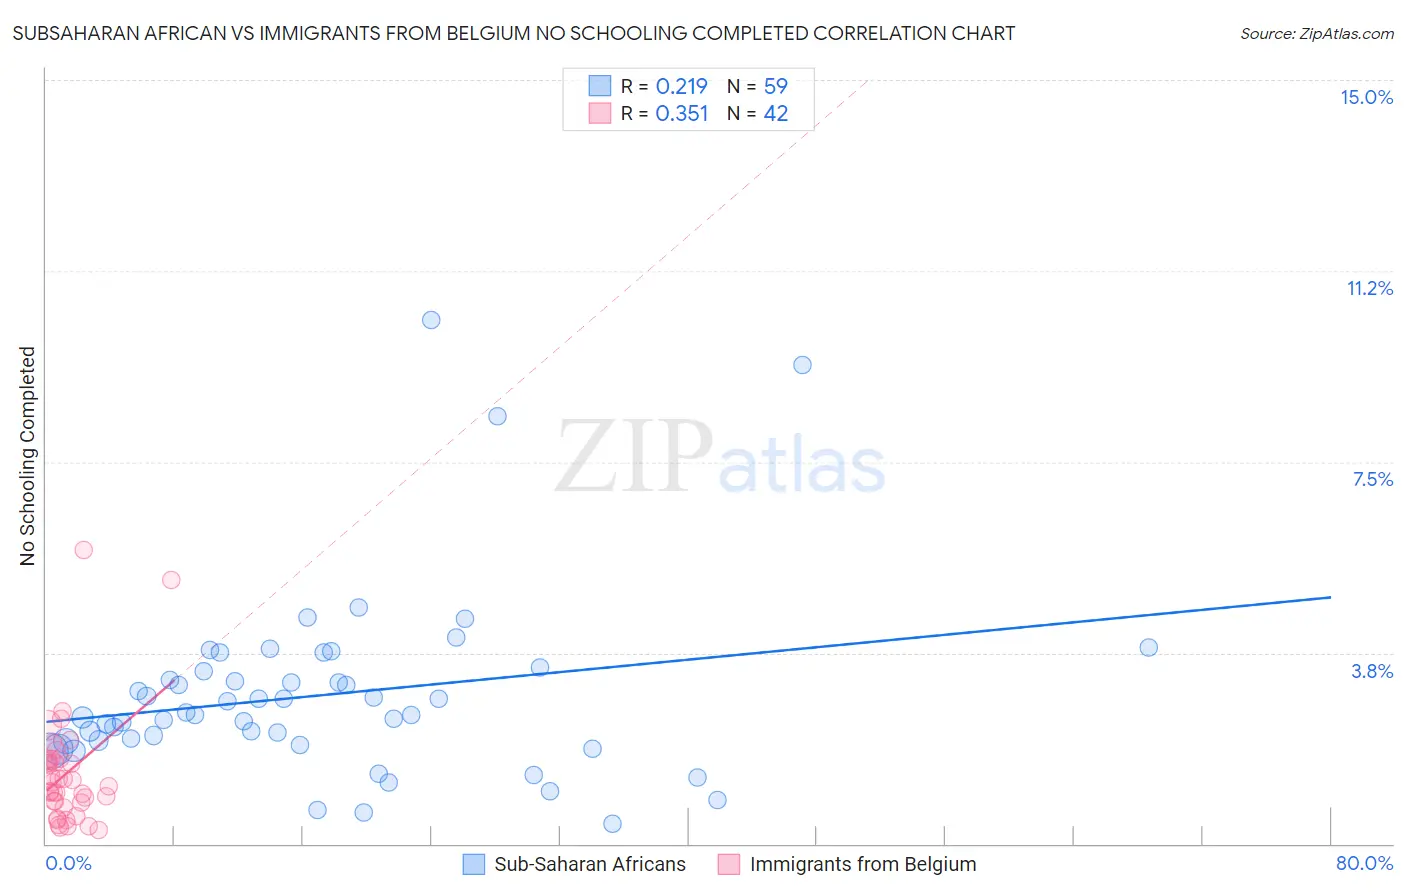
Subsaharan African vs Immigrants from Belgium No Schooling Completed Correlation Chart

The statistical analysis conducted on geographies consisting of 500,622,971 people shows a weak positive correlation between the proportion of Sub-Saharan Africans and percentage of population with no schooling in the United States with a correlation coefficient (R) of 0.219 and weighted average of 2.3%. Similarly, the statistical analysis conducted on geographies consisting of 145,930,186 people shows a mild positive correlation between the proportion of Immigrants from Belgium and percentage of population with no schooling in the United States with a correlation coefficient (R) of 0.351 and weighted average of 1.7%, a difference of 32.4%.
Subsaharan African vs Immigrants from Belgium No Schooling Completed

No Schooling Completed Correlation Summary

MeasurementSubsaharan AfricanImmigrants from Belgium
Minimum0.39%0.28%
Maximum10.3%5.8%
Range9.9%5.5%
Mean2.9%1.4%
Median2.5%1.2%
Interquartile 25% (IQ1)2.0%0.82%
Interquartile 75% (IQ3)3.4%1.7%
Interquartile Range (IQR)1.4%0.84%
Standard Deviation (Sample)1.8%1.1%
Standard Deviation (Population)1.8%1.1%

Similar Demographics by No Schooling Completed

Demographics Similar to Sub-Saharan Africans by No Schooling Completed

In terms of no schooling completed, the demographic groups most similar to Sub-Saharan Africans are Immigrants from Lebanon (2.3%, a difference of 0.15%), Immigrants from Sudan (2.3%, a difference of 0.17%), Immigrants from Costa Rica (2.3%, a difference of 0.26%), Tohono O'odham (2.3%, a difference of 0.44%), and Sudanese (2.3%, a difference of 0.44%).
DemographicsRating | RankNo Schooling Completed
Immigrants | Zaire
7.2
/100
|
#215
Tragic
2.3%
Tongans
6.8
/100
|
#216
Tragic
2.3%
Immigrants | Syria
6.6
/100
|
#217
Tragic
2.3%
Immigrants | Nepal
6.4
/100
|
#218
Tragic
2.3%
Senegalese
5.6
/100
|
#219
Tragic
2.3%
Immigrants | Costa Rica
5.1
/100
|
#220
Tragic
2.3%
Immigrants | Sudan
5.0
/100
|
#221
Tragic
2.3%
Sub-Saharan Africans
4.7
/100
|
#222
Tragic
2.3%
Immigrants | Lebanon
4.5
/100
|
#223
Tragic
2.3%
Tohono O'odham
4.1
/100
|
#224
Tragic
2.3%
Sudanese
4.1
/100
|
#225
Tragic
2.3%
Sierra Leoneans
4.1
/100
|
#226
Tragic
2.3%
Immigrants | Uganda
4.0
/100
|
#227
Tragic
2.3%
U.S. Virgin Islanders
3.7
/100
|
#228
Tragic
2.3%
Immigrants | Pakistan
3.6
/100
|
#229
Tragic
2.3%

Demographics Similar to Immigrants from Belgium by No Schooling Completed

In terms of no schooling completed, the demographic groups most similar to Immigrants from Belgium are Cherokee (1.7%, a difference of 0.040%), Immigrants from Sweden (1.7%, a difference of 0.19%), Delaware (1.7%, a difference of 0.23%), Macedonian (1.7%, a difference of 0.31%), and Cypriot (1.7%, a difference of 0.32%).
DemographicsRating | RankNo Schooling Completed
Immigrants | Lithuania
99.7
/100
|
#68
Exceptional
1.7%
Chickasaw
99.6
/100
|
#69
Exceptional
1.7%
Immigrants | Netherlands
99.6
/100
|
#70
Exceptional
1.7%
Immigrants | England
99.5
/100
|
#71
Exceptional
1.7%
Cajuns
99.5
/100
|
#72
Exceptional
1.7%
Immigrants | India
99.4
/100
|
#73
Exceptional
1.7%
Zimbabweans
99.4
/100
|
#74
Exceptional
1.7%
Immigrants | Belgium
99.3
/100
|
#75
Exceptional
1.7%
Cherokee
99.3
/100
|
#76
Exceptional
1.7%
Immigrants | Sweden
99.3
/100
|
#77
Exceptional
1.7%
Delaware
99.3
/100
|
#78
Exceptional
1.7%
Macedonians
99.3
/100
|
#79
Exceptional
1.7%
Cypriots
99.3
/100
|
#80
Exceptional
1.7%
Icelanders
99.3
/100
|
#81
Exceptional
1.7%
Immigrants | South Africa
99.3
/100
|
#82
Exceptional
1.7%