Fijian vs Eastern European Disability Age Under 5
COMPARE
Fijian
Eastern European
Disability Age Under 5
Disability Age Under 5 Comparison
Fijians
Eastern Europeans
1.2%
DISABILITY AGE UNDER 5
84.7/ 100
METRIC RATING
135th/ 347
METRIC RANK
1.4%
DISABILITY AGE UNDER 5
1.0/ 100
METRIC RATING
248th/ 347
METRIC RANK
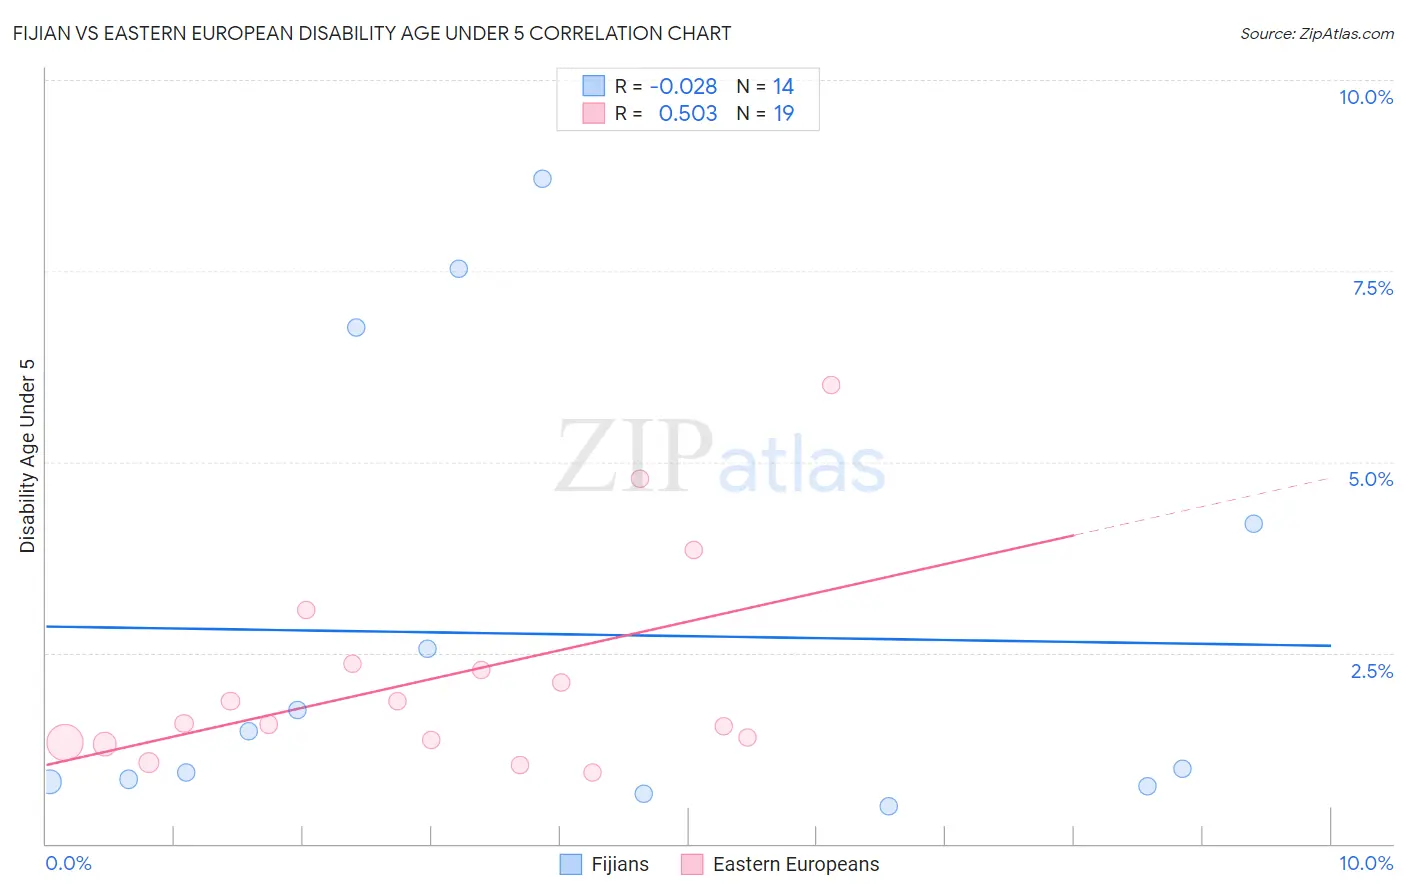
Fijian vs Eastern European Disability Age Under 5 Correlation Chart
The statistical analysis conducted on geographies consisting of 45,950,279 people shows no correlation between the proportion of Fijians and percentage of population with a disability under the age of 5 in the United States with a correlation coefficient (R) of -0.028 and weighted average of 1.2%. Similarly, the statistical analysis conducted on geographies consisting of 231,188,302 people shows a substantial positive correlation between the proportion of Eastern Europeans and percentage of population with a disability under the age of 5 in the United States with a correlation coefficient (R) of 0.503 and weighted average of 1.4%, a difference of 14.8%.
Disability Age Under 5 Correlation Summary
| Measurement | Fijian | Eastern European |
| Minimum | 0.50% | 0.93% |
| Maximum | 8.7% | 6.0% |
| Range | 8.2% | 5.1% |
| Mean | 2.7% | 2.2% |
| Median | 1.2% | 1.6% |
| Interquartile 25% (IQ1) | 0.81% | 1.3% |
| Interquartile 75% (IQ3) | 4.2% | 2.4% |
| Interquartile Range (IQR) | 3.4% | 1.0% |
| Standard Deviation (Sample) | 2.9% | 1.4% |
| Standard Deviation (Population) | 2.8% | 1.3% |
Similar Demographics by Disability Age Under 5
Demographics Similar to Fijians by Disability Age Under 5
In terms of disability age under 5, the demographic groups most similar to Fijians are Moroccan (1.2%, a difference of 0.18%), Argentinean (1.2%, a difference of 0.20%), Immigrants from Eastern Africa (1.2%, a difference of 0.27%), Immigrants from Czechoslovakia (1.2%, a difference of 0.32%), and Immigrants from Spain (1.2%, a difference of 0.36%).
| Demographics | Rating | Rank | Disability Age Under 5 |
| Immigrants | France | 88.4 /100 | #128 | Excellent 1.2% |
| Immigrants | Immigrants | 88.0 /100 | #129 | Excellent 1.2% |
| Koreans | 87.7 /100 | #130 | Excellent 1.2% |
| Immigrants | Serbia | 87.6 /100 | #131 | Excellent 1.2% |
| Immigrants | Eastern Europe | 87.3 /100 | #132 | Excellent 1.2% |
| Immigrants | Spain | 86.5 /100 | #133 | Excellent 1.2% |
| Argentineans | 85.7 /100 | #134 | Excellent 1.2% |
| Fijians | 84.7 /100 | #135 | Excellent 1.2% |
| Moroccans | 83.6 /100 | #136 | Excellent 1.2% |
| Immigrants | Eastern Africa | 83.1 /100 | #137 | Excellent 1.2% |
| Immigrants | Czechoslovakia | 82.8 /100 | #138 | Excellent 1.2% |
| New Zealanders | 81.4 /100 | #139 | Excellent 1.2% |
| Somalis | 80.8 /100 | #140 | Excellent 1.2% |
| Immigrants | Honduras | 80.4 /100 | #141 | Excellent 1.2% |
| Immigrants | Colombia | 79.3 /100 | #142 | Good 1.2% |
Demographics Similar to Eastern Europeans by Disability Age Under 5
In terms of disability age under 5, the demographic groups most similar to Eastern Europeans are Immigrants from England (1.4%, a difference of 0.030%), Russian (1.4%, a difference of 0.050%), Bermudan (1.4%, a difference of 0.080%), African (1.4%, a difference of 0.090%), and Immigrants from Hungary (1.4%, a difference of 0.12%).
| Demographics | Rating | Rank | Disability Age Under 5 |
| Maltese | 2.2 /100 | #241 | Tragic 1.3% |
| Lumbee | 2.1 /100 | #242 | Tragic 1.3% |
| Immigrants | Cameroon | 1.7 /100 | #243 | Tragic 1.4% |
| Spaniards | 1.4 /100 | #244 | Tragic 1.4% |
| Potawatomi | 1.1 /100 | #245 | Tragic 1.4% |
| Russians | 1.0 /100 | #246 | Tragic 1.4% |
| Immigrants | England | 1.0 /100 | #247 | Tragic 1.4% |
| Eastern Europeans | 1.0 /100 | #248 | Tragic 1.4% |
| Bermudans | 1.0 /100 | #249 | Tragic 1.4% |
| Africans | 1.0 /100 | #250 | Tragic 1.4% |
| Immigrants | Hungary | 1.0 /100 | #251 | Tragic 1.4% |
| Immigrants | Scotland | 0.9 /100 | #252 | Tragic 1.4% |
| Australians | 0.7 /100 | #253 | Tragic 1.4% |
| Immigrants | Brazil | 0.7 /100 | #254 | Tragic 1.4% |
| Immigrants | Liberia | 0.6 /100 | #255 | Tragic 1.4% |