Zip Codes with the Highest Percentage of Population Employed in Transportation & Warehousing in Brighton, CO
RELATED REPORTS & OPTIONS
Transportation & Warehousing
Brighton
Compare Zip Codes
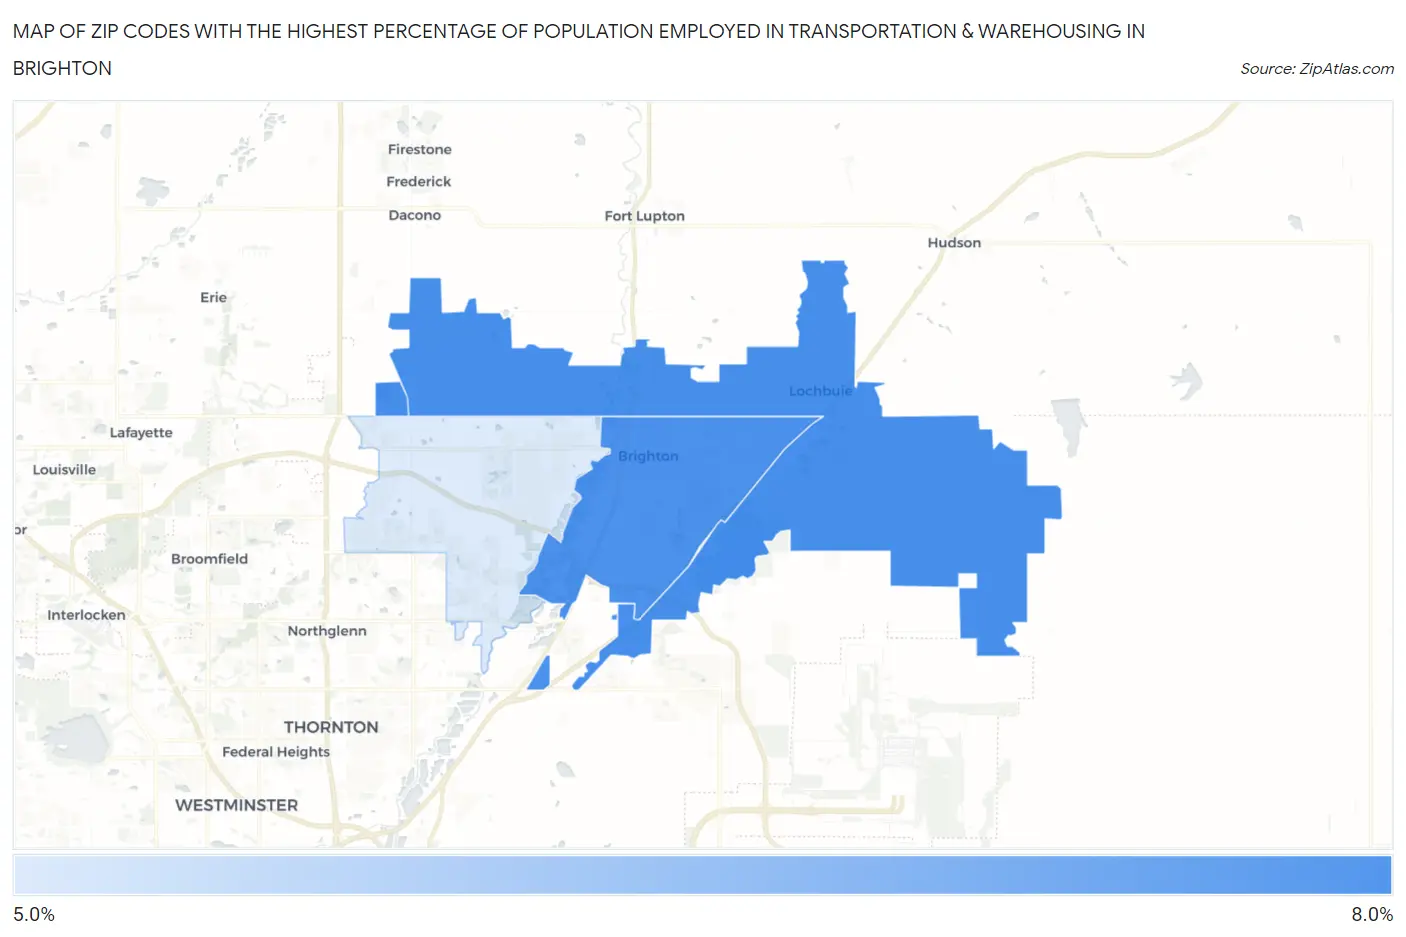
Map of Zip Codes with the Highest Percentage of Population Employed in Transportation & Warehousing in Brighton
5.1%
7.8%
Zip Codes with the Highest Percentage of Population Employed in Transportation & Warehousing in Brighton, CO
| Zip Code | % Employed | vs State | vs National | |
| 1. | 80603 | 7.8% | 4.2%(+3.62)#65 | 4.9%(+2.87)#5,154 |
| 2. | 80601 | 7.7% | 4.2%(+3.53)#67 | 4.9%(+2.79)#5,275 |
| 3. | 80602 | 5.1% | 4.2%(+0.933)#140 | 4.9%(+0.190)#11,484 |
1
Common Questions
What are the Top Zip Codes with the Highest Percentage of Population Employed in Transportation & Warehousing in Brighton, CO?
Top Zip Codes with the Highest Percentage of Population Employed in Transportation & Warehousing in Brighton, CO are:
What zip code has the Highest Percentage of Population Employed in Transportation & Warehousing in Brighton, CO?
80603 has the Highest Percentage of Population Employed in Transportation & Warehousing in Brighton, CO with 7.8%.
What is the Percentage of Population Employed in Transportation & Warehousing in Brighton, CO?
Percentage of Population Employed in Transportation & Warehousing in Brighton is 7.9%.
What is the Percentage of Population Employed in Transportation & Warehousing in Colorado?
Percentage of Population Employed in Transportation & Warehousing in Colorado is 4.2%.
What is the Percentage of Population Employed in Transportation & Warehousing in the United States?
Percentage of Population Employed in Transportation & Warehousing in the United States is 4.9%.