Durango, CO Map & Demographics
Durango Map
Durango Overview
$44,836
PER CAPITA INCOME
$109,515
AVG FAMILY INCOME
$76,177
AVG HOUSEHOLD INCOME
30.2%
WAGE / INCOME GAP [ % ]
69.8¢/ $1
WAGE / INCOME GAP [ $ ]
0.46
INEQUALITY / GINI INDEX
19,148
TOTAL POPULATION
9,803
MALE POPULATION
9,345
FEMALE POPULATION
104.90
MALES / 100 FEMALES
95.33
FEMALES / 100 MALES
36.6
MEDIAN AGE
2.7
AVG FAMILY SIZE
2.1
AVG HOUSEHOLD SIZE
11,268
LABOR FORCE [ PEOPLE ]
67.5%
PERCENT IN LABOR FORCE
2.3%
UNEMPLOYMENT RATE
Durango Area Codes
Income in Durango
Income Overview in Durango
Per Capita Income in Durango is $44,836, while median incomes of families and households are $109,515 and $76,177 respectively.
| Characteristic | Number | Measure |
| Per Capita Income | 19,148 | $44,836 |
| Median Family Income | 4,030 | $109,515 |
| Mean Family Income | 4,030 | $133,953 |
| Median Household Income | 8,139 | $76,177 |
| Mean Household Income | 8,139 | $99,984 |
| Income Deficit | 4,030 | $0 |
| Wage / Income Gap (%) | 19,148 | 30.23% |
| Wage / Income Gap ($) | 19,148 | 69.77¢ per $1 |
| Gini / Inequality Index | 19,148 | 0.46 |
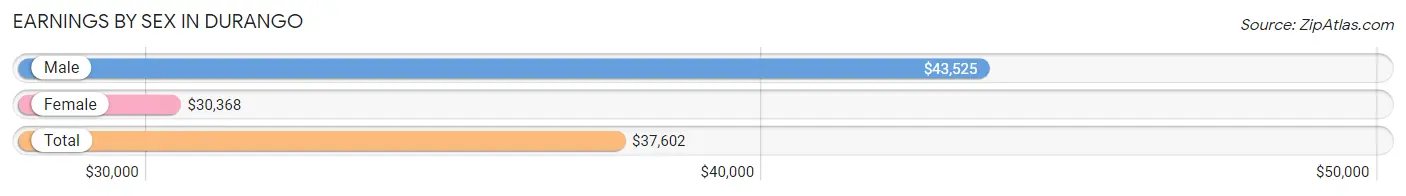
Earnings by Sex in Durango
Average Earnings in Durango are $37,602, $43,525 for men and $30,368 for women, a difference of 30.2%.
| Sex | Number | Average Earnings |
| Male | 6,670 (53.0%) | $43,525 |
| Female | 5,914 (47.0%) | $30,368 |
| Total | 12,584 (100.0%) | $37,602 |
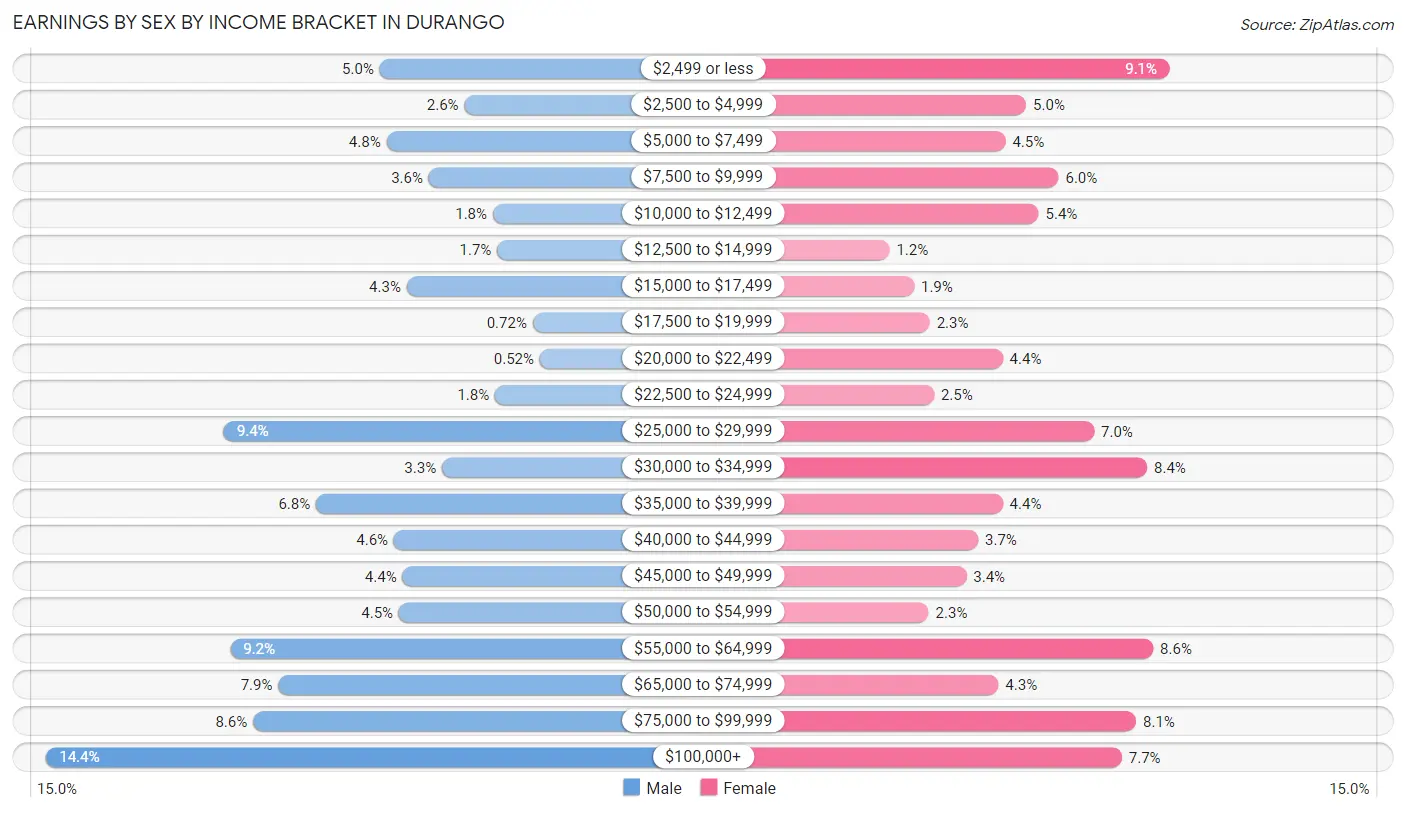
Earnings by Sex by Income Bracket in Durango
The most common earnings brackets in Durango are $100,000+ for men (960 | 14.4%) and $2,499 or less for women (535 | 9.0%).
| Income | Male | Female |
| $2,499 or less | 335 (5.0%) | 535 (9.0%) |
| $2,500 to $4,999 | 176 (2.6%) | 298 (5.0%) |
| $5,000 to $7,499 | 322 (4.8%) | 264 (4.5%) |
| $7,500 to $9,999 | 243 (3.6%) | 352 (5.9%) |
| $10,000 to $12,499 | 123 (1.8%) | 319 (5.4%) |
| $12,500 to $14,999 | 115 (1.7%) | 71 (1.2%) |
| $15,000 to $17,499 | 284 (4.3%) | 112 (1.9%) |
| $17,500 to $19,999 | 48 (0.7%) | 138 (2.3%) |
| $20,000 to $22,499 | 35 (0.5%) | 259 (4.4%) |
| $22,500 to $24,999 | 119 (1.8%) | 145 (2.5%) |
| $25,000 to $29,999 | 627 (9.4%) | 411 (7.0%) |
| $30,000 to $34,999 | 218 (3.3%) | 499 (8.4%) |
| $35,000 to $39,999 | 454 (6.8%) | 259 (4.4%) |
| $40,000 to $44,999 | 308 (4.6%) | 218 (3.7%) |
| $45,000 to $49,999 | 292 (4.4%) | 199 (3.4%) |
| $50,000 to $54,999 | 299 (4.5%) | 136 (2.3%) |
| $55,000 to $64,999 | 615 (9.2%) | 509 (8.6%) |
| $65,000 to $74,999 | 525 (7.9%) | 252 (4.3%) |
| $75,000 to $99,999 | 572 (8.6%) | 481 (8.1%) |
| $100,000+ | 960 (14.4%) | 457 (7.7%) |
| Total | 6,670 (100.0%) | 5,914 (100.0%) |
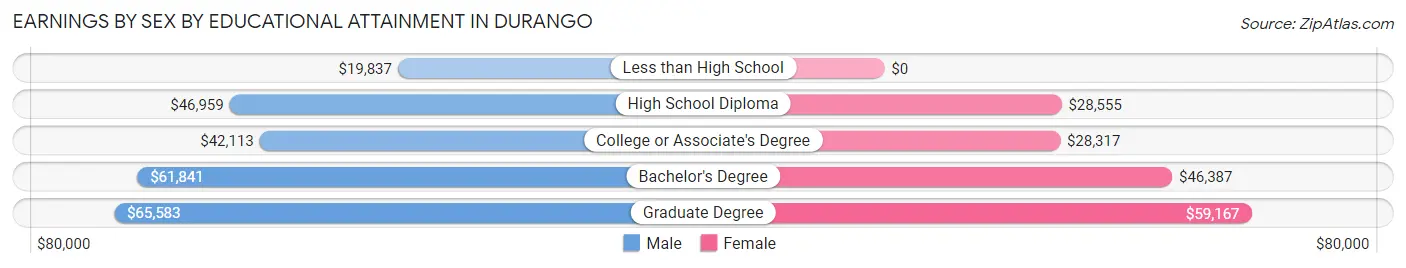
Earnings by Sex by Educational Attainment in Durango
Average earnings in Durango are $56,753 for men and $39,761 for women, a difference of 29.9%. Men with an educational attainment of graduate degree enjoy the highest average annual earnings of $65,583, while those with less than high school education earn the least with $19,837. Women with an educational attainment of graduate degree earn the most with the average annual earnings of $59,167, while those with college or associate's degree education have the smallest earnings of $28,317.
| Educational Attainment | Male Income | Female Income |
| Less than High School | $19,837 | $0 |
| High School Diploma | $46,959 | $28,555 |
| College or Associate's Degree | $42,113 | $28,317 |
| Bachelor's Degree | $61,841 | $46,387 |
| Graduate Degree | $65,583 | $59,167 |
| Total | $56,753 | $39,761 |
Family Income in Durango
Family Income Brackets in Durango
According to the Durango family income data, there are 1,128 families falling into the $100,000 to $149,999 income range, which is the most common income bracket and makes up 28.0% of all families. Conversely, the $10,000 to $14,999 income bracket is the least frequent group with only 36 families (0.9%) belonging to this category.
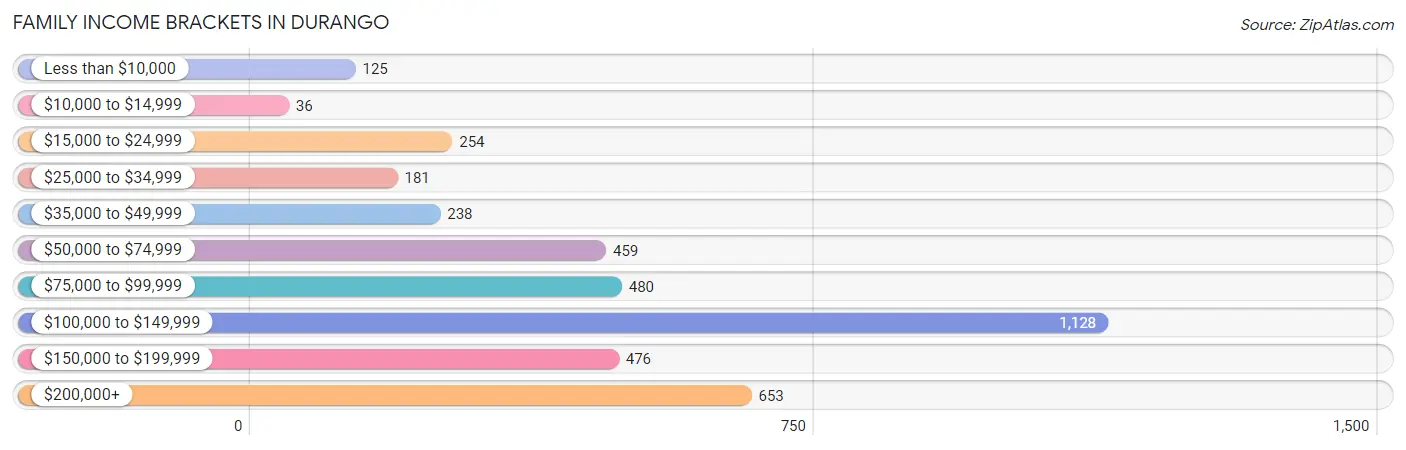
| Income Bracket | # Families | % Families |
| Less than $10,000 | 125 | 3.1% |
| $10,000 to $14,999 | 36 | 0.9% |
| $15,000 to $24,999 | 254 | 6.3% |
| $25,000 to $34,999 | 181 | 4.5% |
| $35,000 to $49,999 | 238 | 5.9% |
| $50,000 to $74,999 | 459 | 11.4% |
| $75,000 to $99,999 | 480 | 11.9% |
| $100,000 to $149,999 | 1,128 | 28.0% |
| $150,000 to $199,999 | 476 | 11.8% |
| $200,000+ | 653 | 16.2% |
Family Income by Famaliy Size in Durango
4-person families (625 | 15.5%) account for the highest median family income in Durango with $136,049 per family, while 2-person families (2,357 | 58.5%) have the highest median income of $51,174 per family member.
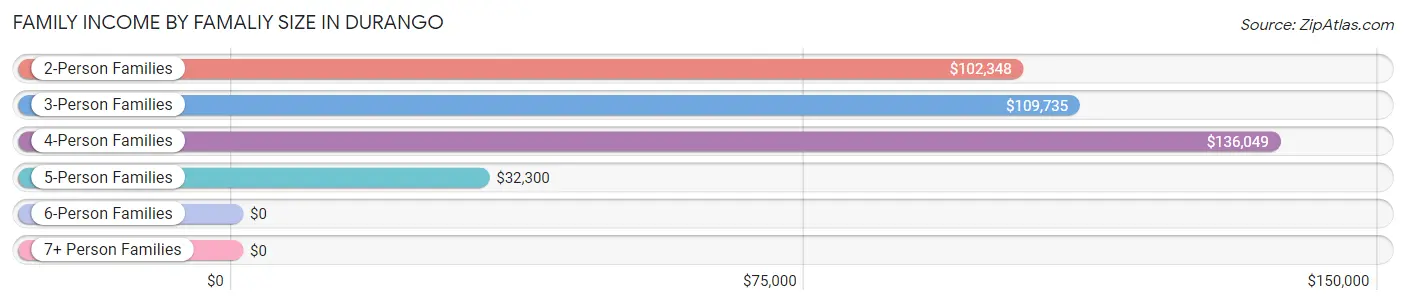
| Income Bracket | # Families | Median Income |
| 2-Person Families | 2,357 (58.5%) | $102,348 |
| 3-Person Families | 797 (19.8%) | $109,735 |
| 4-Person Families | 625 (15.5%) | $136,049 |
| 5-Person Families | 195 (4.8%) | $32,300 |
| 6-Person Families | 0 (0.0%) | $0 |
| 7+ Person Families | 56 (1.4%) | $0 |
| Total | 4,030 (100.0%) | $109,515 |
Family Income by Number of Earners in Durango
The median family income in Durango is $109,515, with families comprising 3+ earners (340) having the highest median family income of $175,556, while families with 1 earner (1,277) have the lowest median family income of $60,888, accounting for 8.4% and 31.7% of families, respectively.
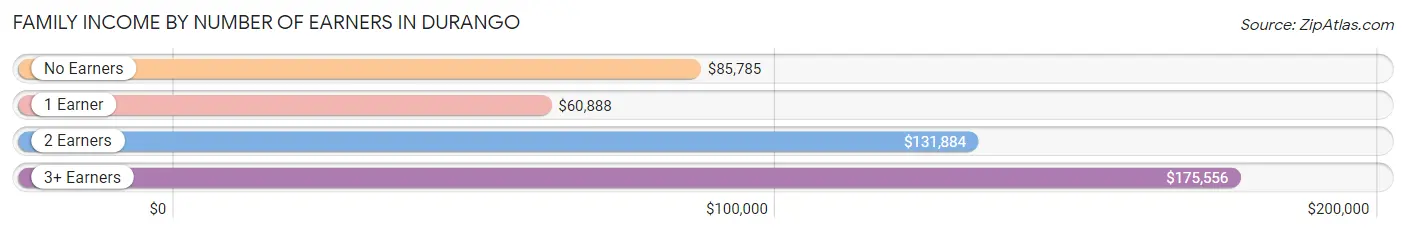
| Number of Earners | # Families | Median Income |
| No Earners | 591 (14.7%) | $85,785 |
| 1 Earner | 1,277 (31.7%) | $60,888 |
| 2 Earners | 1,822 (45.2%) | $131,884 |
| 3+ Earners | 340 (8.4%) | $175,556 |
| Total | 4,030 (100.0%) | $109,515 |
Household Income in Durango
Household Income Brackets in Durango
With 1,465 households falling in the category, the $100,000 to $149,999 income range is the most frequent in Durango, accounting for 18.0% of all households. In contrast, only 163 households (2.0%) fall into the $10,000 to $14,999 income bracket, making it the least populous group.
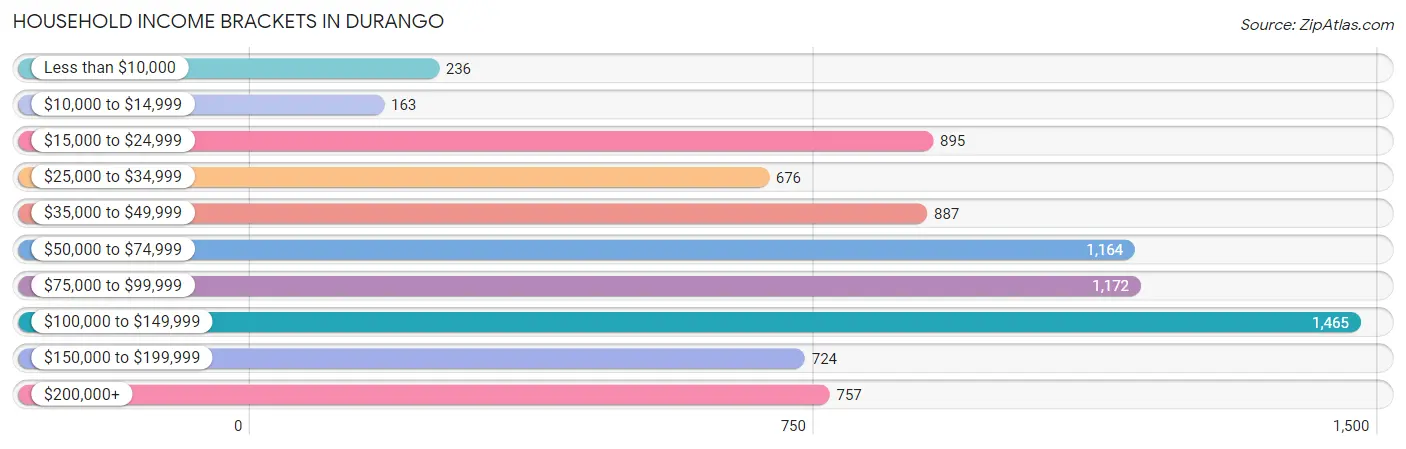
| Income Bracket | # Households | % Households |
| Less than $10,000 | 236 | 2.9% |
| $10,000 to $14,999 | 163 | 2.0% |
| $15,000 to $24,999 | 895 | 11.0% |
| $25,000 to $34,999 | 676 | 8.3% |
| $35,000 to $49,999 | 887 | 10.9% |
| $50,000 to $74,999 | 1,164 | 14.3% |
| $75,000 to $99,999 | 1,172 | 14.4% |
| $100,000 to $149,999 | 1,465 | 18.0% |
| $150,000 to $199,999 | 724 | 8.9% |
| $200,000+ | 757 | 9.3% |
Household Income by Householder Age in Durango
The median household income in Durango is $76,177, with the highest median household income of $92,105 found in the 45 to 64 years age bracket for the primary householder. A total of 2,619 households (32.2%) fall into this category. Meanwhile, the 15 to 24 years age bracket for the primary householder has the lowest median household income of $29,063, with 677 households (8.3%) in this group.
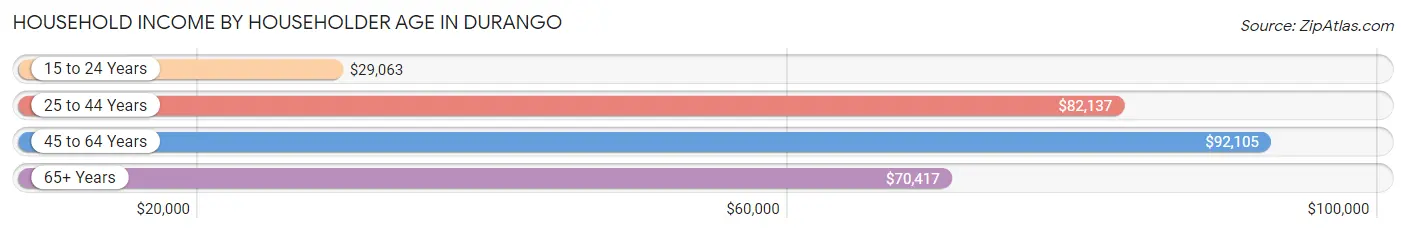
| Income Bracket | # Households | Median Income |
| 15 to 24 Years | 677 (8.3%) | $29,063 |
| 25 to 44 Years | 2,927 (36.0%) | $82,137 |
| 45 to 64 Years | 2,619 (32.2%) | $92,105 |
| 65+ Years | 1,916 (23.5%) | $70,417 |
| Total | 8,139 (100.0%) | $76,177 |
Poverty in Durango
Income Below Poverty by Sex and Age in Durango
With 12.9% poverty level for males and 15.7% for females among the residents of Durango, 18 to 24 year old males and 18 to 24 year old females are the most vulnerable to poverty, with 445 males (35.9%) and 398 females (43.6%) in their respective age groups living below the poverty level.
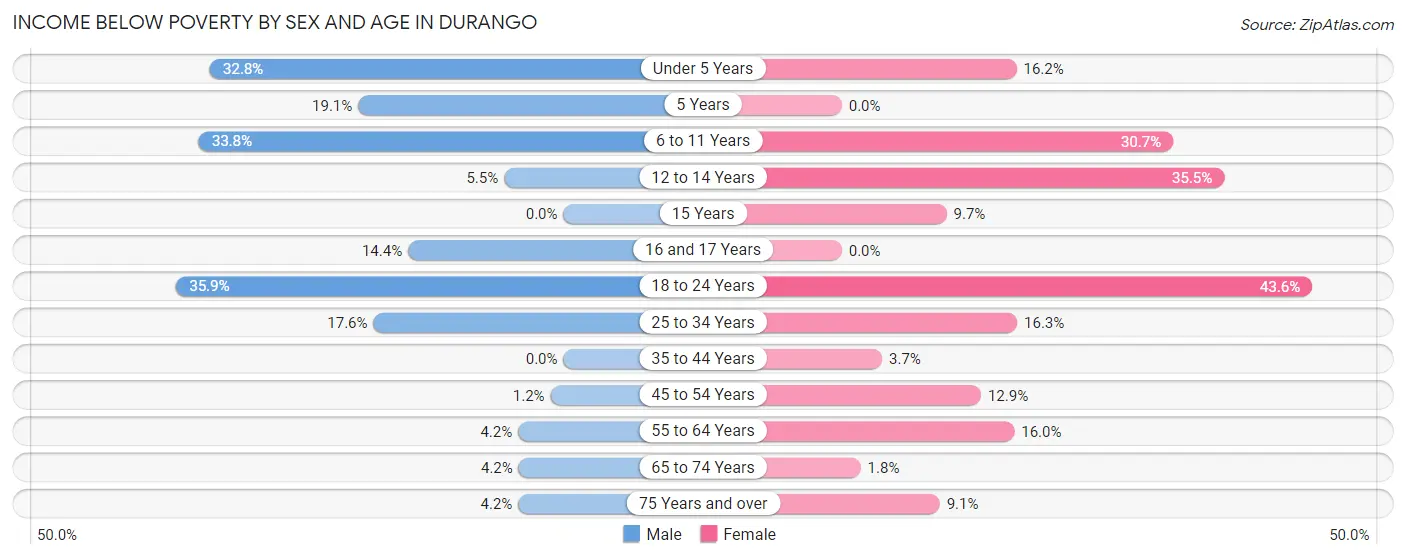
| Age Bracket | Male | Female |
| Under 5 Years | 164 (32.8%) | 54 (16.2%) |
| 5 Years | 28 (19.1%) | 0 (0.0%) |
| 6 to 11 Years | 158 (33.8%) | 142 (30.7%) |
| 12 to 14 Years | 12 (5.5%) | 33 (35.5%) |
| 15 Years | 0 (0.0%) | 11 (9.7%) |
| 16 and 17 Years | 15 (14.4%) | 0 (0.0%) |
| 18 to 24 Years | 445 (35.9%) | 398 (43.6%) |
| 25 to 34 Years | 216 (17.6%) | 258 (16.3%) |
| 35 to 44 Years | 0 (0.0%) | 40 (3.7%) |
| 45 to 54 Years | 14 (1.2%) | 142 (12.9%) |
| 55 to 64 Years | 42 (4.2%) | 199 (16.0%) |
| 65 to 74 Years | 42 (4.2%) | 15 (1.8%) |
| 75 Years and over | 17 (4.2%) | 44 (9.1%) |
| Total | 1,153 (12.9%) | 1,336 (15.7%) |
Income Above Poverty by Sex and Age in Durango
According to the poverty statistics in Durango, males aged 15 years and females aged 5 years are the age groups that are most secure financially, with 100.0% of males and 100.0% of females in these age groups living above the poverty line.
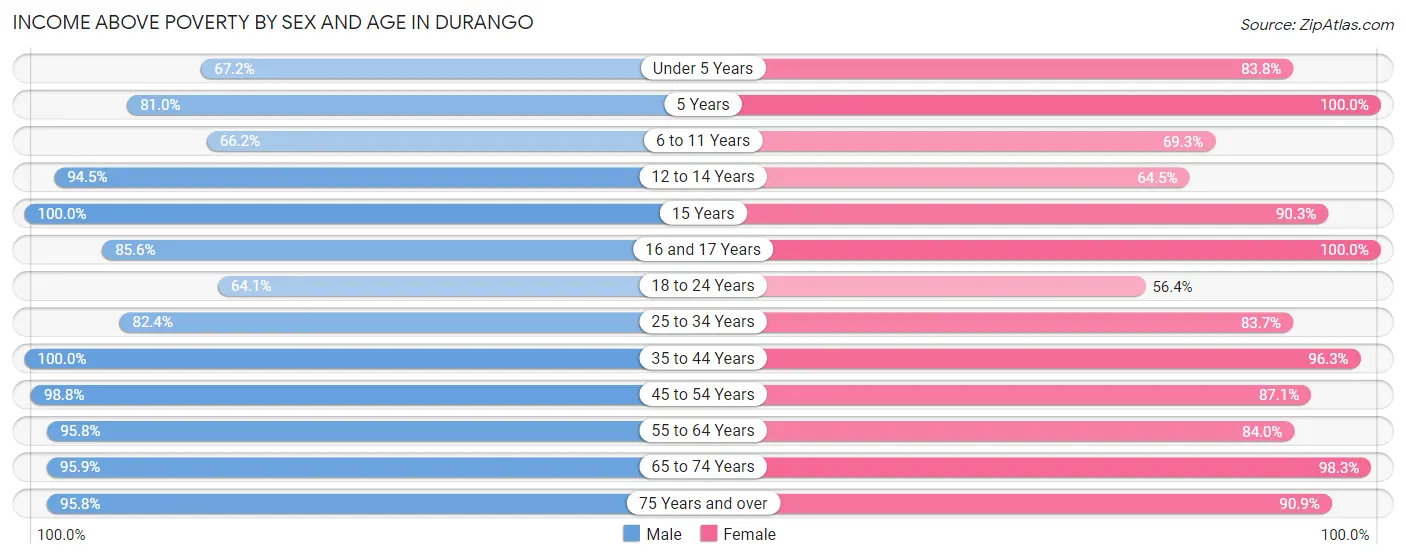
| Age Bracket | Male | Female |
| Under 5 Years | 336 (67.2%) | 279 (83.8%) |
| 5 Years | 119 (80.9%) | 94 (100.0%) |
| 6 to 11 Years | 309 (66.2%) | 320 (69.3%) |
| 12 to 14 Years | 206 (94.5%) | 60 (64.5%) |
| 15 Years | 23 (100.0%) | 102 (90.3%) |
| 16 and 17 Years | 89 (85.6%) | 180 (100.0%) |
| 18 to 24 Years | 794 (64.1%) | 514 (56.4%) |
| 25 to 34 Years | 1,009 (82.4%) | 1,328 (83.7%) |
| 35 to 44 Years | 1,455 (100.0%) | 1,030 (96.3%) |
| 45 to 54 Years | 1,153 (98.8%) | 957 (87.1%) |
| 55 to 64 Years | 958 (95.8%) | 1,044 (84.0%) |
| 65 to 74 Years | 971 (95.9%) | 844 (98.3%) |
| 75 Years and over | 389 (95.8%) | 440 (90.9%) |
| Total | 7,811 (87.1%) | 7,192 (84.3%) |
Income Below Poverty Among Married-Couple Families in Durango
The poverty statistics for married-couple families in Durango show that 3.2% or 102 of the total 3,201 families live below the poverty line. Families with no children have the highest poverty rate of 3.8%, comprising of 81 families. On the other hand, families with 3 or 4 children have the lowest poverty rate of 0.0%, which includes 0 families.
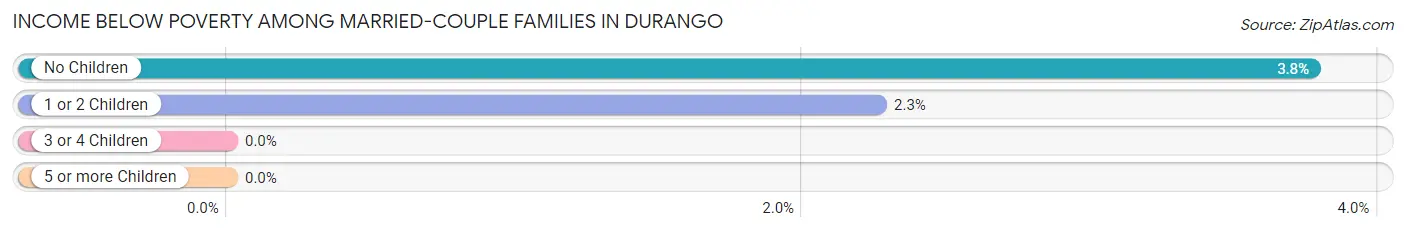
| Children | Above Poverty | Below Poverty |
| No Children | 2,069 (96.2%) | 81 (3.8%) |
| 1 or 2 Children | 910 (97.7%) | 21 (2.3%) |
| 3 or 4 Children | 76 (100.0%) | 0 (0.0%) |
| 5 or more Children | 44 (100.0%) | 0 (0.0%) |
| Total | 3,099 (96.8%) | 102 (3.2%) |
Income Below Poverty Among Single-Parent Households in Durango
According to the poverty data in Durango, 26.8% or 84 single-father households and 48.1% or 248 single-mother households are living below the poverty line. Among single-father households, those with 3 or 4 children have the highest poverty rate, with 84 households (100.0%) experiencing poverty. Likewise, among single-mother households, those with 3 or 4 children have the highest poverty rate, with 120 households (88.9%) falling below the poverty line.
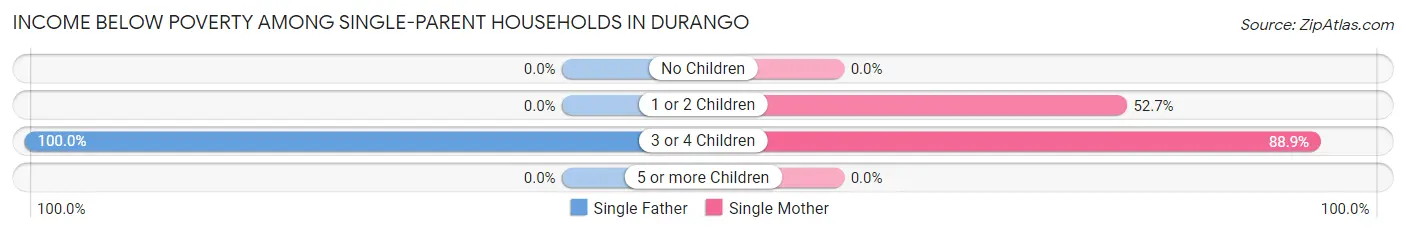
| Children | Single Father | Single Mother |
| No Children | 0 (0.0%) | 0 (0.0%) |
| 1 or 2 Children | 0 (0.0%) | 128 (52.7%) |
| 3 or 4 Children | 84 (100.0%) | 120 (88.9%) |
| 5 or more Children | 0 (0.0%) | 0 (0.0%) |
| Total | 84 (26.8%) | 248 (48.1%) |
Income Below Poverty Among Married-Couple vs Single-Parent Households in Durango
The poverty data for Durango shows that 102 of the married-couple family households (3.2%) and 332 of the single-parent households (40.1%) are living below the poverty level. Within the married-couple family households, those with no children have the highest poverty rate, with 81 households (3.8%) falling below the poverty line. Among the single-parent households, those with 3 or 4 children have the highest poverty rate, with 204 household (93.1%) living below poverty.
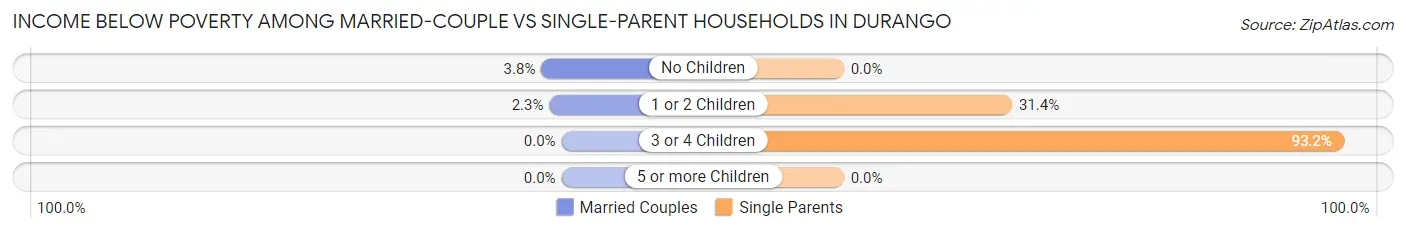
| Children | Married-Couple Families | Single-Parent Households |
| No Children | 81 (3.8%) | 0 (0.0%) |
| 1 or 2 Children | 21 (2.3%) | 128 (31.4%) |
| 3 or 4 Children | 0 (0.0%) | 204 (93.1%) |
| 5 or more Children | 0 (0.0%) | 0 (0.0%) |
| Total | 102 (3.2%) | 332 (40.1%) |
Race in Durango
The most populous races in Durango are White / Caucasian (15,850 | 82.8%), Hispanic or Latino (1,579 | 8.3%), and Native / Alaskan (1,399 | 7.3%).
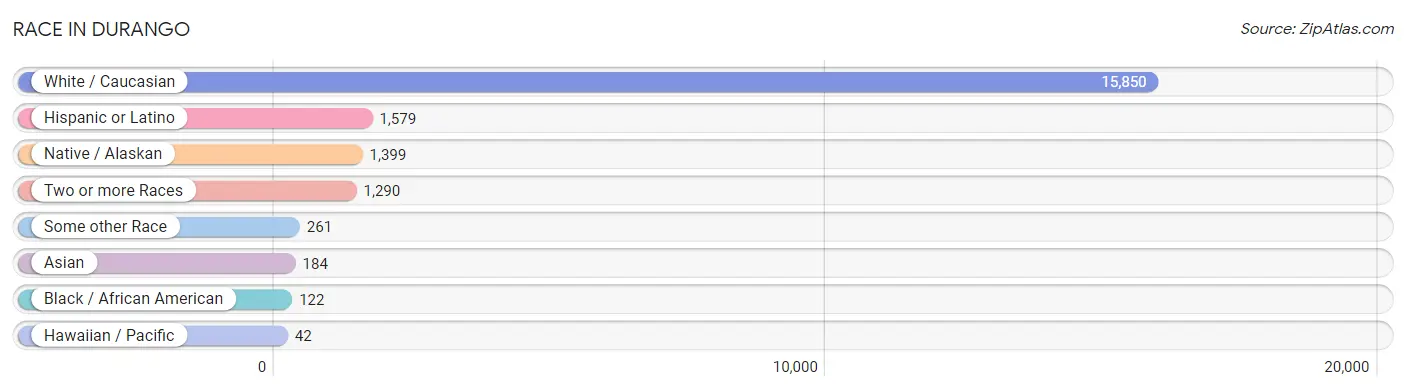
| Race | # Population | % Population |
| Asian | 184 | 1.0% |
| Black / African American | 122 | 0.6% |
| Hawaiian / Pacific | 42 | 0.2% |
| Hispanic or Latino | 1,579 | 8.3% |
| Native / Alaskan | 1,399 | 7.3% |
| White / Caucasian | 15,850 | 82.8% |
| Two or more Races | 1,290 | 6.7% |
| Some other Race | 261 | 1.4% |
| Total | 19,148 | 100.0% |
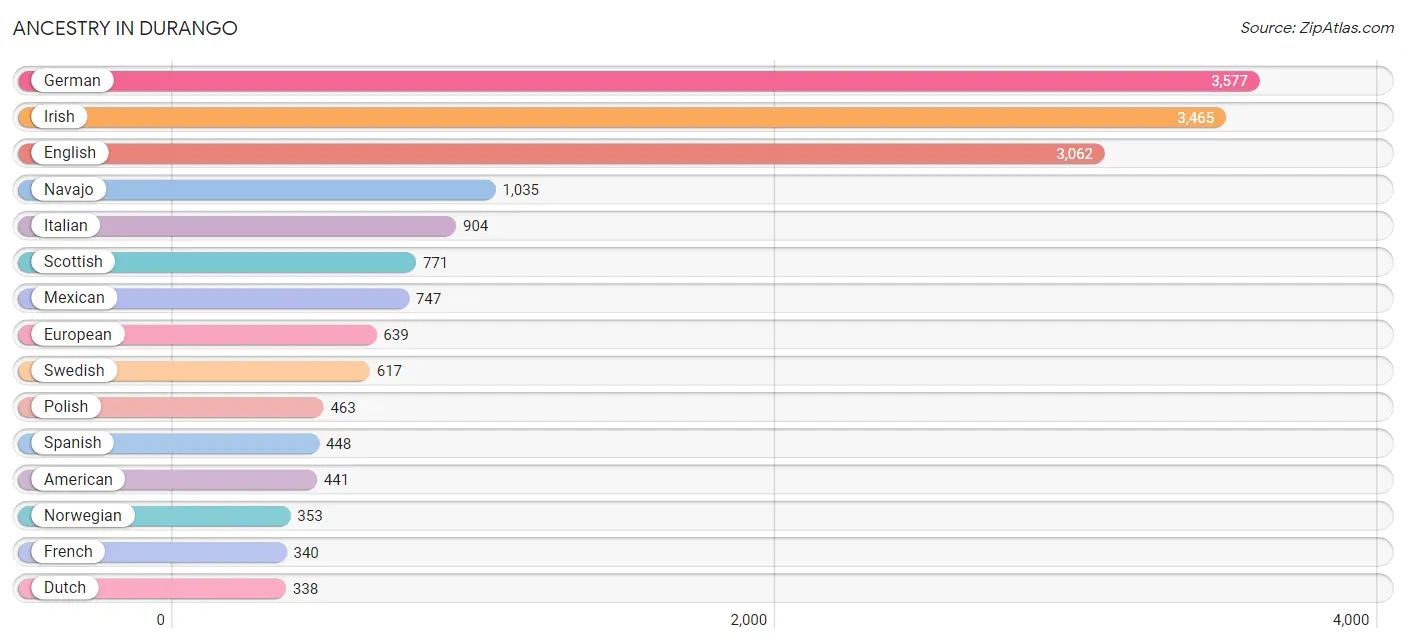
Ancestry in Durango
The most populous ancestries reported in Durango are German (3,577 | 18.7%), Irish (3,465 | 18.1%), English (3,062 | 16.0%), Navajo (1,035 | 5.4%), and Italian (904 | 4.7%), together accounting for 62.9% of all Durango residents.
| Ancestry | # Population | % Population |
| African | 5 | 0.0% |
| Alaskan Athabascan | 21 | 0.1% |
| Alsatian | 18 | 0.1% |
| American | 441 | 2.3% |
| Arab | 16 | 0.1% |
| Arapaho | 12 | 0.1% |
| Armenian | 20 | 0.1% |
| Australian | 25 | 0.1% |
| Austrian | 62 | 0.3% |
| Belgian | 39 | 0.2% |
| Bhutanese | 119 | 0.6% |
| Blackfeet | 45 | 0.2% |
| British | 127 | 0.7% |
| Bulgarian | 49 | 0.3% |
| Burmese | 34 | 0.2% |
| Canadian | 55 | 0.3% |
| Celtic | 39 | 0.2% |
| Central American | 26 | 0.1% |
| Cherokee | 238 | 1.2% |
| Cheyenne | 10 | 0.1% |
| Colombian | 42 | 0.2% |
| Croatian | 35 | 0.2% |
| Cuban | 45 | 0.2% |
| Czech | 124 | 0.6% |
| Czechoslovakian | 58 | 0.3% |
| Danish | 132 | 0.7% |
| Dutch | 338 | 1.8% |
| Eastern European | 24 | 0.1% |
| English | 3,062 | 16.0% |
| European | 639 | 3.3% |
| Finnish | 81 | 0.4% |
| French | 340 | 1.8% |
| French Canadian | 131 | 0.7% |
| German | 3,577 | 18.7% |
| Greek | 155 | 0.8% |
| Guatemalan | 26 | 0.1% |
| Hungarian | 51 | 0.3% |
| Indian (Asian) | 67 | 0.4% |
| Irish | 3,465 | 18.1% |
| Italian | 904 | 4.7% |
| Korean | 5 | 0.0% |
| Laotian | 5 | 0.0% |
| Lebanese | 16 | 0.1% |
| Lithuanian | 33 | 0.2% |
| Mexican | 747 | 3.9% |
| Native Hawaiian | 42 | 0.2% |
| Navajo | 1,035 | 5.4% |
| Nigerian | 23 | 0.1% |
| Northern European | 35 | 0.2% |
| Norwegian | 353 | 1.8% |
| Osage | 107 | 0.6% |
| Polish | 463 | 2.4% |
| Portuguese | 98 | 0.5% |
| Potawatomi | 36 | 0.2% |
| Pueblo | 54 | 0.3% |
| Puerto Rican | 17 | 0.1% |
| Romanian | 32 | 0.2% |
| Russian | 100 | 0.5% |
| Samoan | 10 | 0.1% |
| Scandinavian | 106 | 0.5% |
| Scotch-Irish | 264 | 1.4% |
| Scottish | 771 | 4.0% |
| Seminole | 8 | 0.0% |
| Sioux | 35 | 0.2% |
| Slovene | 12 | 0.1% |
| South American | 42 | 0.2% |
| Spaniard | 51 | 0.3% |
| Spanish | 448 | 2.3% |
| Spanish American | 12 | 0.1% |
| Sri Lankan | 26 | 0.1% |
| Subsaharan African | 28 | 0.2% |
| Swedish | 617 | 3.2% |
| Swiss | 201 | 1.1% |
| Thai | 39 | 0.2% |
| Tlingit-Haida | 91 | 0.5% |
| Ukrainian | 26 | 0.1% |
| Ute | 141 | 0.7% |
| Welsh | 183 | 1.0% |
| Yaqui | 35 | 0.2% | View All 79 Rows |
Immigrants in Durango
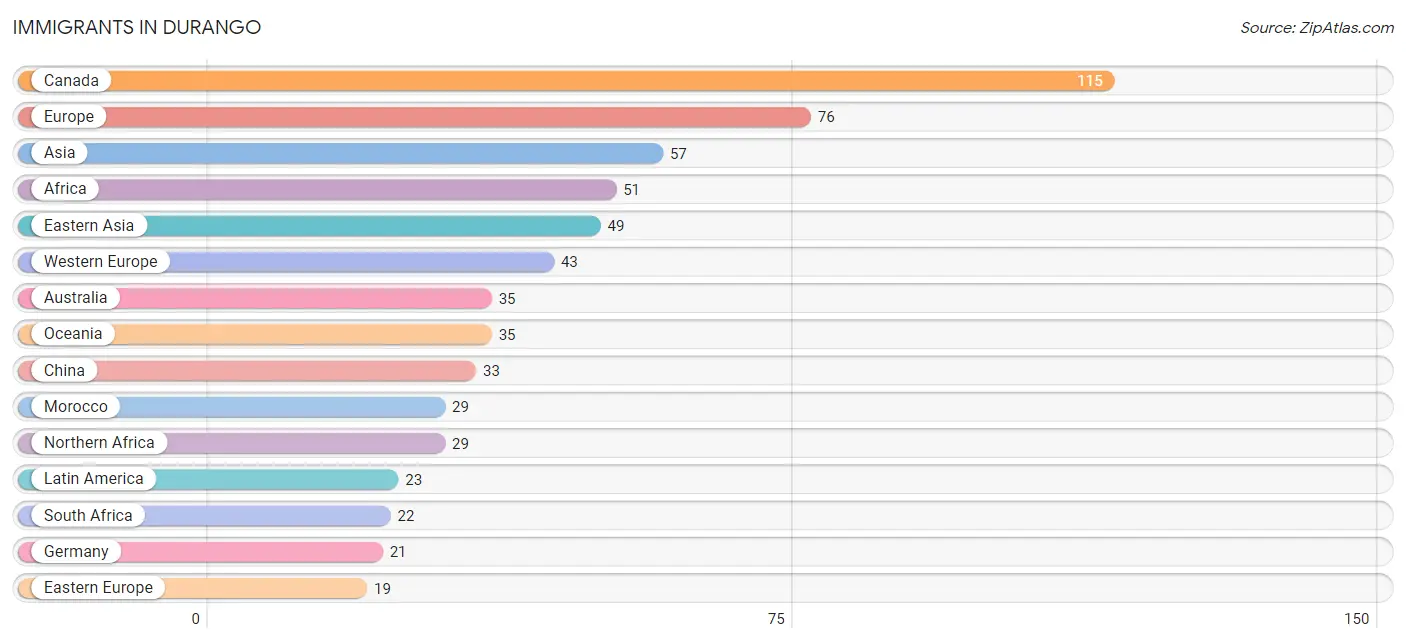
The most numerous immigrant groups reported in Durango came from Canada (115 | 0.6%), Europe (76 | 0.4%), Asia (57 | 0.3%), Africa (51 | 0.3%), and Eastern Asia (49 | 0.3%), together accounting for 1.8% of all Durango residents.
| Immigration Origin | # Population | % Population |
| Africa | 51 | 0.3% |
| Asia | 57 | 0.3% |
| Australia | 35 | 0.2% |
| Canada | 115 | 0.6% |
| Caribbean | 13 | 0.1% |
| Central America | 10 | 0.1% |
| China | 33 | 0.2% |
| Cuba | 13 | 0.1% |
| Eastern Asia | 49 | 0.3% |
| Eastern Europe | 19 | 0.1% |
| England | 14 | 0.1% |
| Europe | 76 | 0.4% |
| France | 12 | 0.1% |
| Germany | 21 | 0.1% |
| Hungary | 8 | 0.0% |
| India | 8 | 0.0% |
| Japan | 16 | 0.1% |
| Latin America | 23 | 0.1% |
| Mexico | 10 | 0.1% |
| Morocco | 29 | 0.2% |
| Northern Africa | 29 | 0.2% |
| Northern Europe | 14 | 0.1% |
| Oceania | 35 | 0.2% |
| Russia | 11 | 0.1% |
| South Africa | 22 | 0.1% |
| South Central Asia | 8 | 0.0% |
| Switzerland | 10 | 0.1% |
| Western Europe | 43 | 0.2% | View All 28 Rows |
Sex and Age in Durango
Sex and Age in Durango
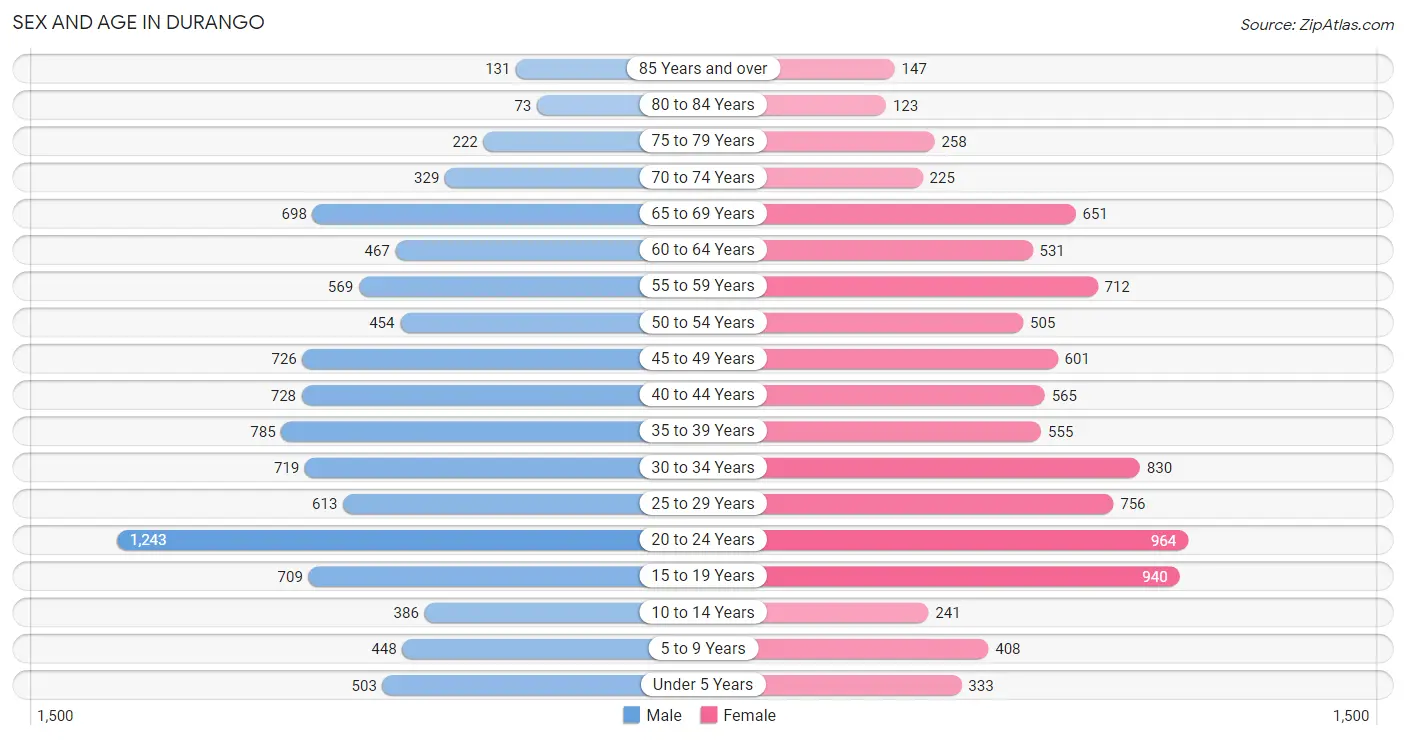
The most populous age groups in Durango are 20 to 24 Years (1,243 | 12.7%) for men and 20 to 24 Years (964 | 10.3%) for women.
| Age Bracket | Male | Female |
| Under 5 Years | 503 (5.1%) | 333 (3.6%) |
| 5 to 9 Years | 448 (4.6%) | 408 (4.4%) |
| 10 to 14 Years | 386 (3.9%) | 241 (2.6%) |
| 15 to 19 Years | 709 (7.2%) | 940 (10.1%) |
| 20 to 24 Years | 1,243 (12.7%) | 964 (10.3%) |
| 25 to 29 Years | 613 (6.2%) | 756 (8.1%) |
| 30 to 34 Years | 719 (7.3%) | 830 (8.9%) |
| 35 to 39 Years | 785 (8.0%) | 555 (5.9%) |
| 40 to 44 Years | 728 (7.4%) | 565 (6.0%) |
| 45 to 49 Years | 726 (7.4%) | 601 (6.4%) |
| 50 to 54 Years | 454 (4.6%) | 505 (5.4%) |
| 55 to 59 Years | 569 (5.8%) | 712 (7.6%) |
| 60 to 64 Years | 467 (4.8%) | 531 (5.7%) |
| 65 to 69 Years | 698 (7.1%) | 651 (7.0%) |
| 70 to 74 Years | 329 (3.4%) | 225 (2.4%) |
| 75 to 79 Years | 222 (2.3%) | 258 (2.8%) |
| 80 to 84 Years | 73 (0.7%) | 123 (1.3%) |
| 85 Years and over | 131 (1.3%) | 147 (1.6%) |
| Total | 9,803 (100.0%) | 9,345 (100.0%) |
Families and Households in Durango
Median Family Size in Durango
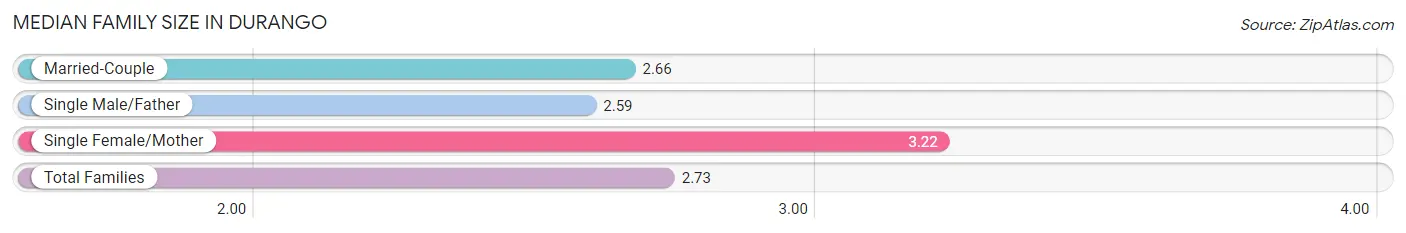
The median family size in Durango is 2.73 persons per family, with single female/mother families (516 | 12.8%) accounting for the largest median family size of 3.22 persons per family. On the other hand, single male/father families (313 | 7.8%) represent the smallest median family size with 2.59 persons per family.
| Family Type | # Families | Family Size |
| Married-Couple | 3,201 (79.4%) | 2.66 |
| Single Male/Father | 313 (7.8%) | 2.59 |
| Single Female/Mother | 516 (12.8%) | 3.22 |
| Total Families | 4,030 (100.0%) | 2.73 |
Median Household Size in Durango
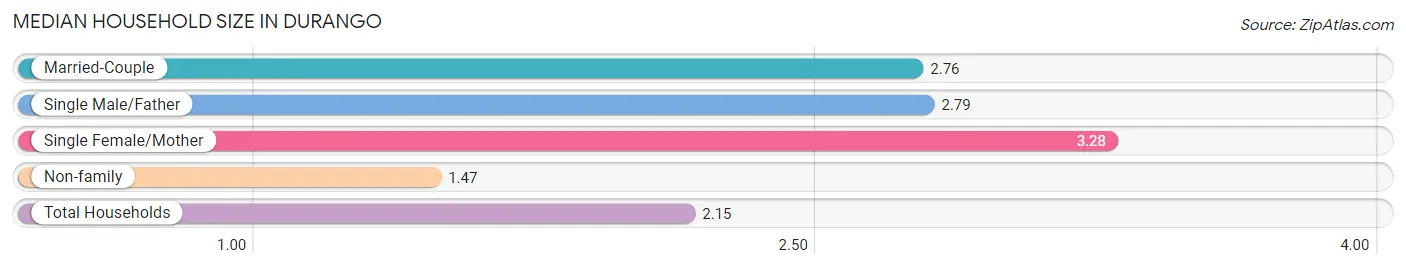
The median household size in Durango is 2.15 persons per household, with single female/mother households (516 | 6.3%) accounting for the largest median household size of 3.28 persons per household. non-family households (4,109 | 50.5%) represent the smallest median household size with 1.47 persons per household.
| Household Type | # Households | Household Size |
| Married-Couple | 3,201 (39.3%) | 2.76 |
| Single Male/Father | 313 (3.8%) | 2.79 |
| Single Female/Mother | 516 (6.3%) | 3.28 |
| Non-family | 4,109 (50.5%) | 1.47 |
| Total Households | 8,139 (100.0%) | 2.15 |
Household Size by Marriage Status in Durango
Out of a total of 8,139 households in Durango, 4,030 (49.5%) are family households, while 4,109 (50.5%) are nonfamily households. The most numerous type of family households are 2-person households, comprising 2,246, and the most common type of nonfamily households are 1-person households, comprising 3,074.
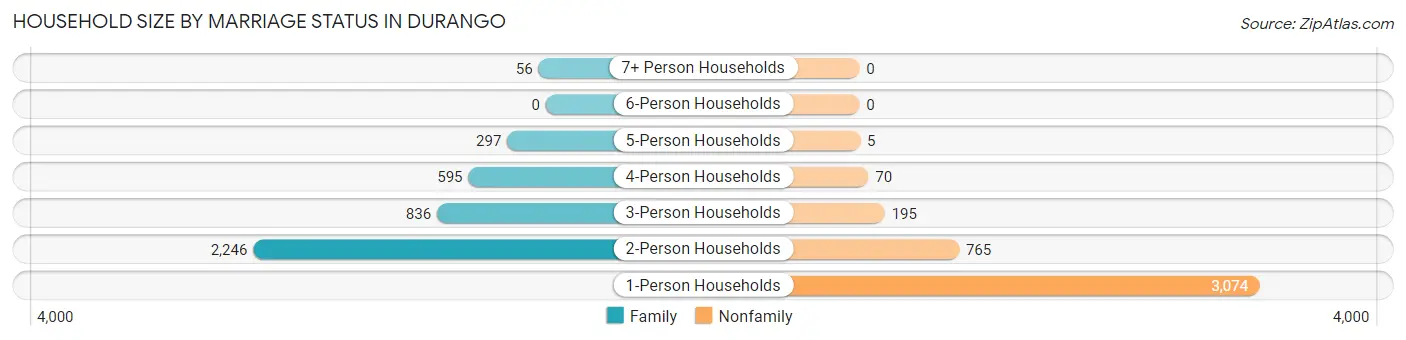
| Household Size | Family Households | Nonfamily Households |
| 1-Person Households | - | 3,074 (37.8%) |
| 2-Person Households | 2,246 (27.6%) | 765 (9.4%) |
| 3-Person Households | 836 (10.3%) | 195 (2.4%) |
| 4-Person Households | 595 (7.3%) | 70 (0.9%) |
| 5-Person Households | 297 (3.6%) | 5 (0.1%) |
| 6-Person Households | 0 (0.0%) | 0 (0.0%) |
| 7+ Person Households | 56 (0.7%) | 0 (0.0%) |
| Total | 4,030 (49.5%) | 4,109 (50.5%) |
Female Fertility in Durango
Fertility by Age in Durango
Average fertility rate in Durango is 21.0 births per 1,000 women. Women in the age bracket of 35 to 50 years have the highest fertility rate with 43.0 births per 1,000 women. Women in the age bracket of 35 to 50 years acount for 71.6% of all women with births.
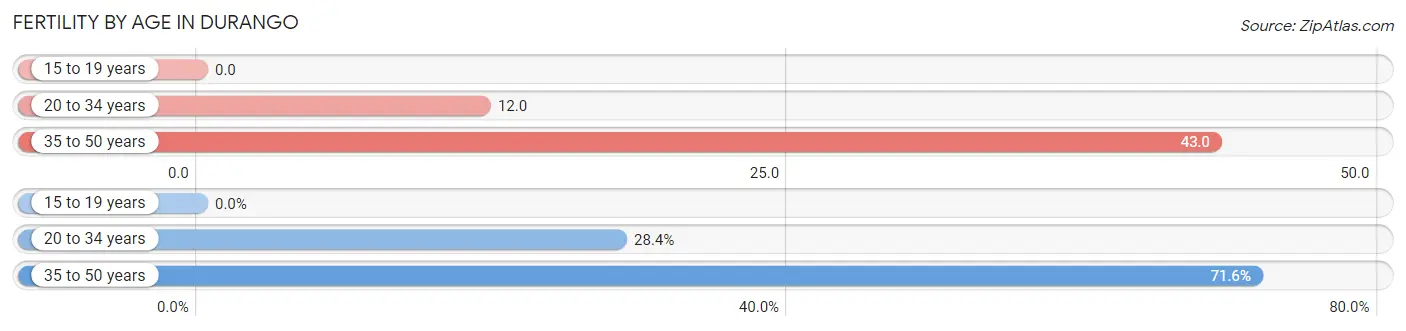
| Age Bracket | Women with Births | Births / 1,000 Women |
| 15 to 19 years | 0 (0.0%) | 0.0 |
| 20 to 34 years | 31 (28.4%) | 12.0 |
| 35 to 50 years | 78 (71.6%) | 43.0 |
| Total | 109 (100.0%) | 21.0 |
Fertility by Age by Marriage Status in Durango
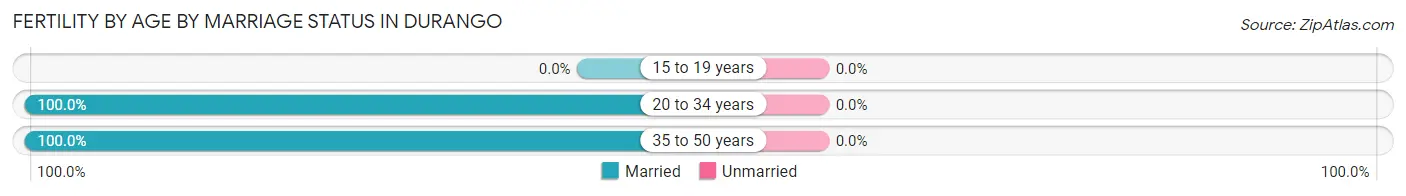
| Age Bracket | Married | Unmarried |
| 15 to 19 years | 0 (0.0%) | 0 (0.0%) |
| 20 to 34 years | 31 (100.0%) | 0 (0.0%) |
| 35 to 50 years | 78 (100.0%) | 0 (0.0%) |
| Total | 109 (100.0%) | 0 (0.0%) |
Fertility by Education in Durango
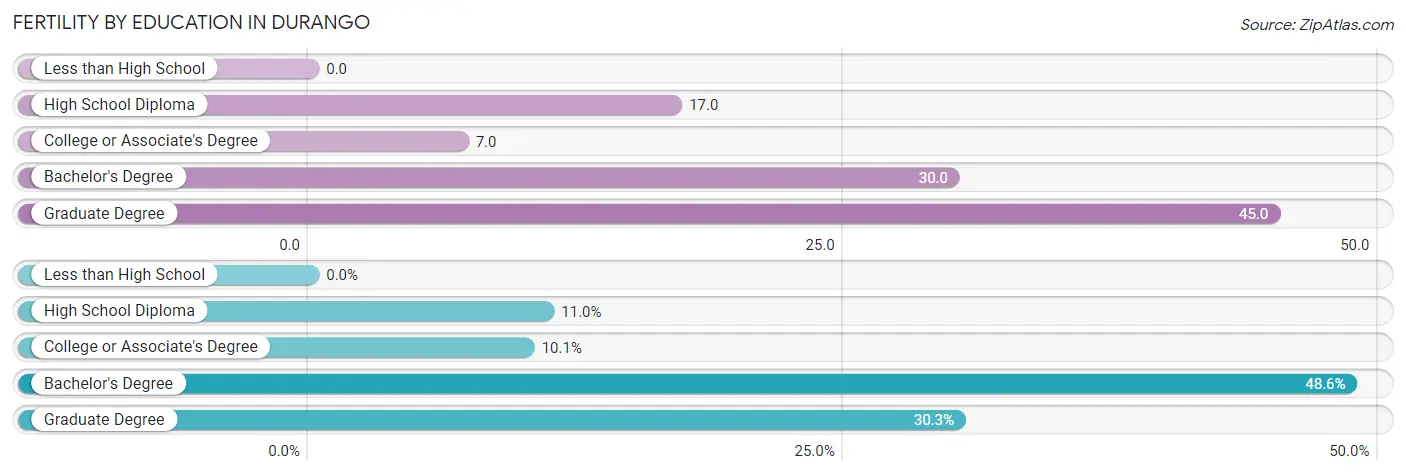
| Educational Attainment | Women with Births | Births / 1,000 Women |
| Less than High School | 0 (0.0%) | 0.0 |
| High School Diploma | 12 (11.0%) | 17.0 |
| College or Associate's Degree | 11 (10.1%) | 7.0 |
| Bachelor's Degree | 53 (48.6%) | 30.0 |
| Graduate Degree | 33 (30.3%) | 45.0 |
| Total | 109 (100.0%) | 21.0 |
Fertility by Education by Marriage Status in Durango
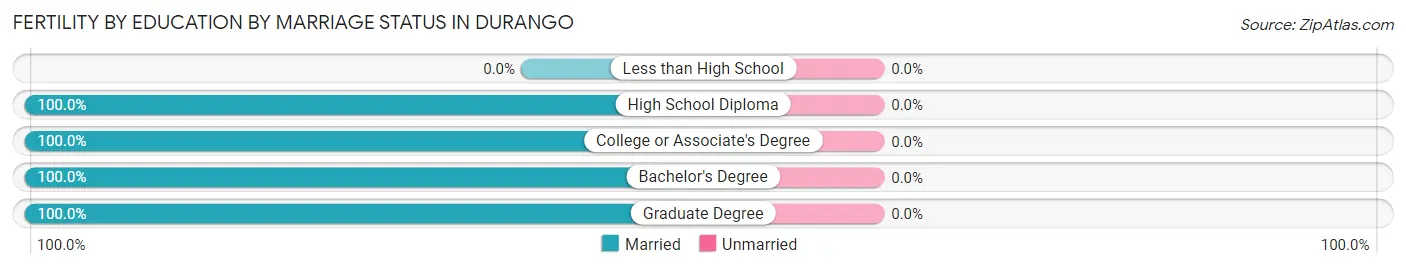
| Educational Attainment | Married | Unmarried |
| Less than High School | 0 (0.0%) | 0 (0.0%) |
| High School Diploma | 12 (100.0%) | 0 (0.0%) |
| College or Associate's Degree | 11 (100.0%) | 0 (0.0%) |
| Bachelor's Degree | 53 (100.0%) | 0 (0.0%) |
| Graduate Degree | 33 (100.0%) | 0 (0.0%) |
| Total | 109 (100.0%) | 0 (0.0%) |
Employment Characteristics in Durango
Employment by Class of Employer in Durango
Among the 10,842 employed individuals in Durango, private company employees (6,591 | 60.8%), self-employed (not incorporated) (1,050 | 9.7%), and local government employees (922 | 8.5%) make up the most common classes of employment.
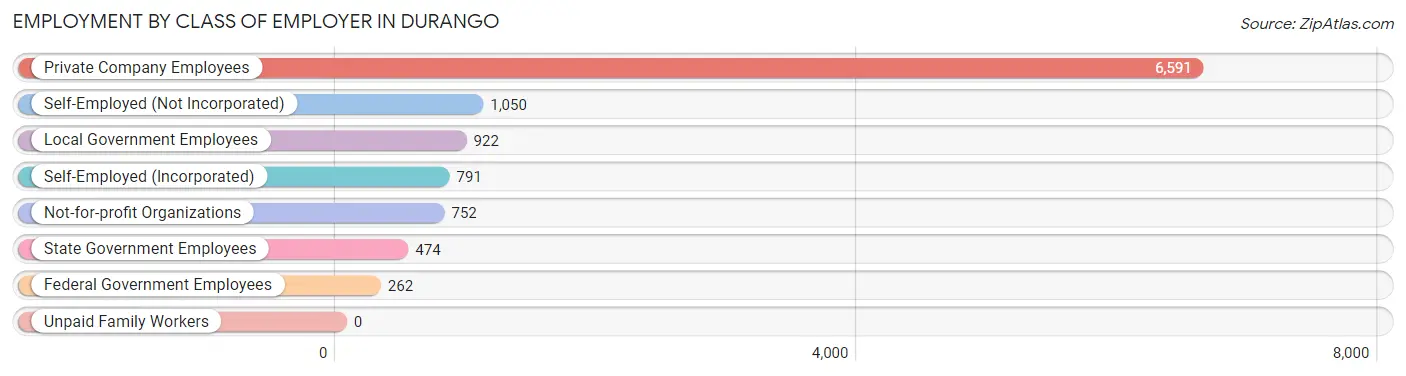
| Employer Class | # Employees | % Employees |
| Private Company Employees | 6,591 | 60.8% |
| Self-Employed (Incorporated) | 791 | 7.3% |
| Self-Employed (Not Incorporated) | 1,050 | 9.7% |
| Not-for-profit Organizations | 752 | 6.9% |
| Local Government Employees | 922 | 8.5% |
| State Government Employees | 474 | 4.4% |
| Federal Government Employees | 262 | 2.4% |
| Unpaid Family Workers | 0 | 0.0% |
| Total | 10,842 | 100.0% |
Employment Status by Age in Durango
According to the labor force statistics for Durango, out of the total population over 16 years of age (16,693), 67.5% or 11,268 individuals are in the labor force, with 2.3% or 259 of them unemployed. The age group with the highest labor force participation rate is 30 to 34 years, with 91.0% or 1,410 individuals in the labor force. Within the labor force, the 16 to 19 years age range has the highest percentage of unemployed individuals, with 14.5% or 117 of them being unemployed.
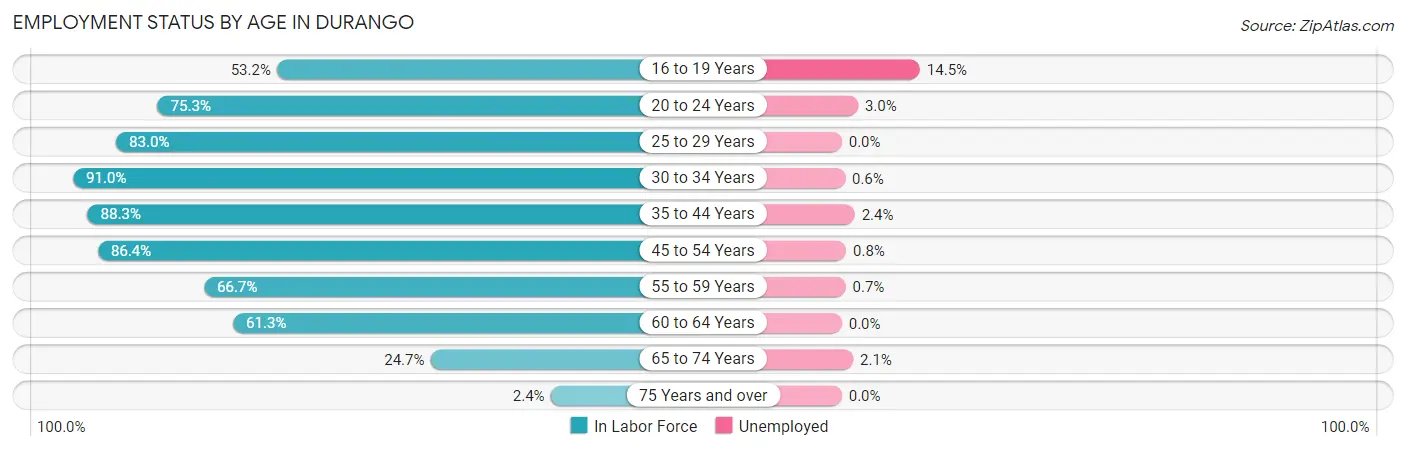
| Age Bracket | In Labor Force | Unemployed |
| 16 to 19 Years | 805 (53.2%) | 117 (14.5%) |
| 20 to 24 Years | 1,662 (75.3%) | 50 (3.0%) |
| 25 to 29 Years | 1,136 (83.0%) | 0 (0.0%) |
| 30 to 34 Years | 1,410 (91.0%) | 8 (0.6%) |
| 35 to 44 Years | 2,325 (88.3%) | 56 (2.4%) |
| 45 to 54 Years | 1,975 (86.4%) | 16 (0.8%) |
| 55 to 59 Years | 854 (66.7%) | 6 (0.7%) |
| 60 to 64 Years | 612 (61.3%) | 0 (0.0%) |
| 65 to 74 Years | 470 (24.7%) | 10 (2.1%) |
| 75 Years and over | 23 (2.4%) | 0 (0.0%) |
| Total | 11,268 (67.5%) | 259 (2.3%) |
Employment Status by Educational Attainment in Durango
According to labor force statistics for Durango, 82.2% of individuals (8,315) out of the total population between 25 and 64 years of age (10,116) are in the labor force, with 1.0% or 83 of them being unemployed. The group with the highest labor force participation rate are those with the educational attainment of college / associate degree, with 84.7% or 2,141 individuals in the labor force. Within the labor force, individuals with high school diploma education have the highest percentage of unemployment, with 3.4% or 31 of them being unemployed.

| Educational Attainment | In Labor Force | Unemployed |
| Less than High School | 103 (41.4%) | 0 (0.0%) |
| High School Diploma | 920 (76.0%) | 41 (3.4%) |
| College / Associate Degree | 2,141 (84.7%) | 48 (1.9%) |
| Bachelor's Degree or higher | 5,148 (84.0%) | 18 (0.3%) |
| Total | 8,315 (82.2%) | 101 (1.0%) |
Employment Occupations by Sex in Durango
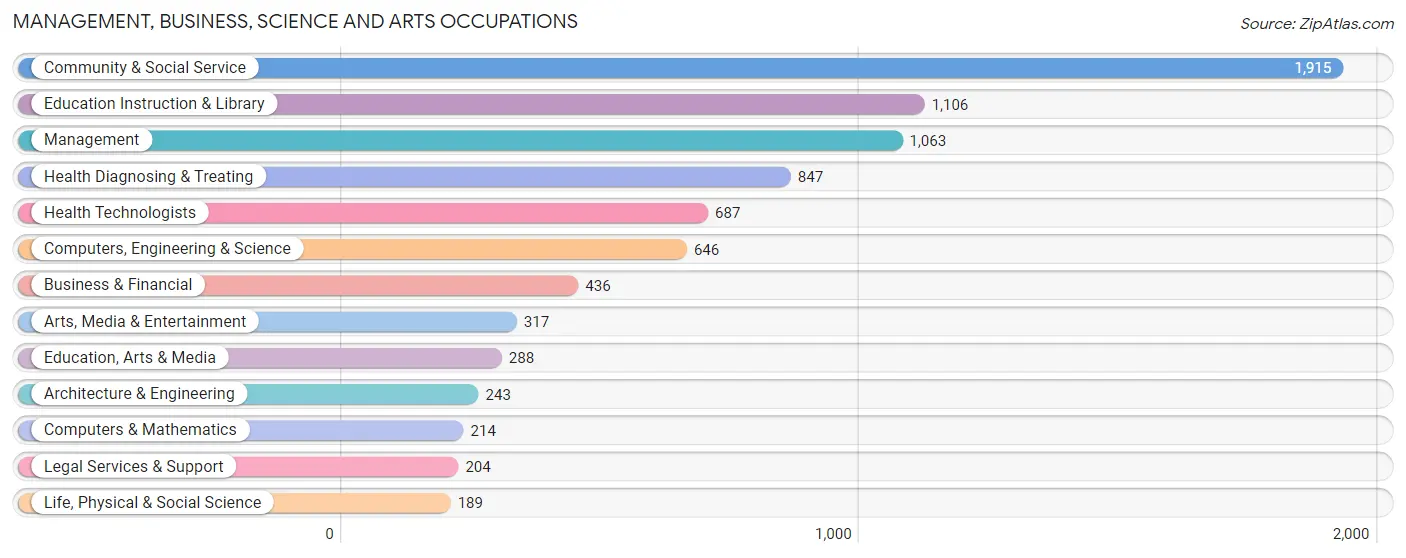
Management, Business, Science and Arts Occupations
The most common Management, Business, Science and Arts occupations in Durango are Community & Social Service (1,915 | 17.4%), Education Instruction & Library (1,106 | 10.1%), Management (1,063 | 9.7%), Health Diagnosing & Treating (847 | 7.7%), and Health Technologists (687 | 6.2%).
Management, Business, Science and Arts Occupations by Sex
Within the Management, Business, Science and Arts occupations in Durango, the most male-oriented occupations are Architecture & Engineering (86.4%), Computers & Mathematics (81.8%), and Computers, Engineering & Science (76.0%), while the most female-oriented occupations are Legal Services & Support (80.4%), Health Diagnosing & Treating (72.6%), and Health Technologists (70.3%).
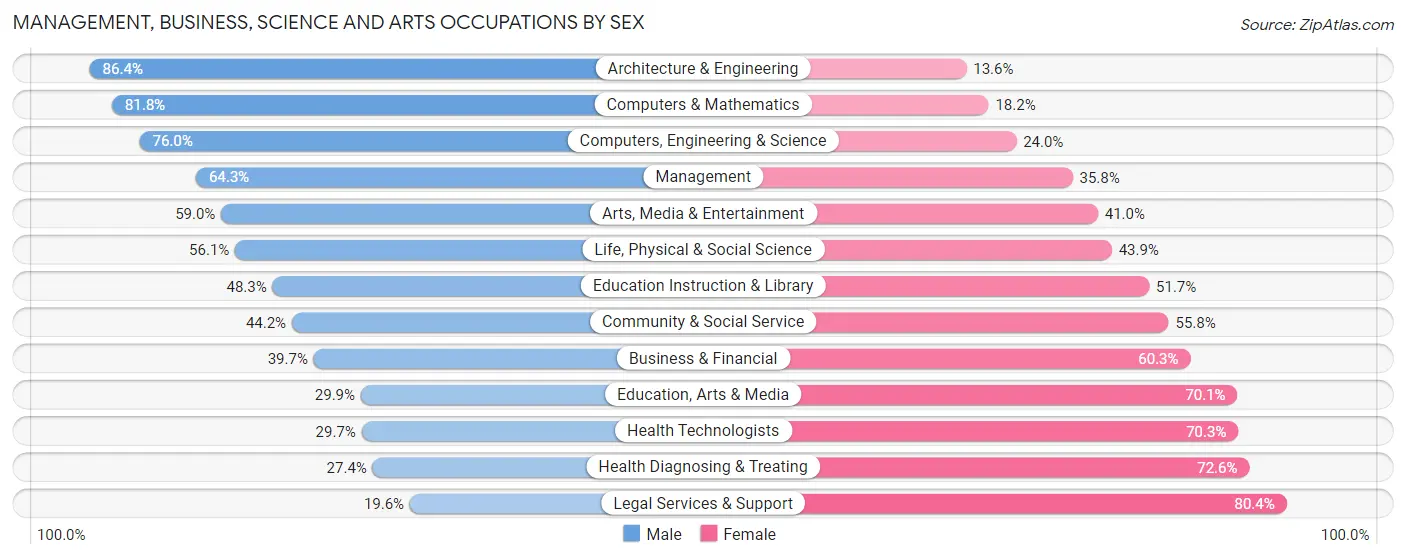
| Occupation | Male | Female |
| Management | 683 (64.2%) | 380 (35.7%) |
| Business & Financial | 173 (39.7%) | 263 (60.3%) |
| Computers, Engineering & Science | 491 (76.0%) | 155 (24.0%) |
| Computers & Mathematics | 175 (81.8%) | 39 (18.2%) |
| Architecture & Engineering | 210 (86.4%) | 33 (13.6%) |
| Life, Physical & Social Science | 106 (56.1%) | 83 (43.9%) |
| Community & Social Service | 847 (44.2%) | 1,068 (55.8%) |
| Education, Arts & Media | 86 (29.9%) | 202 (70.1%) |
| Legal Services & Support | 40 (19.6%) | 164 (80.4%) |
| Education Instruction & Library | 534 (48.3%) | 572 (51.7%) |
| Arts, Media & Entertainment | 187 (59.0%) | 130 (41.0%) |
| Health Diagnosing & Treating | 232 (27.4%) | 615 (72.6%) |
| Health Technologists | 204 (29.7%) | 483 (70.3%) |
| Total (Category) | 2,426 (49.4%) | 2,481 (50.6%) |
| Total (Overall) | 5,817 (52.8%) | 5,190 (47.1%) |
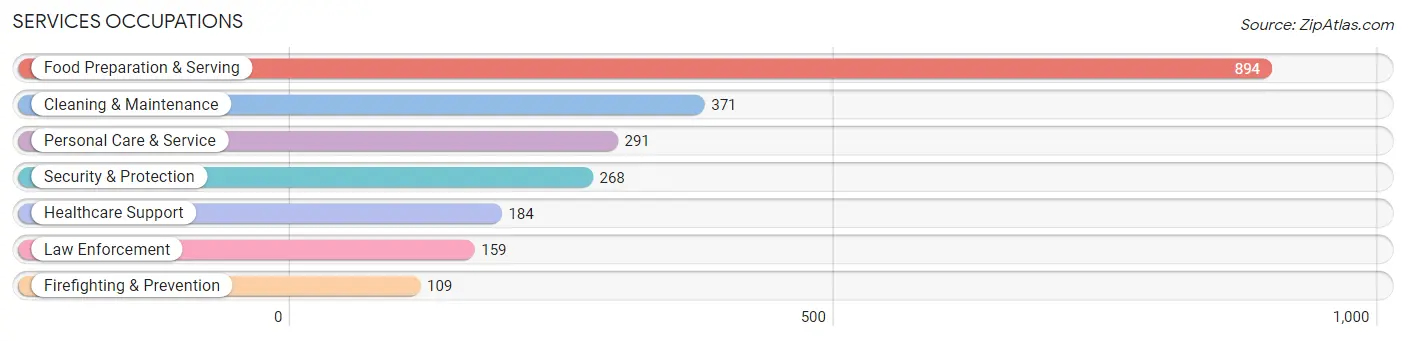
Services Occupations
The most common Services occupations in Durango are Food Preparation & Serving (894 | 8.1%), Cleaning & Maintenance (371 | 3.4%), Personal Care & Service (291 | 2.6%), Security & Protection (268 | 2.4%), and Healthcare Support (184 | 1.7%).
Services Occupations by Sex
Within the Services occupations in Durango, the most male-oriented occupations are Law Enforcement (95.0%), Security & Protection (80.2%), and Cleaning & Maintenance (76.8%), while the most female-oriented occupations are Healthcare Support (84.8%), Personal Care & Service (69.4%), and Firefighting & Prevention (41.3%).
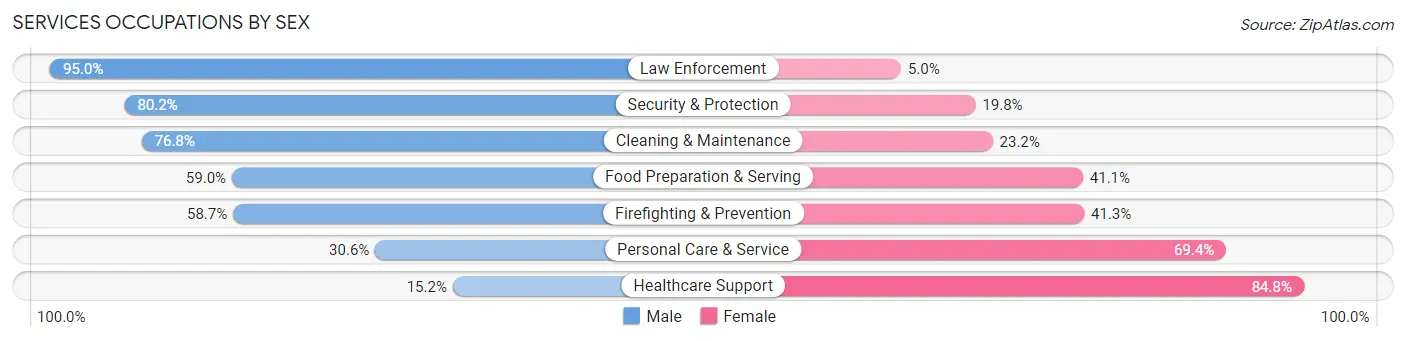
| Occupation | Male | Female |
| Healthcare Support | 28 (15.2%) | 156 (84.8%) |
| Security & Protection | 215 (80.2%) | 53 (19.8%) |
| Firefighting & Prevention | 64 (58.7%) | 45 (41.3%) |
| Law Enforcement | 151 (95.0%) | 8 (5.0%) |
| Food Preparation & Serving | 527 (59.0%) | 367 (41.0%) |
| Cleaning & Maintenance | 285 (76.8%) | 86 (23.2%) |
| Personal Care & Service | 89 (30.6%) | 202 (69.4%) |
| Total (Category) | 1,144 (57.0%) | 864 (43.0%) |
| Total (Overall) | 5,817 (52.8%) | 5,190 (47.1%) |
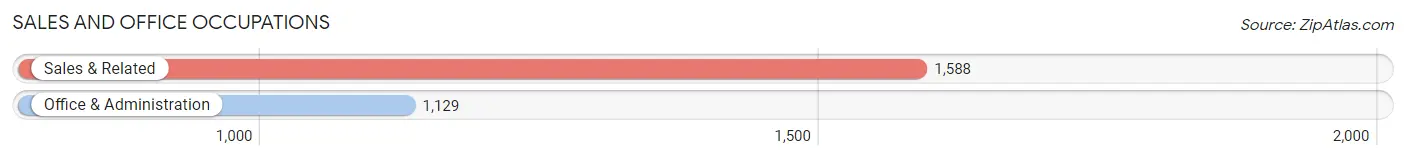
Sales and Office Occupations
The most common Sales and Office occupations in Durango are Sales & Related (1,588 | 14.4%), and Office & Administration (1,129 | 10.3%).
Sales and Office Occupations by Sex
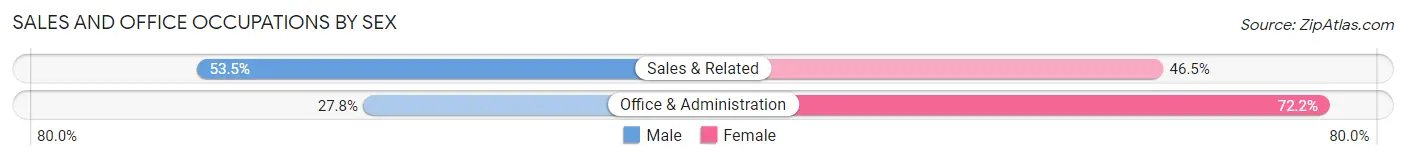
| Occupation | Male | Female |
| Sales & Related | 850 (53.5%) | 738 (46.5%) |
| Office & Administration | 314 (27.8%) | 815 (72.2%) |
| Total (Category) | 1,164 (42.8%) | 1,553 (57.2%) |
| Total (Overall) | 5,817 (52.8%) | 5,190 (47.1%) |
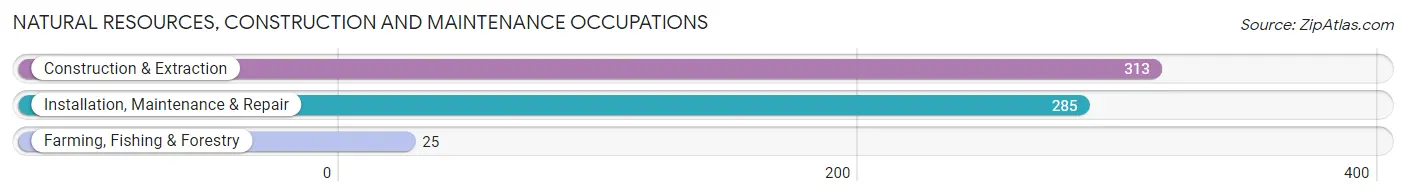
Natural Resources, Construction and Maintenance Occupations
The most common Natural Resources, Construction and Maintenance occupations in Durango are Construction & Extraction (313 | 2.8%), Installation, Maintenance & Repair (285 | 2.6%), and Farming, Fishing & Forestry (25 | 0.2%).
Natural Resources, Construction and Maintenance Occupations by Sex
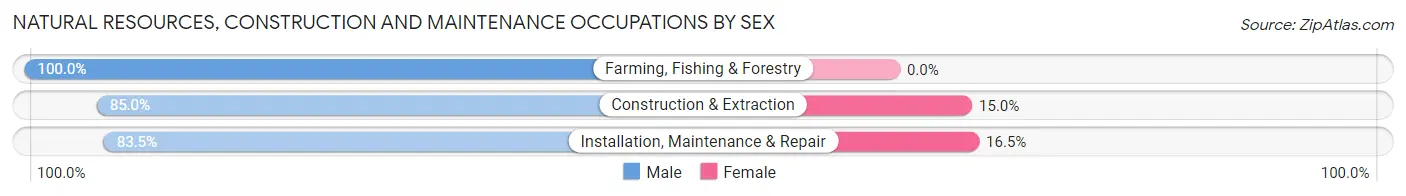
| Occupation | Male | Female |
| Farming, Fishing & Forestry | 25 (100.0%) | 0 (0.0%) |
| Construction & Extraction | 266 (85.0%) | 47 (15.0%) |
| Installation, Maintenance & Repair | 238 (83.5%) | 47 (16.5%) |
| Total (Category) | 529 (84.9%) | 94 (15.1%) |
| Total (Overall) | 5,817 (52.8%) | 5,190 (47.1%) |
Production, Transportation and Moving Occupations
The most common Production, Transportation and Moving occupations in Durango are Transportation (269 | 2.4%), Production (245 | 2.2%), and Material Moving (238 | 2.2%).
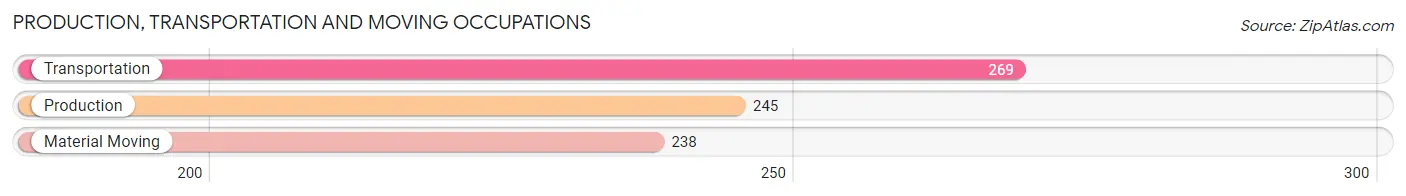
Production, Transportation and Moving Occupations by Sex
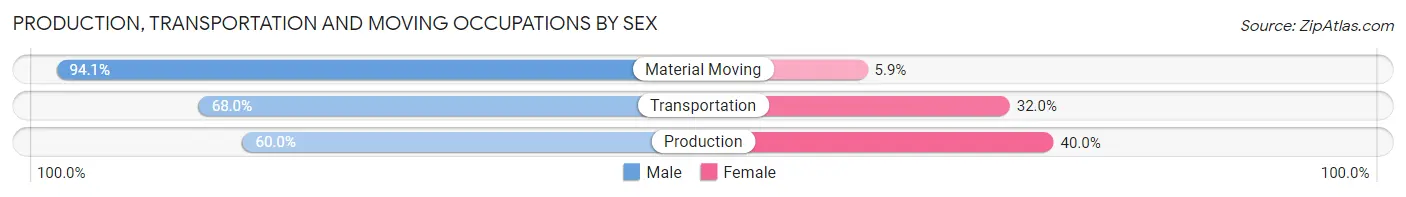
| Occupation | Male | Female |
| Production | 147 (60.0%) | 98 (40.0%) |
| Transportation | 183 (68.0%) | 86 (32.0%) |
| Material Moving | 224 (94.1%) | 14 (5.9%) |
| Total (Category) | 554 (73.7%) | 198 (26.3%) |
| Total (Overall) | 5,817 (52.8%) | 5,190 (47.1%) |
Employment Industries by Sex in Durango
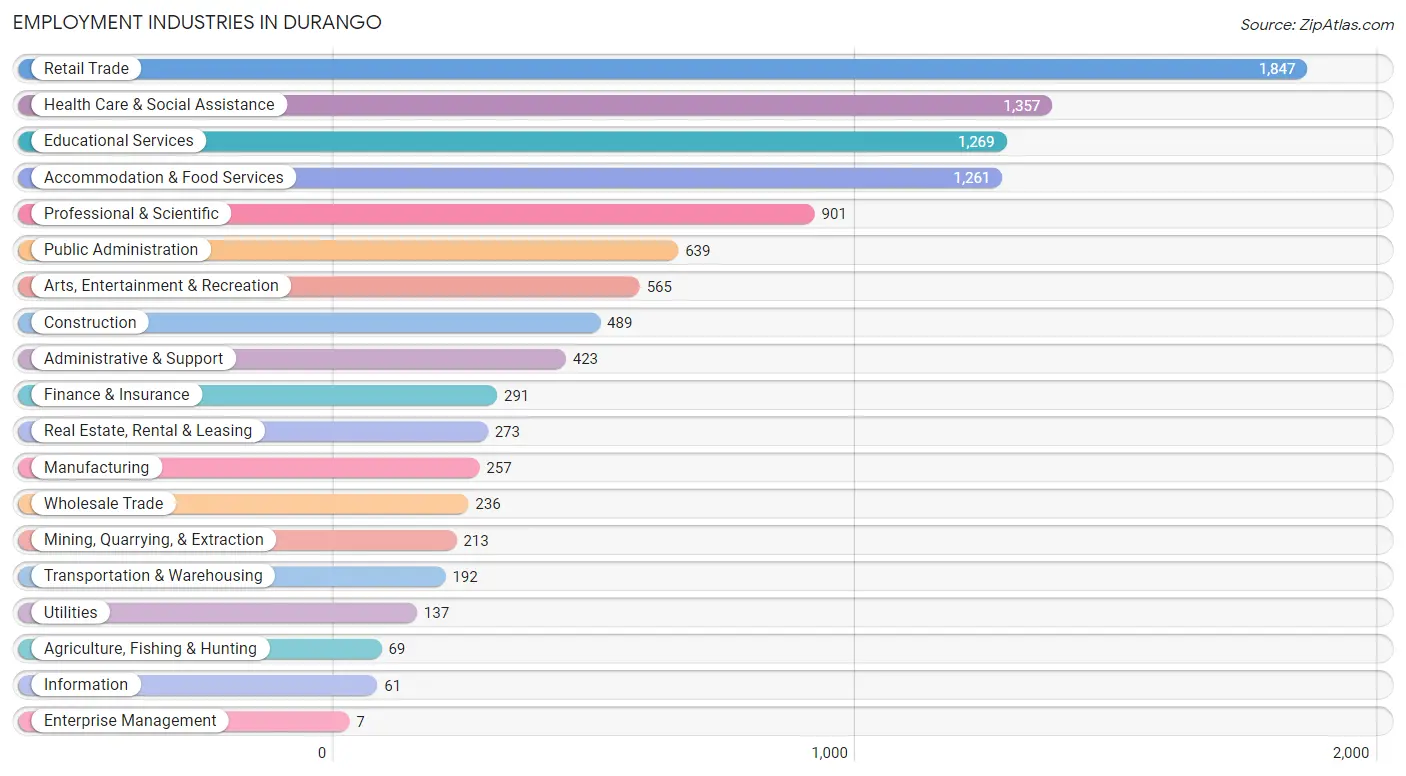
Employment Industries in Durango
The major employment industries in Durango include Retail Trade (1,847 | 16.8%), Health Care & Social Assistance (1,357 | 12.3%), Educational Services (1,269 | 11.5%), Accommodation & Food Services (1,261 | 11.5%), and Professional & Scientific (901 | 8.2%).
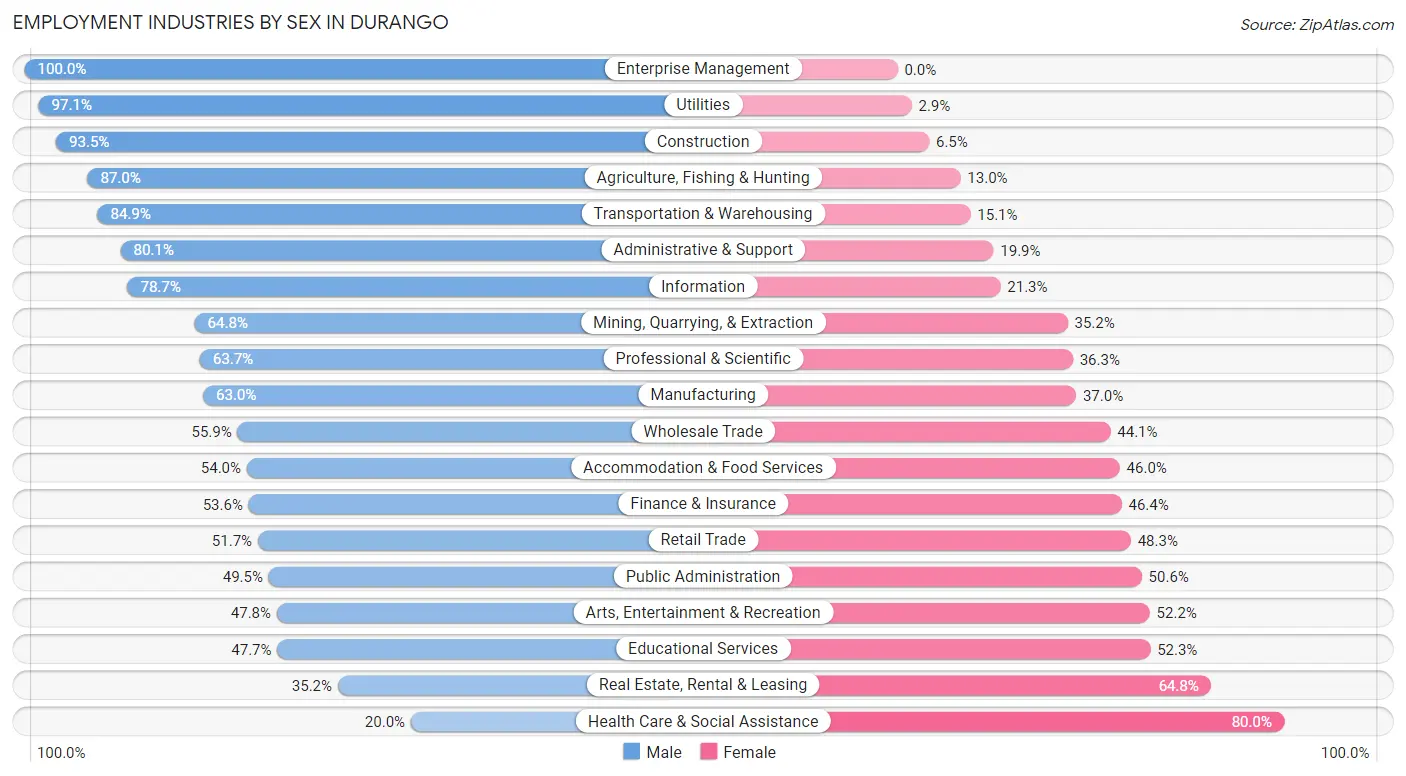
Employment Industries by Sex in Durango
The Durango industries that see more men than women are Enterprise Management (100.0%), Utilities (97.1%), and Construction (93.5%), whereas the industries that tend to have a higher number of women are Health Care & Social Assistance (80.0%), Real Estate, Rental & Leasing (64.8%), and Educational Services (52.3%).
| Industry | Male | Female |
| Agriculture, Fishing & Hunting | 60 (87.0%) | 9 (13.0%) |
| Mining, Quarrying, & Extraction | 138 (64.8%) | 75 (35.2%) |
| Construction | 457 (93.5%) | 32 (6.5%) |
| Manufacturing | 162 (63.0%) | 95 (37.0%) |
| Wholesale Trade | 132 (55.9%) | 104 (44.1%) |
| Retail Trade | 955 (51.7%) | 892 (48.3%) |
| Transportation & Warehousing | 163 (84.9%) | 29 (15.1%) |
| Utilities | 133 (97.1%) | 4 (2.9%) |
| Information | 48 (78.7%) | 13 (21.3%) |
| Finance & Insurance | 156 (53.6%) | 135 (46.4%) |
| Real Estate, Rental & Leasing | 96 (35.2%) | 177 (64.8%) |
| Professional & Scientific | 574 (63.7%) | 327 (36.3%) |
| Enterprise Management | 7 (100.0%) | 0 (0.0%) |
| Administrative & Support | 339 (80.1%) | 84 (19.9%) |
| Educational Services | 605 (47.7%) | 664 (52.3%) |
| Health Care & Social Assistance | 272 (20.0%) | 1,085 (80.0%) |
| Arts, Entertainment & Recreation | 270 (47.8%) | 295 (52.2%) |
| Accommodation & Food Services | 681 (54.0%) | 580 (46.0%) |
| Public Administration | 316 (49.4%) | 323 (50.5%) |
| Total | 5,817 (52.8%) | 5,190 (47.1%) |
Education in Durango
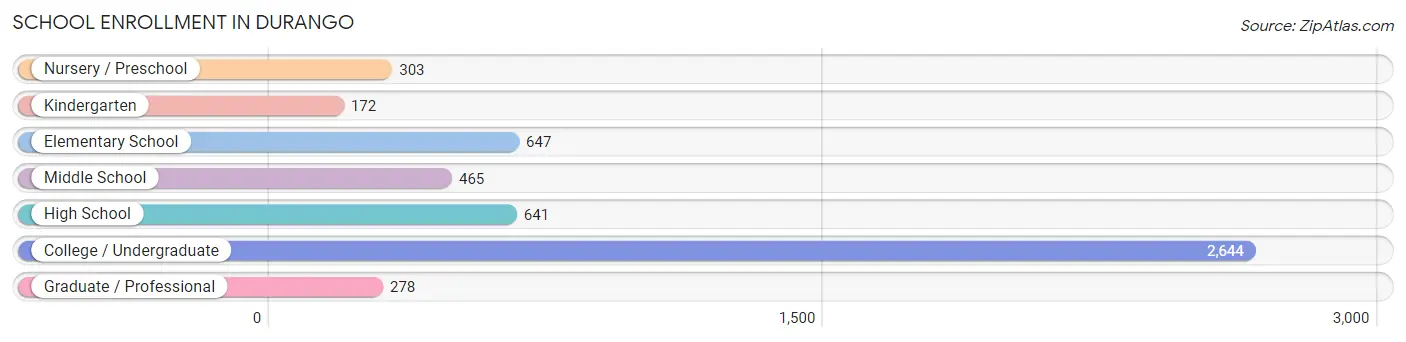
School Enrollment in Durango
The most common levels of schooling among the 5,150 students in Durango are college / undergraduate (2,644 | 51.3%), elementary school (647 | 12.6%), and high school (641 | 12.4%).
| School Level | # Students | % Students |
| Nursery / Preschool | 303 | 5.9% |
| Kindergarten | 172 | 3.3% |
| Elementary School | 647 | 12.6% |
| Middle School | 465 | 9.0% |
| High School | 641 | 12.4% |
| College / Undergraduate | 2,644 | 51.3% |
| Graduate / Professional | 278 | 5.4% |
| Total | 5,150 | 100.0% |
School Enrollment by Age by Funding Source in Durango
Out of a total of 5,150 students who are enrolled in schools in Durango, 582 (11.3%) attend a private institution, while the remaining 4,568 (88.7%) are enrolled in public schools. The age group of 3 to 4 year olds has the highest likelihood of being enrolled in private schools, with 166 (58.0% in the age bracket) enrolled. Conversely, the age group of 15 to 17 year olds has the lowest likelihood of being enrolled in a private school, with 432 (100.0% in the age bracket) attending a public institution.
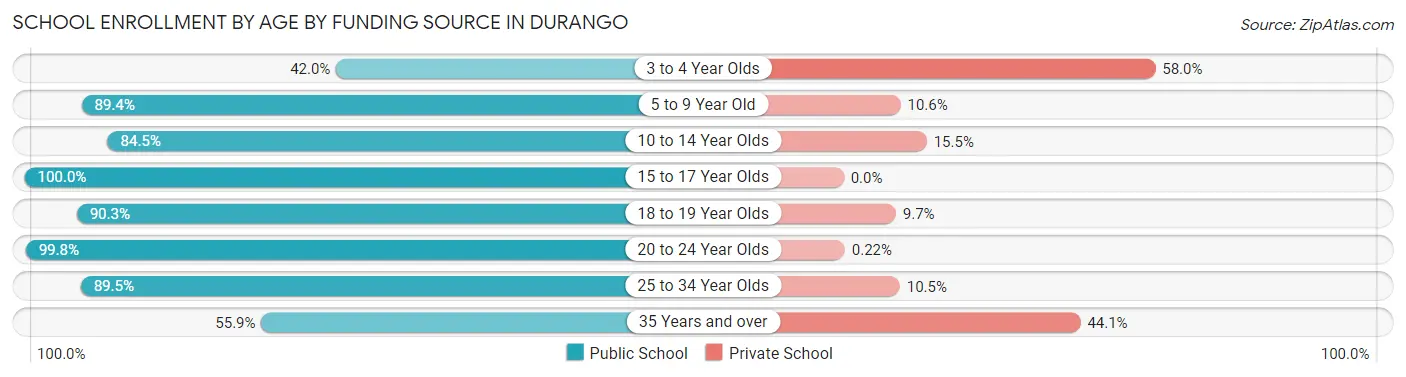
| Age Bracket | Public School | Private School |
| 3 to 4 Year Olds | 120 (42.0%) | 166 (58.0%) |
| 5 to 9 Year Old | 658 (89.4%) | 78 (10.6%) |
| 10 to 14 Year Olds | 530 (84.5%) | 97 (15.5%) |
| 15 to 17 Year Olds | 432 (100.0%) | 0 (0.0%) |
| 18 to 19 Year Olds | 957 (90.3%) | 103 (9.7%) |
| 20 to 24 Year Olds | 1,333 (99.8%) | 3 (0.2%) |
| 25 to 34 Year Olds | 428 (89.5%) | 50 (10.5%) |
| 35 Years and over | 109 (55.9%) | 86 (44.1%) |
| Total | 4,568 (88.7%) | 582 (11.3%) |
Educational Attainment by Field of Study in Durango
Education (1,102 | 13.1%), social sciences (996 | 11.8%), business (951 | 11.3%), science & technology (909 | 10.8%), and bio, nature & agricultural (759 | 9.0%) are the most common fields of study among 8,409 individuals in Durango who have obtained a bachelor's degree or higher.
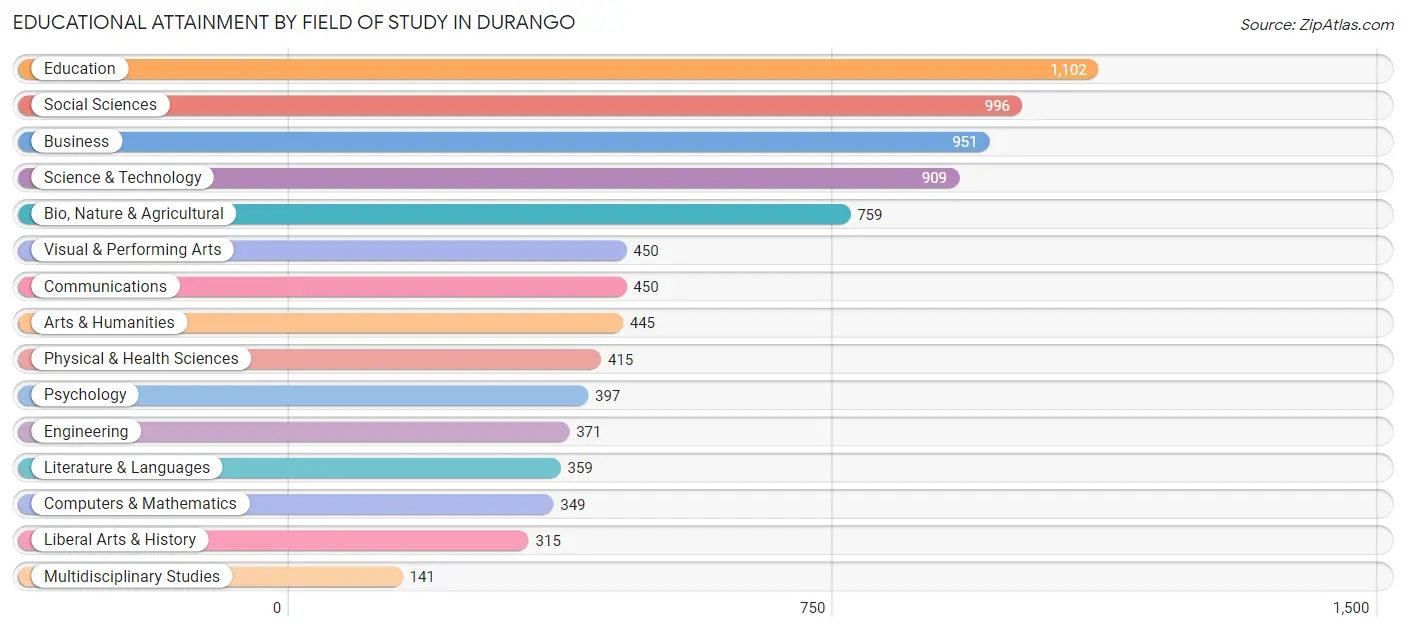
| Field of Study | # Graduates | % Graduates |
| Computers & Mathematics | 349 | 4.2% |
| Bio, Nature & Agricultural | 759 | 9.0% |
| Physical & Health Sciences | 415 | 4.9% |
| Psychology | 397 | 4.7% |
| Social Sciences | 996 | 11.8% |
| Engineering | 371 | 4.4% |
| Multidisciplinary Studies | 141 | 1.7% |
| Science & Technology | 909 | 10.8% |
| Business | 951 | 11.3% |
| Education | 1,102 | 13.1% |
| Literature & Languages | 359 | 4.3% |
| Liberal Arts & History | 315 | 3.7% |
| Visual & Performing Arts | 450 | 5.3% |
| Communications | 450 | 5.3% |
| Arts & Humanities | 445 | 5.3% |
| Total | 8,409 | 100.0% |
Transportation & Commute in Durango
Vehicle Availability by Sex in Durango
The most prevalent vehicle ownership categories in Durango are males with 2 vehicles (2,218, accounting for 40.5%) and females with 2 vehicles (2,215, making up 46.7%).
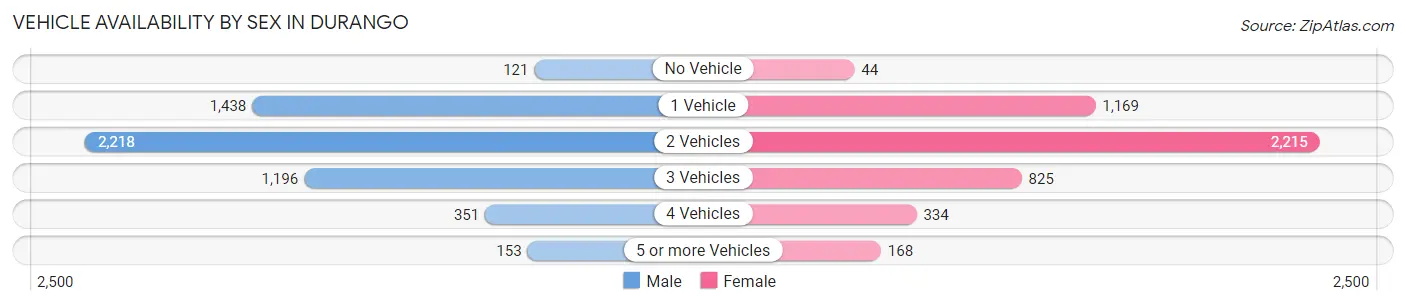
| Vehicles Available | Male | Female |
| No Vehicle | 121 (2.2%) | 44 (0.9%) |
| 1 Vehicle | 1,438 (26.3%) | 1,169 (24.6%) |
| 2 Vehicles | 2,218 (40.5%) | 2,215 (46.6%) |
| 3 Vehicles | 1,196 (21.8%) | 825 (17.3%) |
| 4 Vehicles | 351 (6.4%) | 334 (7.0%) |
| 5 or more Vehicles | 153 (2.8%) | 168 (3.5%) |
| Total | 5,477 (100.0%) | 4,755 (100.0%) |
Commute Time in Durango
The most frequently occuring commute durations in Durango are 10 to 14 minutes (2,785 commuters, 29.3%), 5 to 9 minutes (2,358 commuters, 24.8%), and 15 to 19 minutes (1,662 commuters, 17.5%).
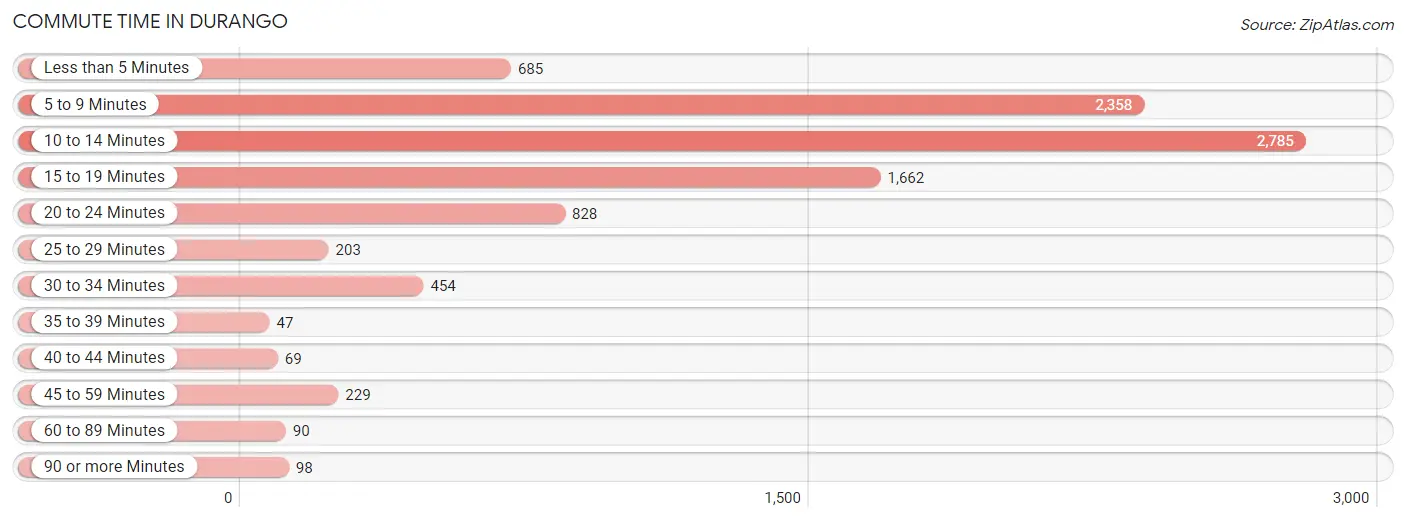
| Commute Time | # Commuters | % Commuters |
| Less than 5 Minutes | 685 | 7.2% |
| 5 to 9 Minutes | 2,358 | 24.8% |
| 10 to 14 Minutes | 2,785 | 29.3% |
| 15 to 19 Minutes | 1,662 | 17.5% |
| 20 to 24 Minutes | 828 | 8.7% |
| 25 to 29 Minutes | 203 | 2.1% |
| 30 to 34 Minutes | 454 | 4.8% |
| 35 to 39 Minutes | 47 | 0.5% |
| 40 to 44 Minutes | 69 | 0.7% |
| 45 to 59 Minutes | 229 | 2.4% |
| 60 to 89 Minutes | 90 | 0.9% |
| 90 or more Minutes | 98 | 1.0% |
Commute Time by Sex in Durango
The most common commute times in Durango are 5 to 9 minutes (1,404 commuters, 27.5%) for males and 10 to 14 minutes (1,432 commuters, 32.6%) for females.
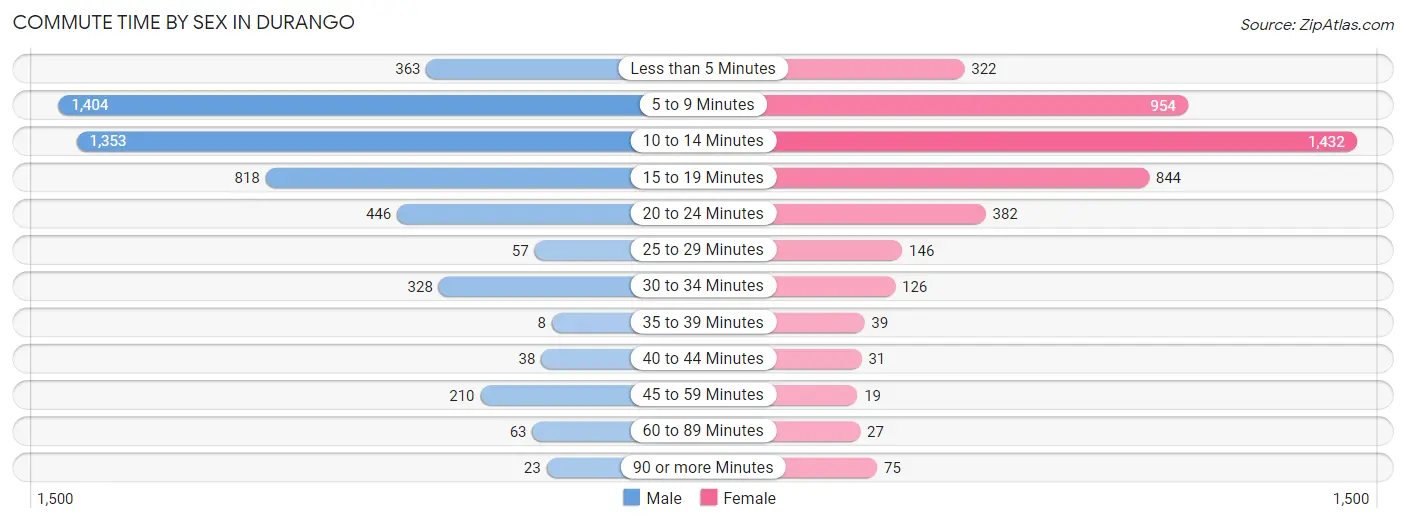
| Commute Time | Male | Female |
| Less than 5 Minutes | 363 (7.1%) | 322 (7.3%) |
| 5 to 9 Minutes | 1,404 (27.5%) | 954 (21.7%) |
| 10 to 14 Minutes | 1,353 (26.5%) | 1,432 (32.6%) |
| 15 to 19 Minutes | 818 (16.0%) | 844 (19.2%) |
| 20 to 24 Minutes | 446 (8.7%) | 382 (8.7%) |
| 25 to 29 Minutes | 57 (1.1%) | 146 (3.3%) |
| 30 to 34 Minutes | 328 (6.4%) | 126 (2.9%) |
| 35 to 39 Minutes | 8 (0.2%) | 39 (0.9%) |
| 40 to 44 Minutes | 38 (0.7%) | 31 (0.7%) |
| 45 to 59 Minutes | 210 (4.1%) | 19 (0.4%) |
| 60 to 89 Minutes | 63 (1.2%) | 27 (0.6%) |
| 90 or more Minutes | 23 (0.4%) | 75 (1.7%) |
Time of Departure to Work by Sex in Durango
The most frequent times of departure to work in Durango are 8:00 AM to 8:29 AM (1,125, 22.0%) for males and 7:00 AM to 7:29 AM (742, 16.9%) for females.
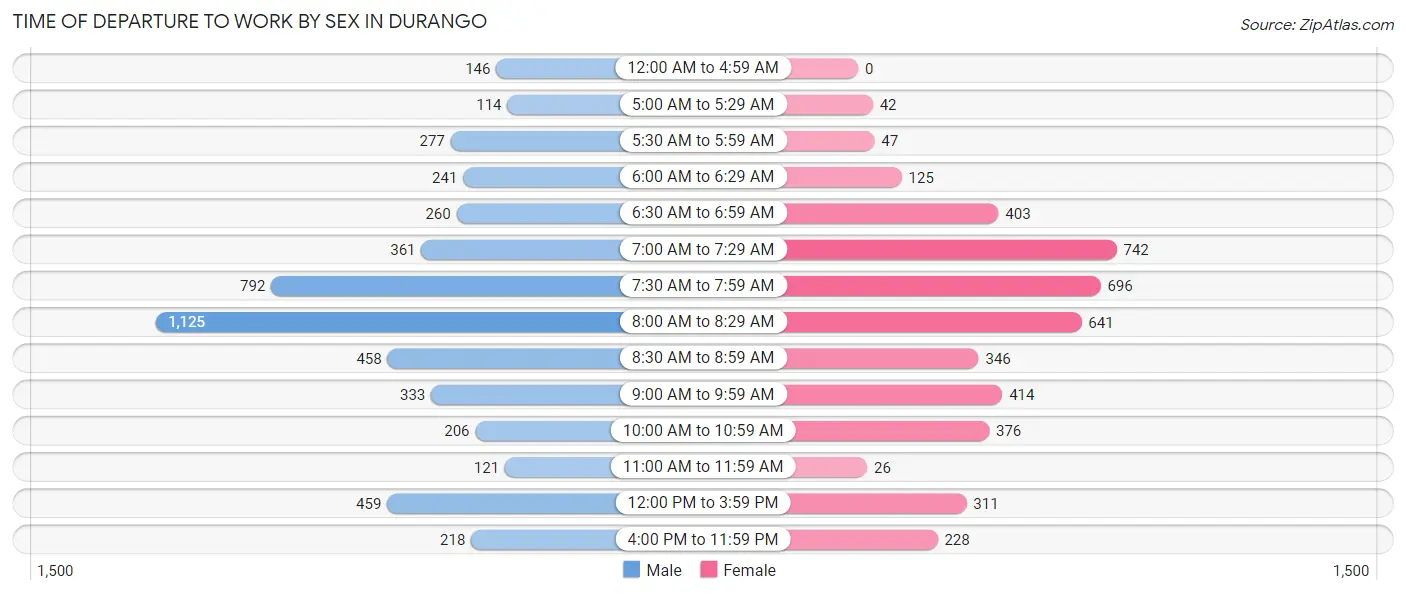
| Time of Departure | Male | Female |
| 12:00 AM to 4:59 AM | 146 (2.9%) | 0 (0.0%) |
| 5:00 AM to 5:29 AM | 114 (2.2%) | 42 (1.0%) |
| 5:30 AM to 5:59 AM | 277 (5.4%) | 47 (1.1%) |
| 6:00 AM to 6:29 AM | 241 (4.7%) | 125 (2.8%) |
| 6:30 AM to 6:59 AM | 260 (5.1%) | 403 (9.2%) |
| 7:00 AM to 7:29 AM | 361 (7.1%) | 742 (16.9%) |
| 7:30 AM to 7:59 AM | 792 (15.5%) | 696 (15.8%) |
| 8:00 AM to 8:29 AM | 1,125 (22.0%) | 641 (14.6%) |
| 8:30 AM to 8:59 AM | 458 (9.0%) | 346 (7.9%) |
| 9:00 AM to 9:59 AM | 333 (6.5%) | 414 (9.4%) |
| 10:00 AM to 10:59 AM | 206 (4.0%) | 376 (8.6%) |
| 11:00 AM to 11:59 AM | 121 (2.4%) | 26 (0.6%) |
| 12:00 PM to 3:59 PM | 459 (9.0%) | 311 (7.1%) |
| 4:00 PM to 11:59 PM | 218 (4.3%) | 228 (5.2%) |
| Total | 5,111 (100.0%) | 4,397 (100.0%) |
Housing Occupancy in Durango
Occupancy by Ownership in Durango
Of the total 8,139 dwellings in Durango, owner-occupied units account for 4,511 (55.4%), while renter-occupied units make up 3,628 (44.6%).
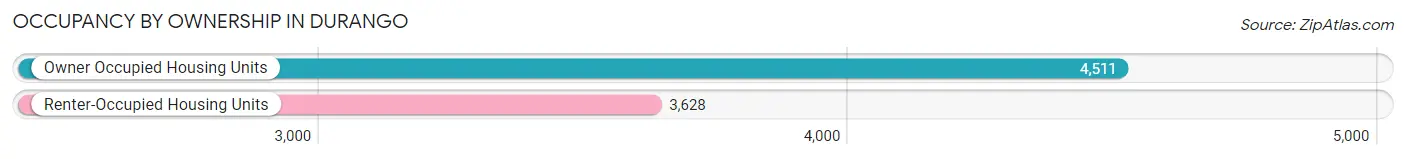
| Occupancy | # Housing Units | % Housing Units |
| Owner Occupied Housing Units | 4,511 | 55.4% |
| Renter-Occupied Housing Units | 3,628 | 44.6% |
| Total Occupied Housing Units | 8,139 | 100.0% |
Occupancy by Household Size in Durango
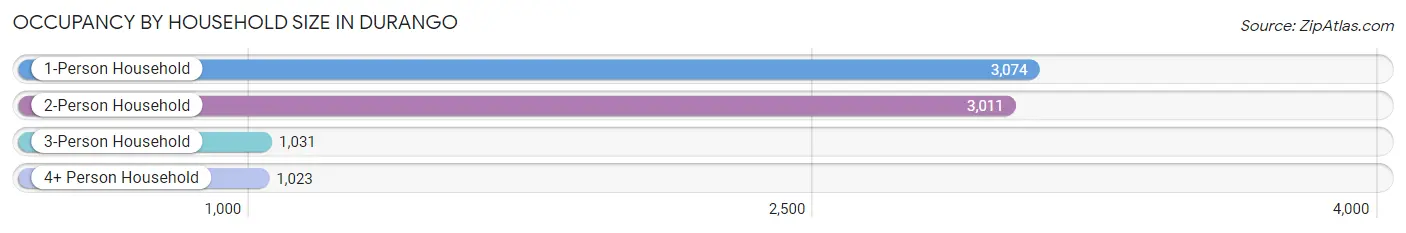
| Household Size | # Housing Units | % Housing Units |
| 1-Person Household | 3,074 | 37.8% |
| 2-Person Household | 3,011 | 37.0% |
| 3-Person Household | 1,031 | 12.7% |
| 4+ Person Household | 1,023 | 12.6% |
| Total Housing Units | 8,139 | 100.0% |
Occupancy by Ownership by Household Size in Durango
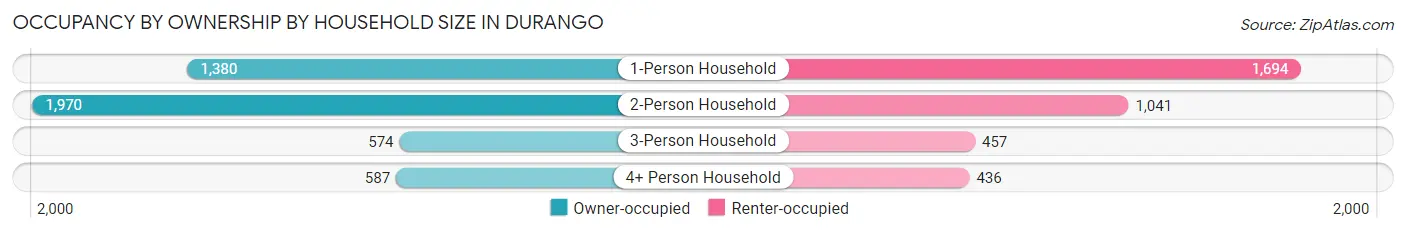
| Household Size | Owner-occupied | Renter-occupied |
| 1-Person Household | 1,380 (44.9%) | 1,694 (55.1%) |
| 2-Person Household | 1,970 (65.4%) | 1,041 (34.6%) |
| 3-Person Household | 574 (55.7%) | 457 (44.3%) |
| 4+ Person Household | 587 (57.4%) | 436 (42.6%) |
| Total Housing Units | 4,511 (55.4%) | 3,628 (44.6%) |
Occupancy by Educational Attainment in Durango
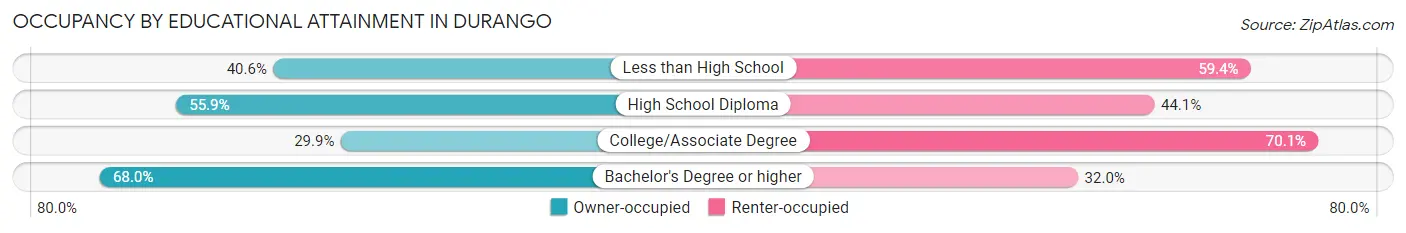
| Household Size | Owner-occupied | Renter-occupied |
| Less than High School | 76 (40.6%) | 111 (59.4%) |
| High School Diploma | 509 (55.9%) | 401 (44.1%) |
| College/Associate Degree | 680 (29.9%) | 1,591 (70.1%) |
| Bachelor's Degree or higher | 3,246 (68.0%) | 1,525 (32.0%) |
Occupancy by Age of Householder in Durango
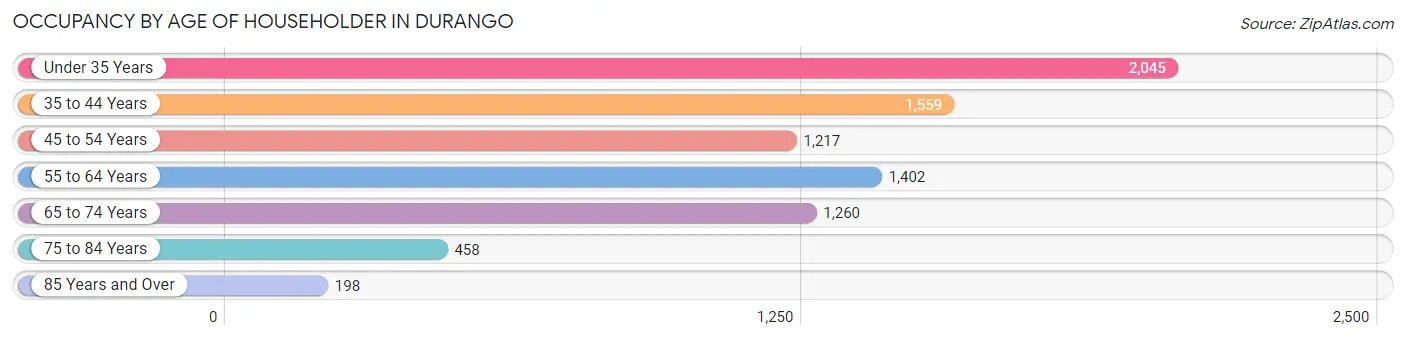
| Age Bracket | # Households | % Households |
| Under 35 Years | 2,045 | 25.1% |
| 35 to 44 Years | 1,559 | 19.2% |
| 45 to 54 Years | 1,217 | 14.9% |
| 55 to 64 Years | 1,402 | 17.2% |
| 65 to 74 Years | 1,260 | 15.5% |
| 75 to 84 Years | 458 | 5.6% |
| 85 Years and Over | 198 | 2.4% |
| Total | 8,139 | 100.0% |
Housing Finances in Durango
Median Income by Occupancy in Durango
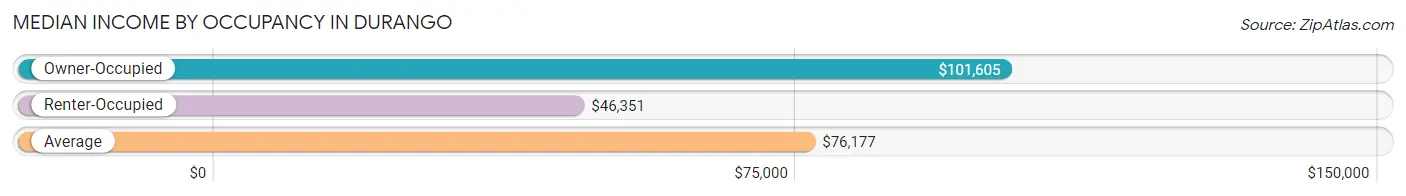
| Occupancy Type | # Households | Median Income |
| Owner-Occupied | 4,511 (55.4%) | $101,605 |
| Renter-Occupied | 3,628 (44.6%) | $46,351 |
| Average | 8,139 (100.0%) | $76,177 |
Occupancy by Householder Income Bracket in Durango
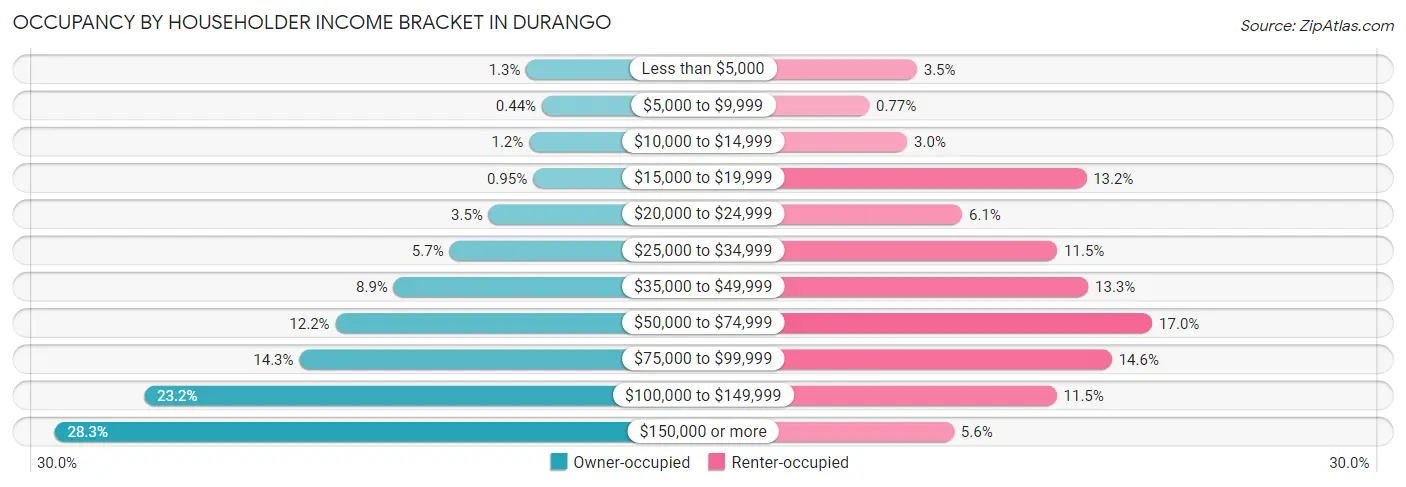
| Income Bracket | Owner-occupied | Renter-occupied |
| Less than $5,000 | 60 (1.3%) | 127 (3.5%) |
| $5,000 to $9,999 | 20 (0.4%) | 28 (0.8%) |
| $10,000 to $14,999 | 53 (1.2%) | 107 (2.9%) |
| $15,000 to $19,999 | 43 (0.9%) | 478 (13.2%) |
| $20,000 to $24,999 | 157 (3.5%) | 221 (6.1%) |
| $25,000 to $34,999 | 258 (5.7%) | 418 (11.5%) |
| $35,000 to $49,999 | 402 (8.9%) | 482 (13.3%) |
| $50,000 to $74,999 | 552 (12.2%) | 615 (17.0%) |
| $75,000 to $99,999 | 645 (14.3%) | 531 (14.6%) |
| $100,000 to $149,999 | 1,045 (23.2%) | 417 (11.5%) |
| $150,000 or more | 1,276 (28.3%) | 204 (5.6%) |
| Total | 4,511 (100.0%) | 3,628 (100.0%) |
Monthly Housing Cost Tiers in Durango
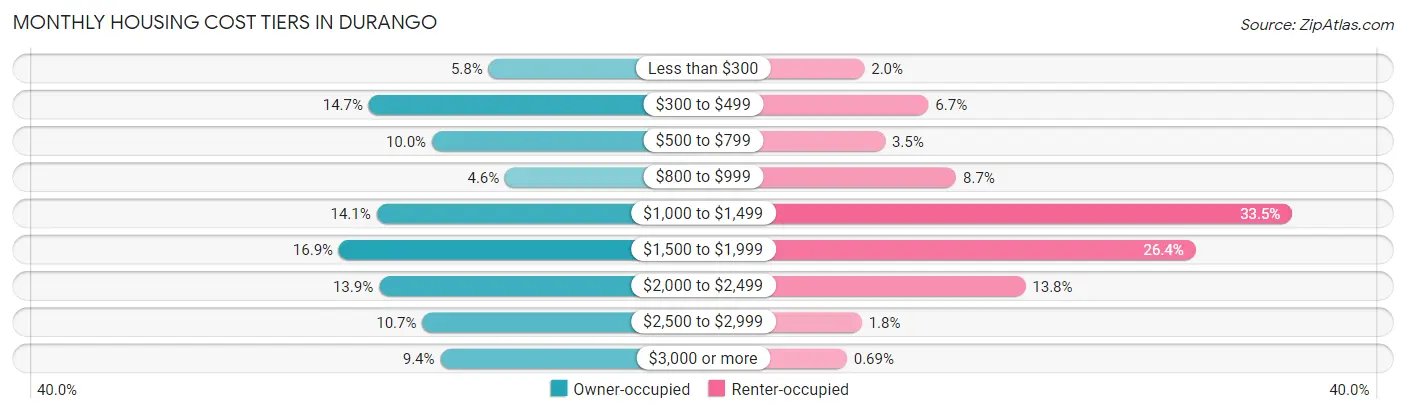
| Monthly Cost | Owner-occupied | Renter-occupied |
| Less than $300 | 263 (5.8%) | 72 (2.0%) |
| $300 to $499 | 661 (14.6%) | 243 (6.7%) |
| $500 to $799 | 451 (10.0%) | 127 (3.5%) |
| $800 to $999 | 208 (4.6%) | 317 (8.7%) |
| $1,000 to $1,499 | 635 (14.1%) | 1,215 (33.5%) |
| $1,500 to $1,999 | 760 (16.9%) | 957 (26.4%) |
| $2,000 to $2,499 | 627 (13.9%) | 502 (13.8%) |
| $2,500 to $2,999 | 483 (10.7%) | 65 (1.8%) |
| $3,000 or more | 423 (9.4%) | 25 (0.7%) |
| Total | 4,511 (100.0%) | 3,628 (100.0%) |
Physical Housing Characteristics in Durango
Housing Structures in Durango
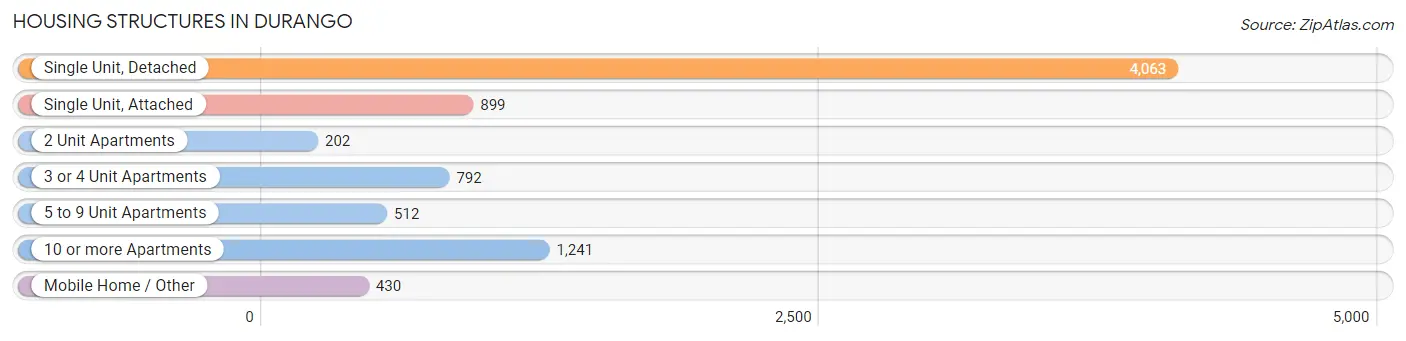
| Structure Type | # Housing Units | % Housing Units |
| Single Unit, Detached | 4,063 | 49.9% |
| Single Unit, Attached | 899 | 11.1% |
| 2 Unit Apartments | 202 | 2.5% |
| 3 or 4 Unit Apartments | 792 | 9.7% |
| 5 to 9 Unit Apartments | 512 | 6.3% |
| 10 or more Apartments | 1,241 | 15.2% |
| Mobile Home / Other | 430 | 5.3% |
| Total | 8,139 | 100.0% |
Housing Structures by Occupancy in Durango
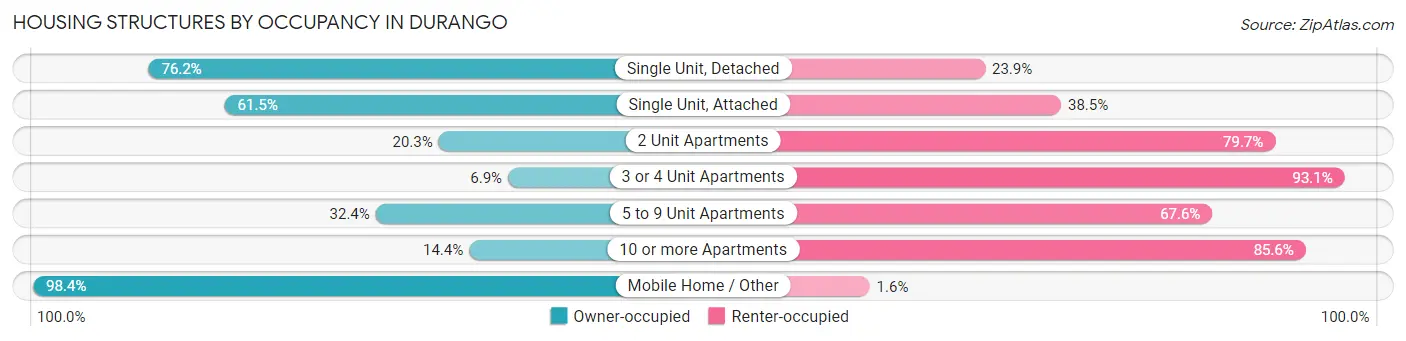
| Structure Type | Owner-occupied | Renter-occupied |
| Single Unit, Detached | 3,094 (76.1%) | 969 (23.8%) |
| Single Unit, Attached | 553 (61.5%) | 346 (38.5%) |
| 2 Unit Apartments | 41 (20.3%) | 161 (79.7%) |
| 3 or 4 Unit Apartments | 55 (6.9%) | 737 (93.1%) |
| 5 to 9 Unit Apartments | 166 (32.4%) | 346 (67.6%) |
| 10 or more Apartments | 179 (14.4%) | 1,062 (85.6%) |
| Mobile Home / Other | 423 (98.4%) | 7 (1.6%) |
| Total | 4,511 (55.4%) | 3,628 (44.6%) |
Housing Structures by Number of Rooms in Durango
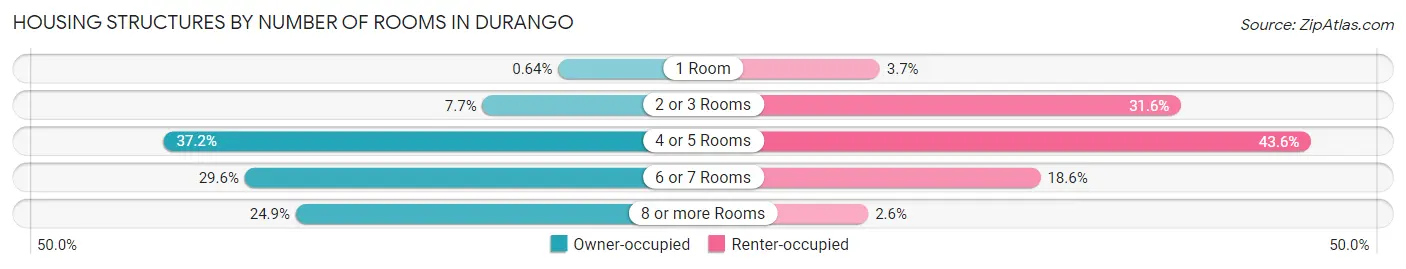
| Number of Rooms | Owner-occupied | Renter-occupied |
| 1 Room | 29 (0.6%) | 134 (3.7%) |
| 2 or 3 Rooms | 345 (7.6%) | 1,145 (31.6%) |
| 4 or 5 Rooms | 1,676 (37.1%) | 1,581 (43.6%) |
| 6 or 7 Rooms | 1,337 (29.6%) | 673 (18.5%) |
| 8 or more Rooms | 1,124 (24.9%) | 95 (2.6%) |
| Total | 4,511 (100.0%) | 3,628 (100.0%) |
Housing Structure by Heating Type in Durango
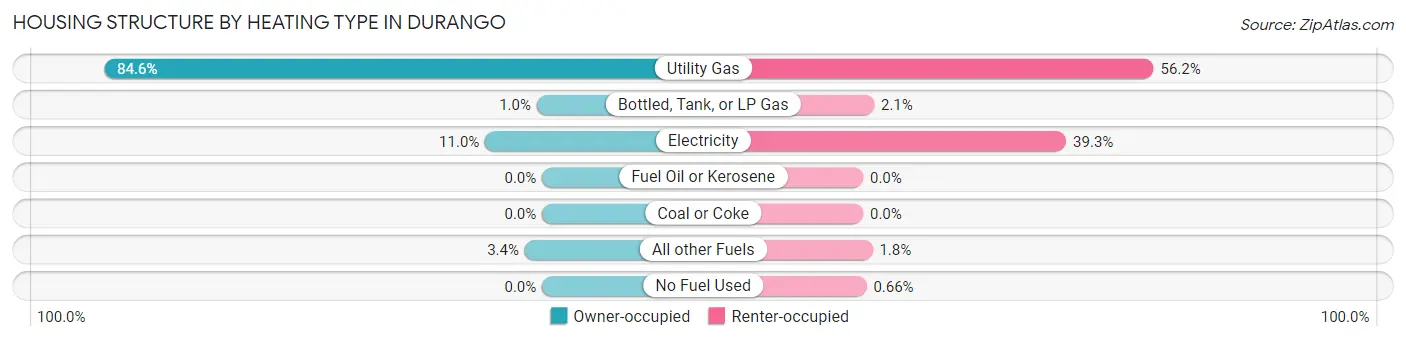
| Heating Type | Owner-occupied | Renter-occupied |
| Utility Gas | 3,818 (84.6%) | 2,037 (56.1%) |
| Bottled, Tank, or LP Gas | 46 (1.0%) | 77 (2.1%) |
| Electricity | 496 (11.0%) | 1,424 (39.3%) |
| Fuel Oil or Kerosene | 0 (0.0%) | 0 (0.0%) |
| Coal or Coke | 0 (0.0%) | 0 (0.0%) |
| All other Fuels | 151 (3.4%) | 66 (1.8%) |
| No Fuel Used | 0 (0.0%) | 24 (0.7%) |
| Total | 4,511 (100.0%) | 3,628 (100.0%) |
Household Vehicle Usage in Durango
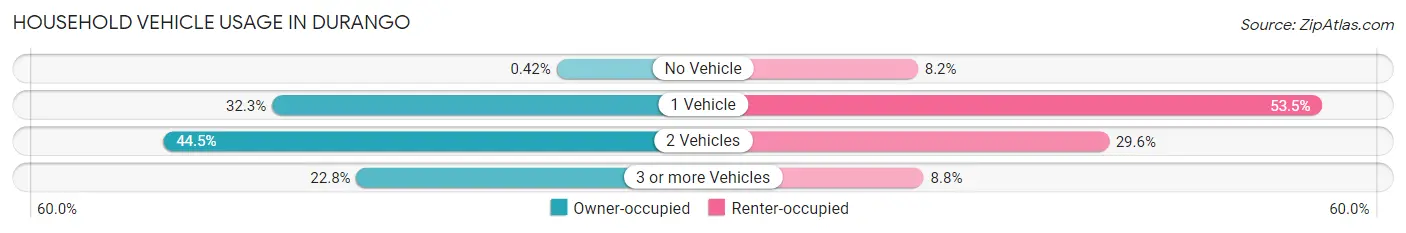
| Vehicles per Household | Owner-occupied | Renter-occupied |
| No Vehicle | 19 (0.4%) | 296 (8.2%) |
| 1 Vehicle | 1,456 (32.3%) | 1,940 (53.5%) |
| 2 Vehicles | 2,006 (44.5%) | 1,072 (29.5%) |
| 3 or more Vehicles | 1,030 (22.8%) | 320 (8.8%) |
| Total | 4,511 (100.0%) | 3,628 (100.0%) |
Real Estate & Mortgages in Durango
Real Estate and Mortgage Overview in Durango
| Characteristic | Without Mortgage | With Mortgage |
| Housing Units | 1,639 | 2,872 |
| Median Property Value | $495,300 | $599,600 |
| Median Household Income | $71,973 | $971 |
| Monthly Housing Costs | $465 | $423 |
| Real Estate Taxes | $1,232 | $37 |
Property Value by Mortgage Status in Durango
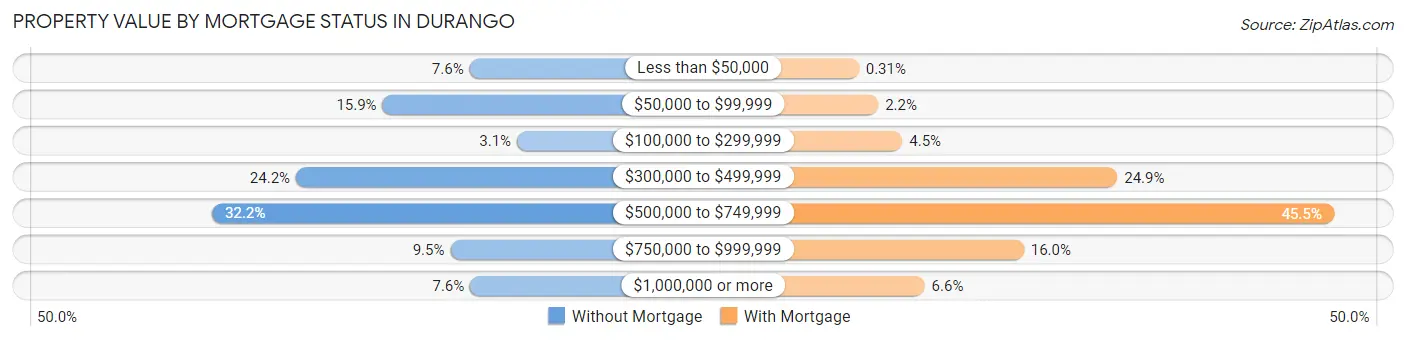
| Property Value | Without Mortgage | With Mortgage |
| Less than $50,000 | 125 (7.6%) | 9 (0.3%) |
| $50,000 to $99,999 | 261 (15.9%) | 62 (2.2%) |
| $100,000 to $299,999 | 51 (3.1%) | 128 (4.5%) |
| $300,000 to $499,999 | 396 (24.2%) | 716 (24.9%) |
| $500,000 to $749,999 | 527 (32.2%) | 1,308 (45.5%) |
| $750,000 to $999,999 | 155 (9.5%) | 460 (16.0%) |
| $1,000,000 or more | 124 (7.6%) | 189 (6.6%) |
| Total | 1,639 (100.0%) | 2,872 (100.0%) |
Household Income by Mortgage Status in Durango
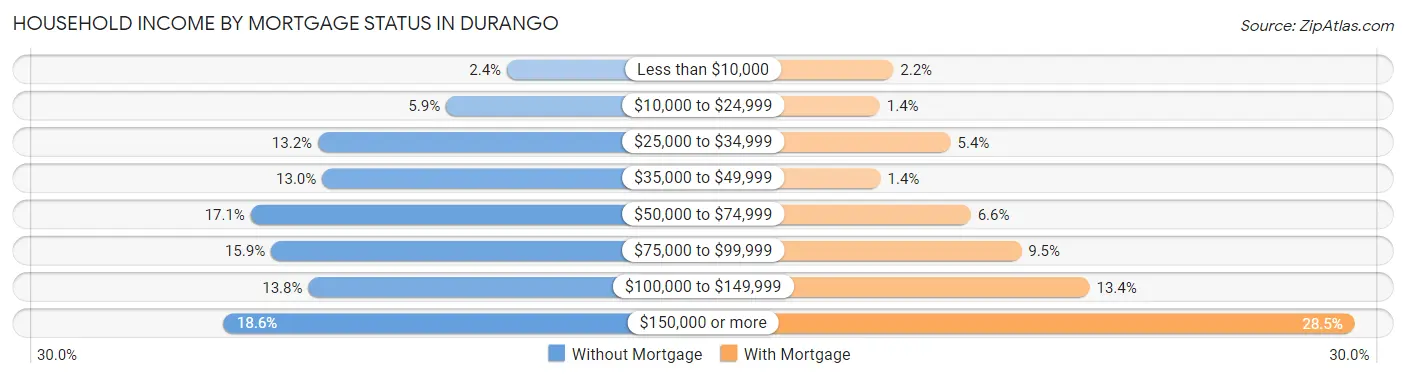
| Household Income | Without Mortgage | With Mortgage |
| Less than $10,000 | 40 (2.4%) | 62 (2.2%) |
| $10,000 to $24,999 | 97 (5.9%) | 40 (1.4%) |
| $25,000 to $34,999 | 217 (13.2%) | 156 (5.4%) |
| $35,000 to $49,999 | 213 (13.0%) | 41 (1.4%) |
| $50,000 to $74,999 | 280 (17.1%) | 189 (6.6%) |
| $75,000 to $99,999 | 261 (15.9%) | 272 (9.5%) |
| $100,000 to $149,999 | 226 (13.8%) | 384 (13.4%) |
| $150,000 or more | 305 (18.6%) | 819 (28.5%) |
| Total | 1,639 (100.0%) | 2,872 (100.0%) |
Property Value to Household Income Ratio in Durango
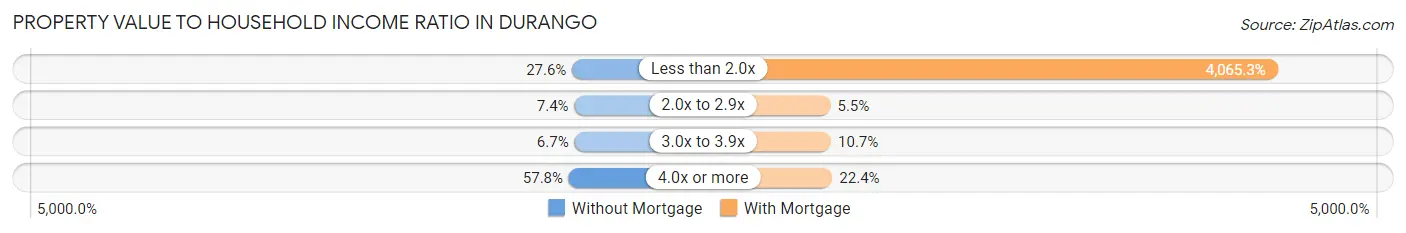
| Value-to-Income Ratio | Without Mortgage | With Mortgage |
| Less than 2.0x | 452 (27.6%) | 116,754 (4,065.3%) |
| 2.0x to 2.9x | 121 (7.4%) | 157 (5.5%) |
| 3.0x to 3.9x | 110 (6.7%) | 306 (10.6%) |
| 4.0x or more | 948 (57.8%) | 644 (22.4%) |
| Total | 1,639 (100.0%) | 2,872 (100.0%) |
Real Estate Taxes by Mortgage Status in Durango
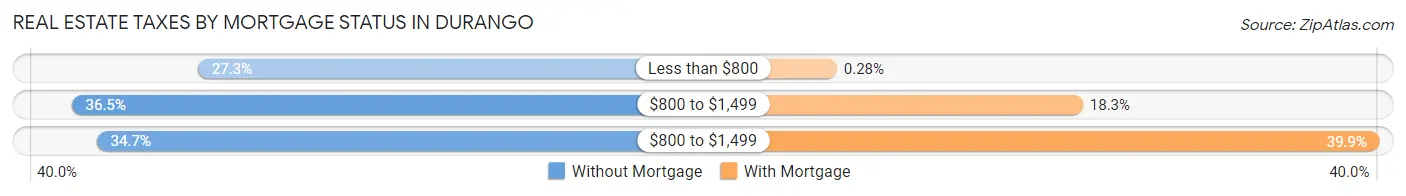
| Property Taxes | Without Mortgage | With Mortgage |
| Less than $800 | 447 (27.3%) | 8 (0.3%) |
| $800 to $1,499 | 598 (36.5%) | 524 (18.2%) |
| $800 to $1,499 | 568 (34.7%) | 1,145 (39.9%) |
| Total | 1,639 (100.0%) | 2,872 (100.0%) |
Health & Disability in Durango
Health Insurance Coverage by Age in Durango
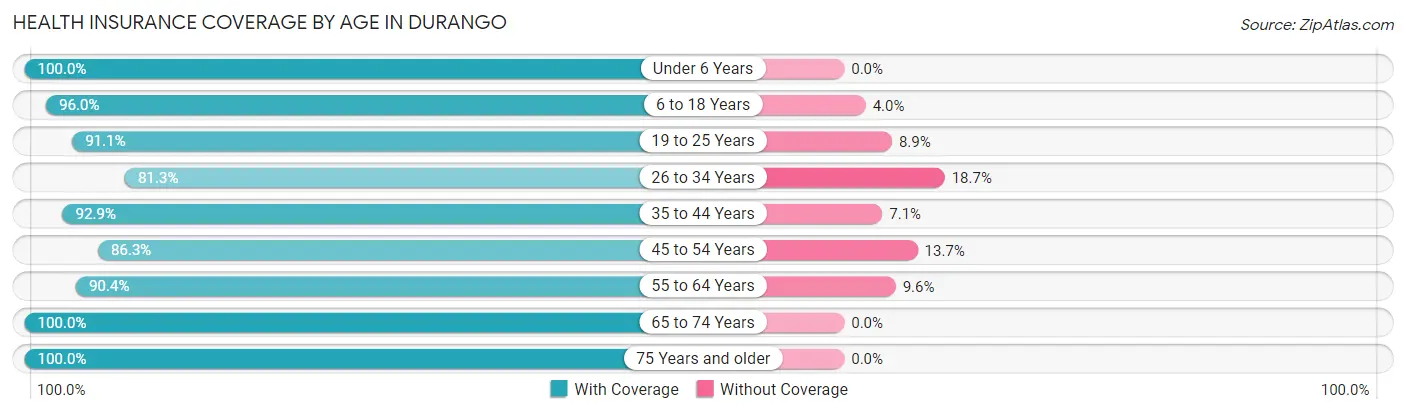
| Age Bracket | With Coverage | Without Coverage |
| Under 6 Years | 1,077 (100.0%) | 0 (0.0%) |
| 6 to 18 Years | 2,210 (96.0%) | 92 (4.0%) |
| 19 to 25 Years | 2,758 (91.1%) | 269 (8.9%) |
| 26 to 34 Years | 2,131 (81.3%) | 491 (18.7%) |
| 35 to 44 Years | 2,346 (92.9%) | 179 (7.1%) |
| 45 to 54 Years | 1,956 (86.3%) | 310 (13.7%) |
| 55 to 64 Years | 2,028 (90.4%) | 215 (9.6%) |
| 65 to 74 Years | 1,872 (100.0%) | 0 (0.0%) |
| 75 Years and older | 890 (100.0%) | 0 (0.0%) |
| Total | 17,268 (91.7%) | 1,556 (8.3%) |
Health Insurance Coverage by Citizenship Status in Durango
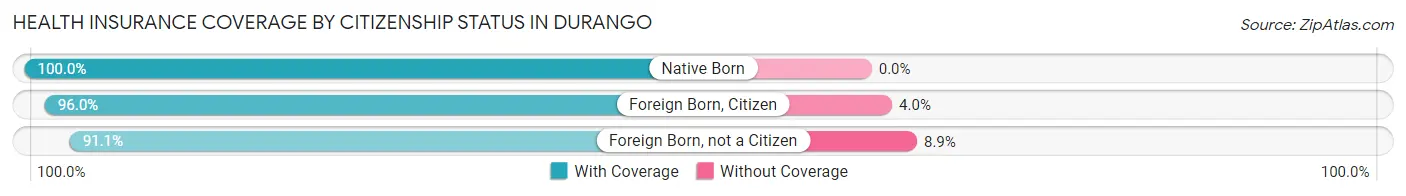
| Citizenship Status | With Coverage | Without Coverage |
| Native Born | 1,077 (100.0%) | 0 (0.0%) |
| Foreign Born, Citizen | 2,210 (96.0%) | 92 (4.0%) |
| Foreign Born, not a Citizen | 2,758 (91.1%) | 269 (8.9%) |
Health Insurance Coverage by Household Income in Durango
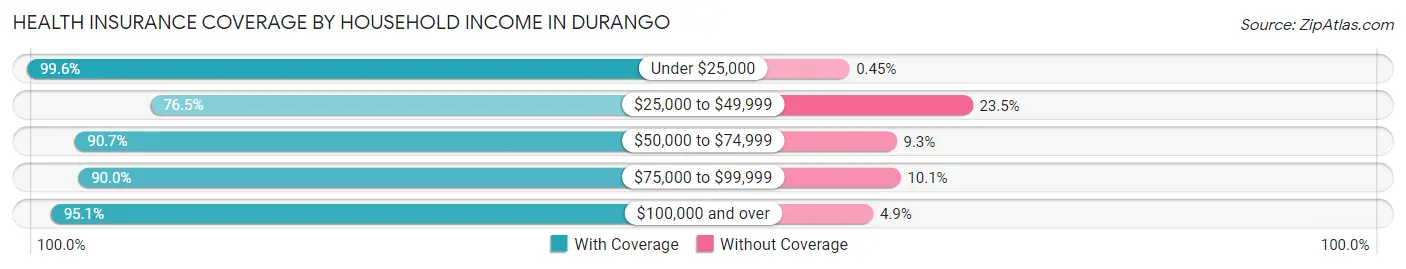
| Household Income | With Coverage | Without Coverage |
| Under $25,000 | 2,207 (99.6%) | 10 (0.4%) |
| $25,000 to $49,999 | 1,874 (76.5%) | 577 (23.5%) |
| $50,000 to $74,999 | 2,131 (90.7%) | 219 (9.3%) |
| $75,000 to $99,999 | 2,149 (89.9%) | 240 (10.1%) |
| $100,000 and over | 7,660 (95.1%) | 395 (4.9%) |
Public vs Private Health Insurance Coverage by Age in Durango
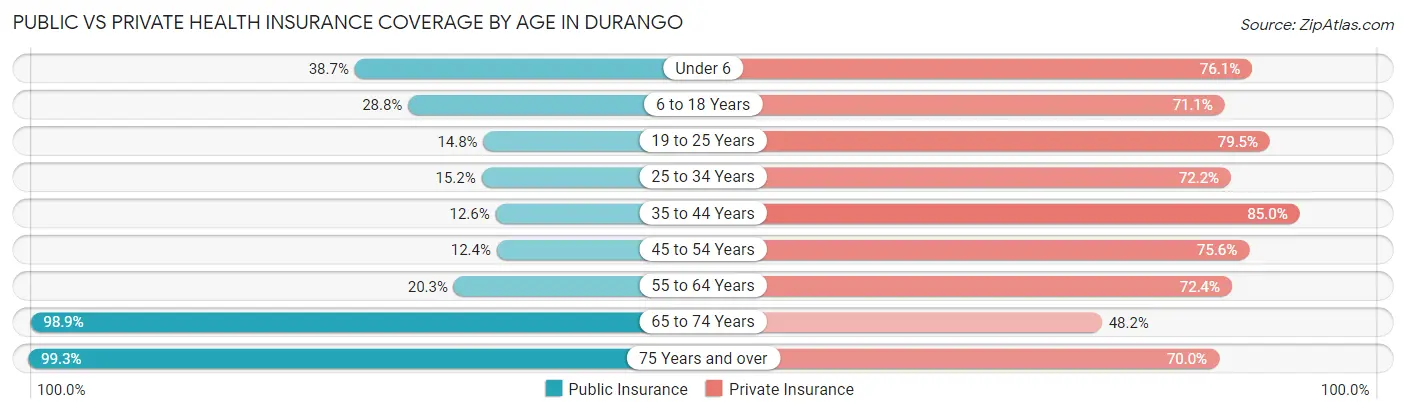
| Age Bracket | Public Insurance | Private Insurance |
| Under 6 | 417 (38.7%) | 820 (76.1%) |
| 6 to 18 Years | 663 (28.8%) | 1,636 (71.1%) |
| 19 to 25 Years | 449 (14.8%) | 2,405 (79.4%) |
| 25 to 34 Years | 398 (15.2%) | 1,894 (72.2%) |
| 35 to 44 Years | 318 (12.6%) | 2,145 (85.0%) |
| 45 to 54 Years | 280 (12.4%) | 1,713 (75.6%) |
| 55 to 64 Years | 456 (20.3%) | 1,624 (72.4%) |
| 65 to 74 Years | 1,852 (98.9%) | 903 (48.2%) |
| 75 Years and over | 884 (99.3%) | 623 (70.0%) |
| Total | 5,717 (30.4%) | 13,763 (73.1%) |
Disability Status by Sex by Age in Durango
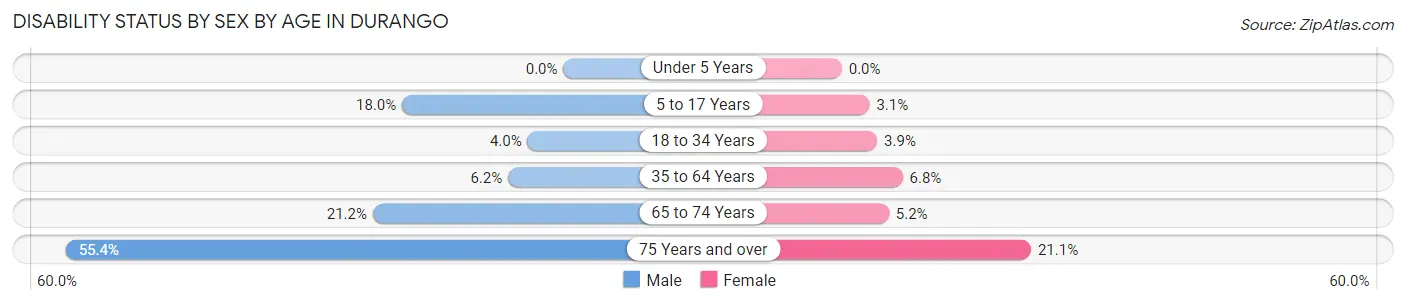
| Age Bracket | Male | Female |
| Under 5 Years | 0 (0.0%) | 0 (0.0%) |
| 5 to 17 Years | 174 (18.0%) | 29 (3.1%) |
| 18 to 34 Years | 123 (4.0%) | 126 (3.9%) |
| 35 to 64 Years | 223 (6.2%) | 231 (6.8%) |
| 65 to 74 Years | 215 (21.2%) | 45 (5.2%) |
| 75 Years and over | 225 (55.4%) | 102 (21.1%) |
Disability Class by Sex by Age in Durango
Disability Class: Hearing Difficulty
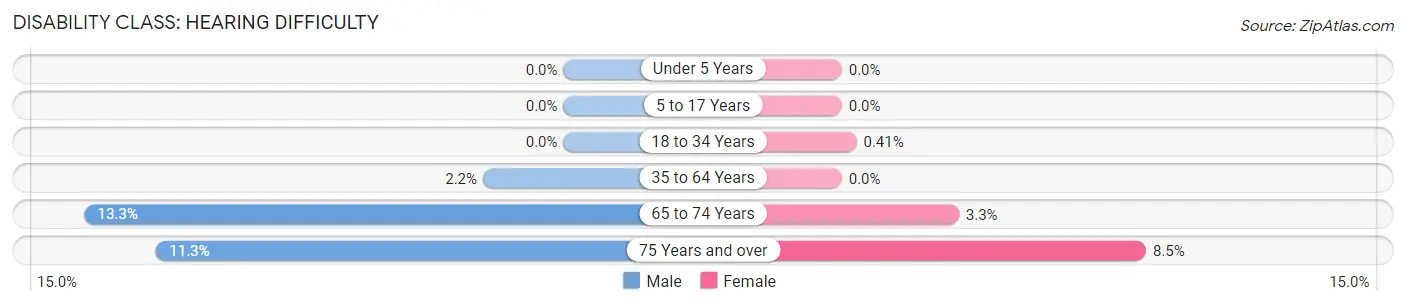
| Age Bracket | Male | Female |
| Under 5 Years | 0 (0.0%) | 0 (0.0%) |
| 5 to 17 Years | 0 (0.0%) | 0 (0.0%) |
| 18 to 34 Years | 0 (0.0%) | 13 (0.4%) |
| 35 to 64 Years | 81 (2.2%) | 0 (0.0%) |
| 65 to 74 Years | 135 (13.3%) | 28 (3.3%) |
| 75 Years and over | 46 (11.3%) | 41 (8.5%) |
Disability Class: Vision Difficulty
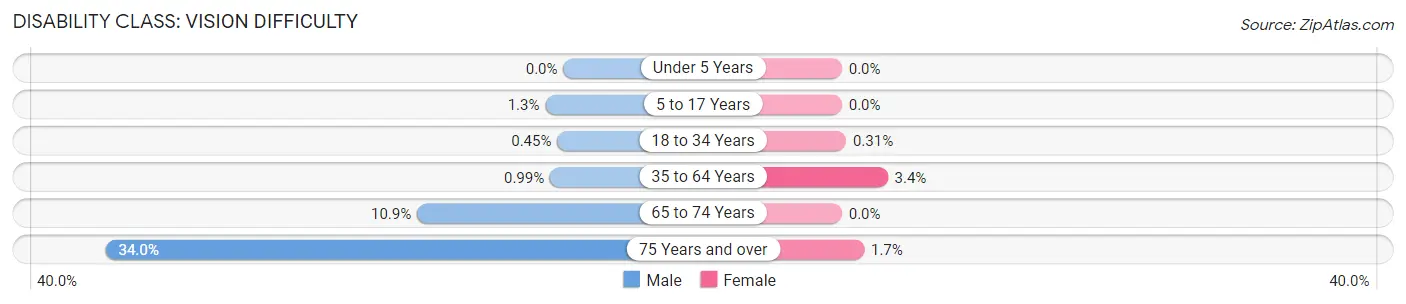
| Age Bracket | Male | Female |
| Under 5 Years | 0 (0.0%) | 0 (0.0%) |
| 5 to 17 Years | 13 (1.3%) | 0 (0.0%) |
| 18 to 34 Years | 14 (0.4%) | 10 (0.3%) |
| 35 to 64 Years | 36 (1.0%) | 116 (3.4%) |
| 65 to 74 Years | 110 (10.9%) | 0 (0.0%) |
| 75 Years and over | 138 (34.0%) | 8 (1.7%) |
Disability Class: Cognitive Difficulty
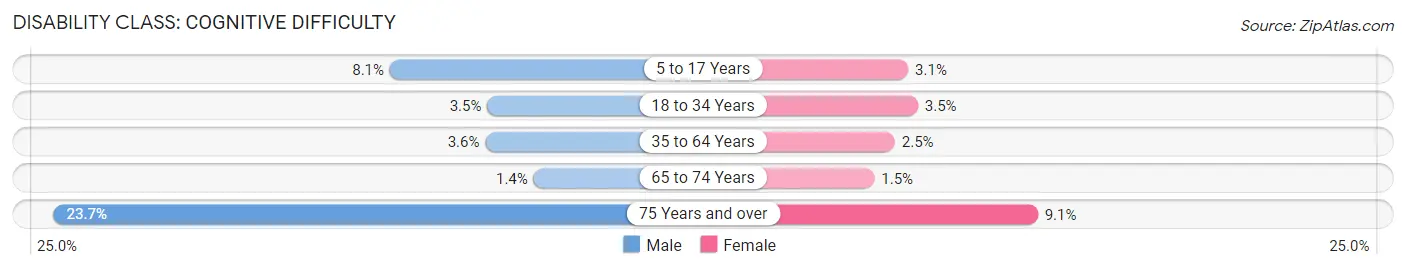
| Age Bracket | Male | Female |
| 5 to 17 Years | 78 (8.1%) | 29 (3.1%) |
| 18 to 34 Years | 109 (3.5%) | 113 (3.5%) |
| 35 to 64 Years | 131 (3.6%) | 84 (2.5%) |
| 65 to 74 Years | 14 (1.4%) | 13 (1.5%) |
| 75 Years and over | 96 (23.6%) | 44 (9.1%) |
Disability Class: Ambulatory Difficulty
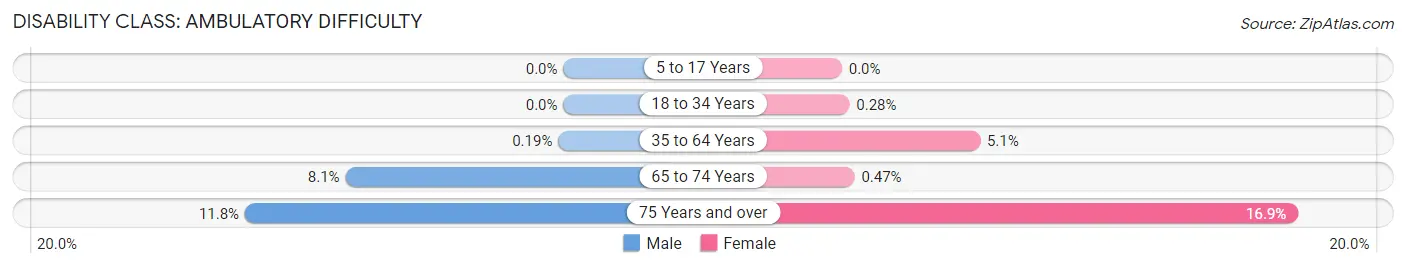
| Age Bracket | Male | Female |
| 5 to 17 Years | 0 (0.0%) | 0 (0.0%) |
| 18 to 34 Years | 0 (0.0%) | 9 (0.3%) |
| 35 to 64 Years | 7 (0.2%) | 175 (5.1%) |
| 65 to 74 Years | 82 (8.1%) | 4 (0.5%) |
| 75 Years and over | 48 (11.8%) | 82 (16.9%) |
Disability Class: Self-Care Difficulty
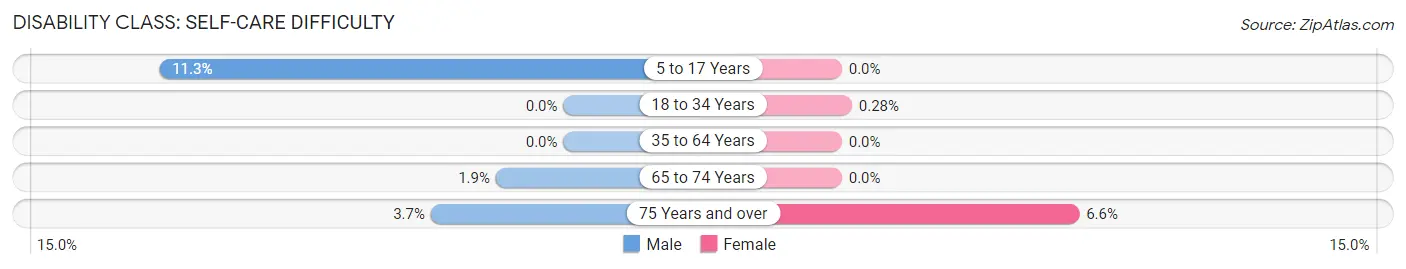
| Age Bracket | Male | Female |
| 5 to 17 Years | 109 (11.3%) | 0 (0.0%) |
| 18 to 34 Years | 0 (0.0%) | 9 (0.3%) |
| 35 to 64 Years | 0 (0.0%) | 0 (0.0%) |
| 65 to 74 Years | 19 (1.9%) | 0 (0.0%) |
| 75 Years and over | 15 (3.7%) | 32 (6.6%) |
Technology Access in Durango
Computing Device Access in Durango
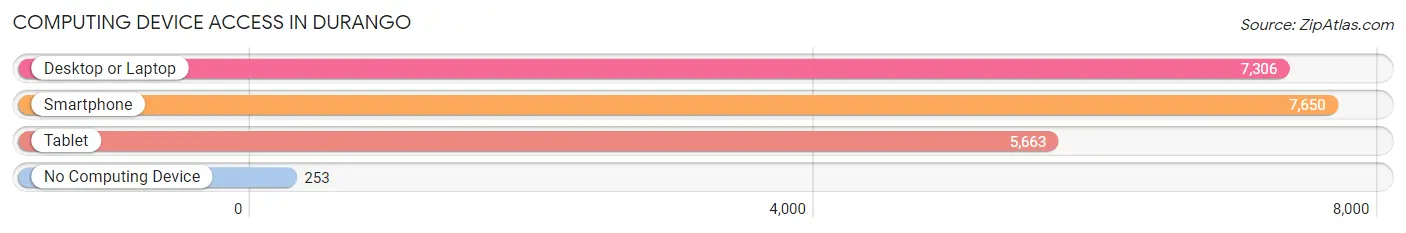
| Device Type | # Households | % Households |
| Desktop or Laptop | 7,306 | 89.8% |
| Smartphone | 7,650 | 94.0% |
| Tablet | 5,663 | 69.6% |
| No Computing Device | 253 | 3.1% |
| Total | 8,139 | 100.0% |
Internet Access in Durango
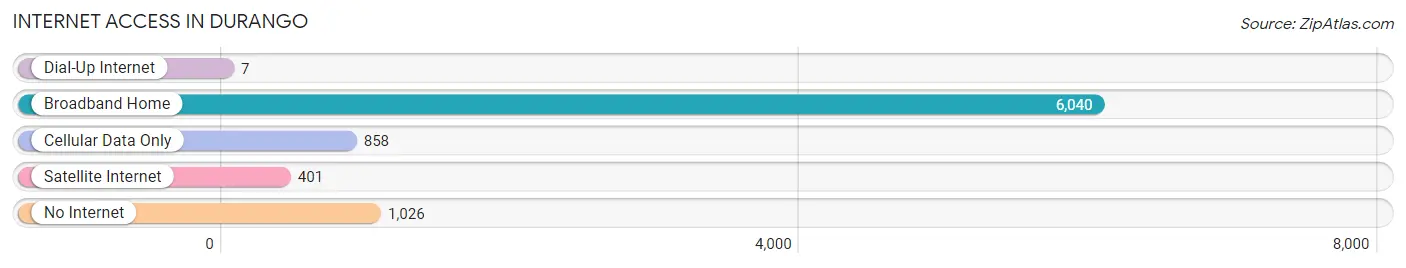
| Internet Type | # Households | % Households |
| Dial-Up Internet | 7 | 0.1% |
| Broadband Home | 6,040 | 74.2% |
| Cellular Data Only | 858 | 10.5% |
| Satellite Internet | 401 | 4.9% |
| No Internet | 1,026 | 12.6% |
| Total | 8,139 | 100.0% |
Durango Summary
Durango, Colorado is a city located in La Plata County in the southwestern part of the state. It is the county seat and the most populous city in the county. The city is situated in the Animas River Valley, surrounded by the San Juan Mountains. Durango is known for its outdoor recreation opportunities, its historic downtown, and its proximity to Mesa Verde National Park.
History
Durango was founded in 1880 by the Denver and Rio Grande Railroad. The city was named after Durango, Mexico, which was the hometown of a railroad official. The railroad was instrumental in the development of the city, as it provided transportation for goods and people. Durango quickly became a hub for the mining industry, as well as a popular tourist destination.
In the late 19th century, Durango was a major center for the mining industry, with many of the mines located in the nearby San Juan Mountains. The city was also home to several smelters, which processed ore from the mines. The city's economy was further bolstered by the arrival of the Denver and Rio Grande Western Railroad in 1881.
Geography
Durango is located in the Animas River Valley, at an elevation of 6,512 feet. The city is surrounded by the San Juan Mountains to the east and the La Plata Mountains to the west. The Animas River runs through the city, providing a source of recreation and irrigation for the area.
Durango has a semi-arid climate, with hot summers and cold winters. The average annual temperature is 52 degrees Fahrenheit, with an average high of 78 degrees in the summer and an average low of 24 degrees in the winter. The city receives an average of 16 inches of precipitation per year, with most of it falling in the summer months.
Economy
Durango's economy is largely based on tourism, with the city being a popular destination for outdoor recreation. The city is home to several ski resorts, as well as numerous hiking and biking trails. Durango is also home to several historic sites, including the Durango and Silverton Narrow Gauge Railroad, which is a popular tourist attraction.
The city is also home to several manufacturing and technology companies, including Durango Technology, which produces computer hardware and software. Durango is also home to several energy companies, including the Durango Energy Company, which produces natural gas and oil.
Demographics
As of the 2010 census, the population of Durango was 16,887. The city has a population density of 1,845 people per square mile. The median age of the population is 36.7 years, with a gender ratio of 51.2% female and 48.8% male.
The racial makeup of the city is 79.2% White, 1.2% African American, 1.3% Native American, 1.2% Asian, 0.2% Pacific Islander, 14.3% from other races, and 2.7% from two or more races. The median household income is $45,837, and the median family income is $54,837.
Durango is home to several higher education institutions, including Fort Lewis College, which is a public liberal arts college. The city is also home to several private schools, including the Durango School of Arts and Sciences.
Common Questions
What is Per Capita Income in Durango?
Per Capita income in Durango is $44,836.
What is the Median Family Income in Durango?
Median Family Income in Durango is $109,515.
What is the Median Household income in Durango?
Median Household Income in Durango is $76,177.
What is Income or Wage Gap in Durango?
Income or Wage Gap in Durango is 30.2%.
Women in Durango earn 69.8 cents for every dollar earned by a man.
What is Inequality or Gini Index in Durango?
Inequality or Gini Index in Durango is 0.46.
What is the Total Population of Durango?
Total Population of Durango is 19,148.
What is the Total Male Population of Durango?
Total Male Population of Durango is 9,803.
What is the Total Female Population of Durango?
Total Female Population of Durango is 9,345.
What is the Ratio of Males per 100 Females in Durango?
There are 104.90 Males per 100 Females in Durango.
What is the Ratio of Females per 100 Males in Durango?
There are 95.33 Females per 100 Males in Durango.
What is the Median Population Age in Durango?
Median Population Age in Durango is 36.6 Years.
What is the Average Family Size in Durango
Average Family Size in Durango is 2.7 People.
What is the Average Household Size in Durango
Average Household Size in Durango is 2.1 People.
How Large is the Labor Force in Durango?
There are 11,268 People in the Labor Forcein in Durango.
What is the Percentage of People in the Labor Force in Durango?
67.5% of People are in the Labor Force in Durango.
What is the Unemployment Rate in Durango?
Unemployment Rate in Durango is 2.3%.