Brighton, CO Map & Demographics
Brighton Map
Brighton Overview
$37,177
PER CAPITA INCOME
$101,669
AVG FAMILY INCOME
$86,975
AVG HOUSEHOLD INCOME
22.5%
WAGE / INCOME GAP [ % ]
77.5¢/ $1
WAGE / INCOME GAP [ $ ]
$10,735
FAMILY INCOME DEFICIT
0.43
INEQUALITY / GINI INDEX
40,569
TOTAL POPULATION
20,855
MALE POPULATION
19,714
FEMALE POPULATION
105.79
MALES / 100 FEMALES
94.53
FEMALES / 100 MALES
34.5
MEDIAN AGE
3.5
AVG FAMILY SIZE
3.0
AVG HOUSEHOLD SIZE
21,682
LABOR FORCE [ PEOPLE ]
70.7%
PERCENT IN LABOR FORCE
5.1%
UNEMPLOYMENT RATE
Income in Brighton
Income Overview in Brighton
Per Capita Income in Brighton is $37,177, while median incomes of families and households are $101,669 and $86,975 respectively.
| Characteristic | Number | Measure |
| Per Capita Income | 40,569 | $37,177 |
| Median Family Income | 9,617 | $101,669 |
| Mean Family Income | 9,617 | $126,347 |
| Median Household Income | 13,221 | $86,975 |
| Mean Household Income | 13,221 | $111,540 |
| Income Deficit | 9,617 | $10,735 |
| Wage / Income Gap (%) | 40,569 | 22.52% |
| Wage / Income Gap ($) | 40,569 | 77.48¢ per $1 |
| Gini / Inequality Index | 40,569 | 0.43 |
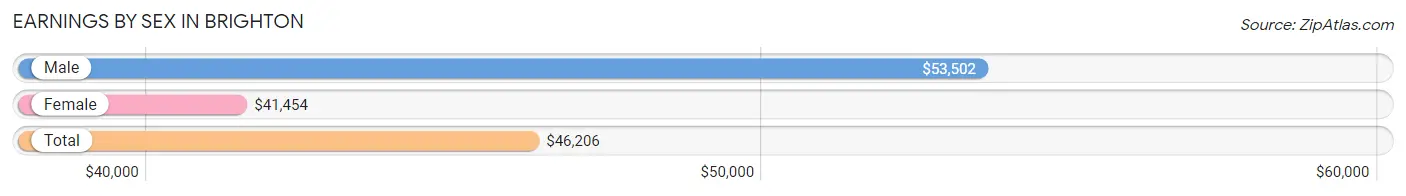
Earnings by Sex in Brighton
Average Earnings in Brighton are $46,206, $53,502 for men and $41,454 for women, a difference of 22.5%.
| Sex | Number | Average Earnings |
| Male | 12,443 (55.6%) | $53,502 |
| Female | 9,937 (44.4%) | $41,454 |
| Total | 22,380 (100.0%) | $46,206 |
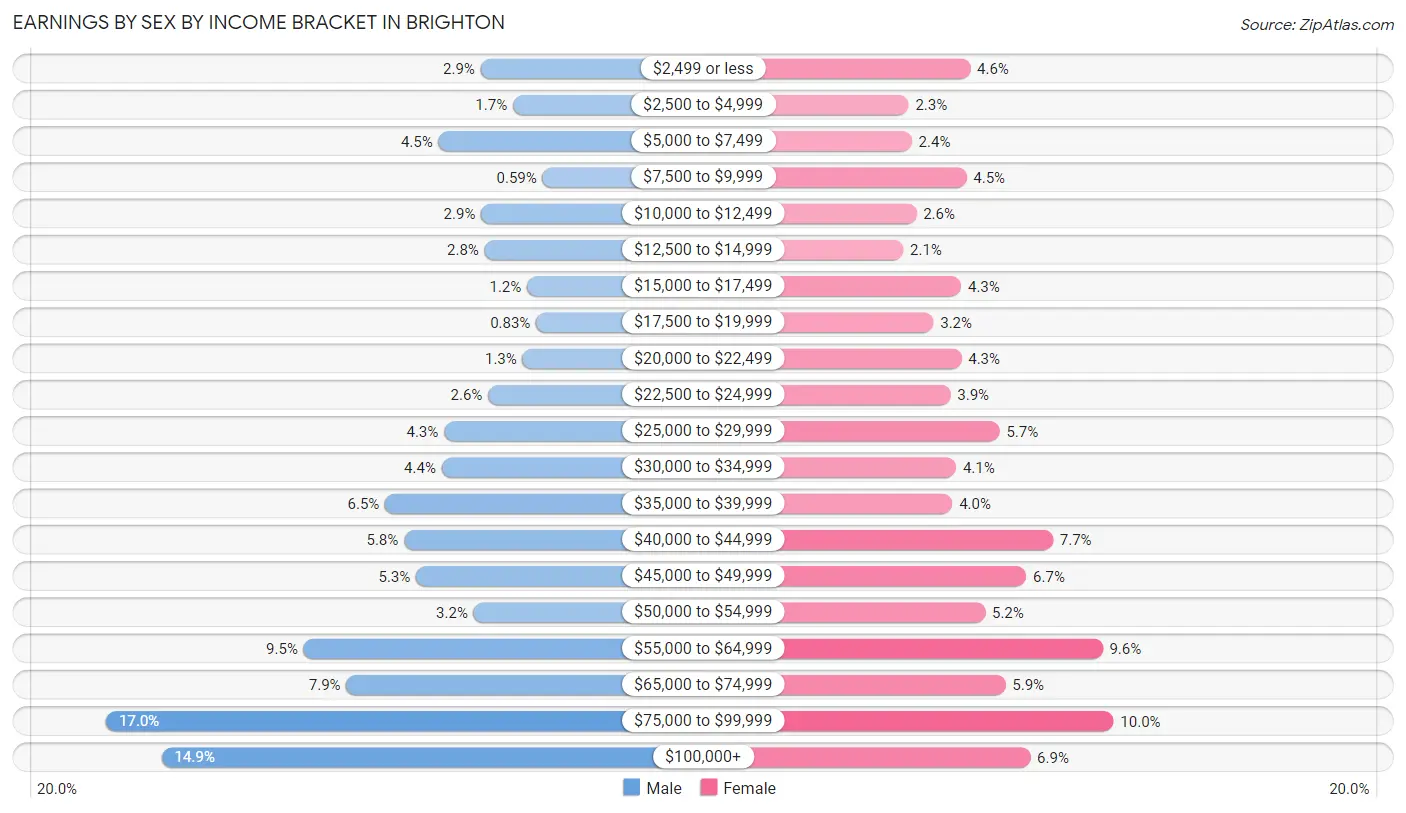
Earnings by Sex by Income Bracket in Brighton
The most common earnings brackets in Brighton are $75,000 to $99,999 for men (2,109 | 17.0%) and $75,000 to $99,999 for women (993 | 10.0%).
| Income | Male | Female |
| $2,499 or less | 362 (2.9%) | 459 (4.6%) |
| $2,500 to $4,999 | 211 (1.7%) | 230 (2.3%) |
| $5,000 to $7,499 | 559 (4.5%) | 241 (2.4%) |
| $7,500 to $9,999 | 73 (0.6%) | 445 (4.5%) |
| $10,000 to $12,499 | 359 (2.9%) | 258 (2.6%) |
| $12,500 to $14,999 | 344 (2.8%) | 210 (2.1%) |
| $15,000 to $17,499 | 145 (1.2%) | 425 (4.3%) |
| $17,500 to $19,999 | 103 (0.8%) | 322 (3.2%) |
| $20,000 to $22,499 | 167 (1.3%) | 426 (4.3%) |
| $22,500 to $24,999 | 327 (2.6%) | 386 (3.9%) |
| $25,000 to $29,999 | 532 (4.3%) | 568 (5.7%) |
| $30,000 to $34,999 | 544 (4.4%) | 406 (4.1%) |
| $35,000 to $39,999 | 807 (6.5%) | 393 (4.0%) |
| $40,000 to $44,999 | 719 (5.8%) | 767 (7.7%) |
| $45,000 to $49,999 | 663 (5.3%) | 668 (6.7%) |
| $50,000 to $54,999 | 394 (3.2%) | 515 (5.2%) |
| $55,000 to $64,999 | 1,187 (9.5%) | 952 (9.6%) |
| $65,000 to $74,999 | 988 (7.9%) | 590 (5.9%) |
| $75,000 to $99,999 | 2,109 (17.0%) | 993 (10.0%) |
| $100,000+ | 1,850 (14.9%) | 683 (6.9%) |
| Total | 12,443 (100.0%) | 9,937 (100.0%) |
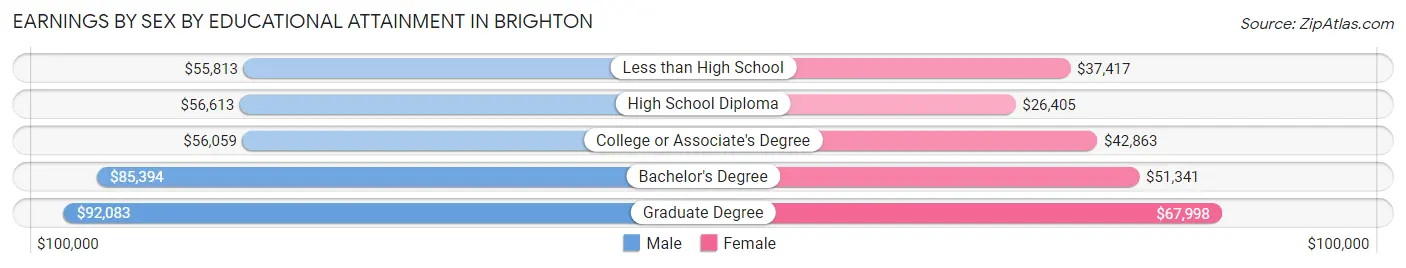
Earnings by Sex by Educational Attainment in Brighton
Average earnings in Brighton are $61,278 for men and $44,643 for women, a difference of 27.2%. Men with an educational attainment of graduate degree enjoy the highest average annual earnings of $92,083, while those with less than high school education earn the least with $55,813. Women with an educational attainment of graduate degree earn the most with the average annual earnings of $67,998, while those with high school diploma education have the smallest earnings of $26,405.
| Educational Attainment | Male Income | Female Income |
| Less than High School | $55,813 | $37,417 |
| High School Diploma | $56,613 | $26,405 |
| College or Associate's Degree | $56,059 | $42,863 |
| Bachelor's Degree | $85,394 | $51,341 |
| Graduate Degree | $92,083 | $67,998 |
| Total | $61,278 | $44,643 |
Family Income in Brighton
Family Income Brackets in Brighton
According to the Brighton family income data, there are 2,308 families falling into the $100,000 to $149,999 income range, which is the most common income bracket and makes up 24.0% of all families. Conversely, the $10,000 to $14,999 income bracket is the least frequent group with only 38 families (0.4%) belonging to this category.
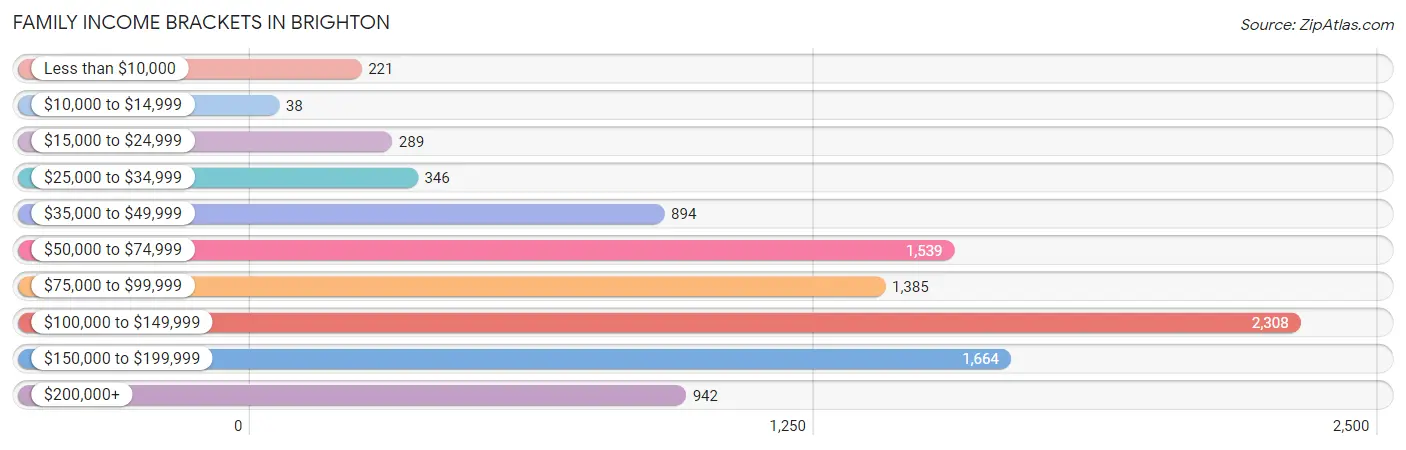
| Income Bracket | # Families | % Families |
| Less than $10,000 | 221 | 2.3% |
| $10,000 to $14,999 | 38 | 0.4% |
| $15,000 to $24,999 | 289 | 3.0% |
| $25,000 to $34,999 | 346 | 3.6% |
| $35,000 to $49,999 | 894 | 9.3% |
| $50,000 to $74,999 | 1,539 | 16.0% |
| $75,000 to $99,999 | 1,385 | 14.4% |
| $100,000 to $149,999 | 2,308 | 24.0% |
| $150,000 to $199,999 | 1,664 | 17.3% |
| $200,000+ | 942 | 9.8% |
Family Income by Famaliy Size in Brighton
7+ person families (289 | 3.0%) account for the highest median family income in Brighton with $137,435 per family, while 2-person families (3,478 | 36.2%) have the highest median income of $42,866 per family member.
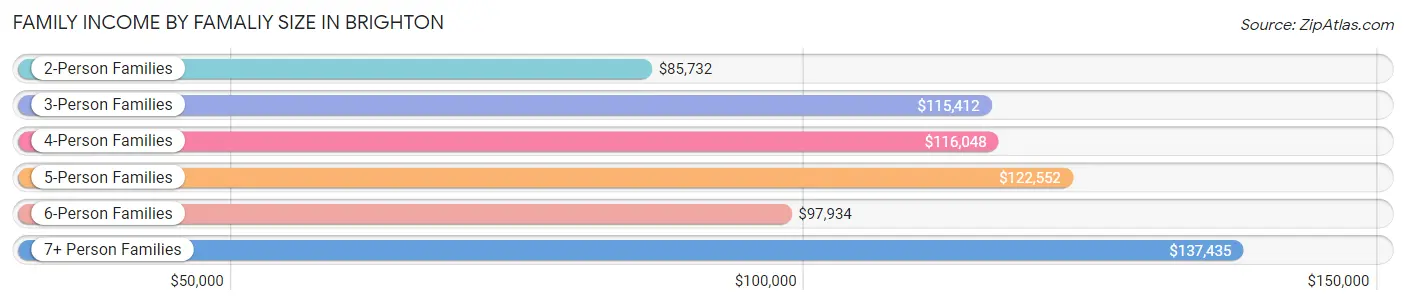
| Income Bracket | # Families | Median Income |
| 2-Person Families | 3,478 (36.2%) | $85,732 |
| 3-Person Families | 2,025 (21.1%) | $115,412 |
| 4-Person Families | 2,291 (23.8%) | $116,048 |
| 5-Person Families | 1,157 (12.0%) | $122,552 |
| 6-Person Families | 377 (3.9%) | $97,934 |
| 7+ Person Families | 289 (3.0%) | $137,435 |
| Total | 9,617 (100.0%) | $101,669 |
Family Income by Number of Earners in Brighton
The median family income in Brighton is $101,669, with families comprising 3+ earners (1,795) having the highest median family income of $162,792, while families with 1 earner (2,846) have the lowest median family income of $51,754, accounting for 18.7% and 29.6% of families, respectively.
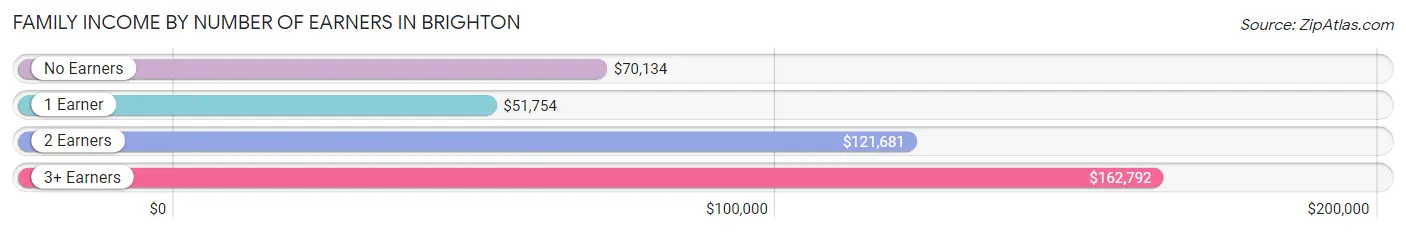
| Number of Earners | # Families | Median Income |
| No Earners | 559 (5.8%) | $70,134 |
| 1 Earner | 2,846 (29.6%) | $51,754 |
| 2 Earners | 4,417 (45.9%) | $121,681 |
| 3+ Earners | 1,795 (18.7%) | $162,792 |
| Total | 9,617 (100.0%) | $101,669 |
Household Income in Brighton
Household Income Brackets in Brighton
With 2,737 households falling in the category, the $100,000 to $149,999 income range is the most frequent in Brighton, accounting for 20.7% of all households. In contrast, only 357 households (2.7%) fall into the less than $10,000 income bracket, making it the least populous group.
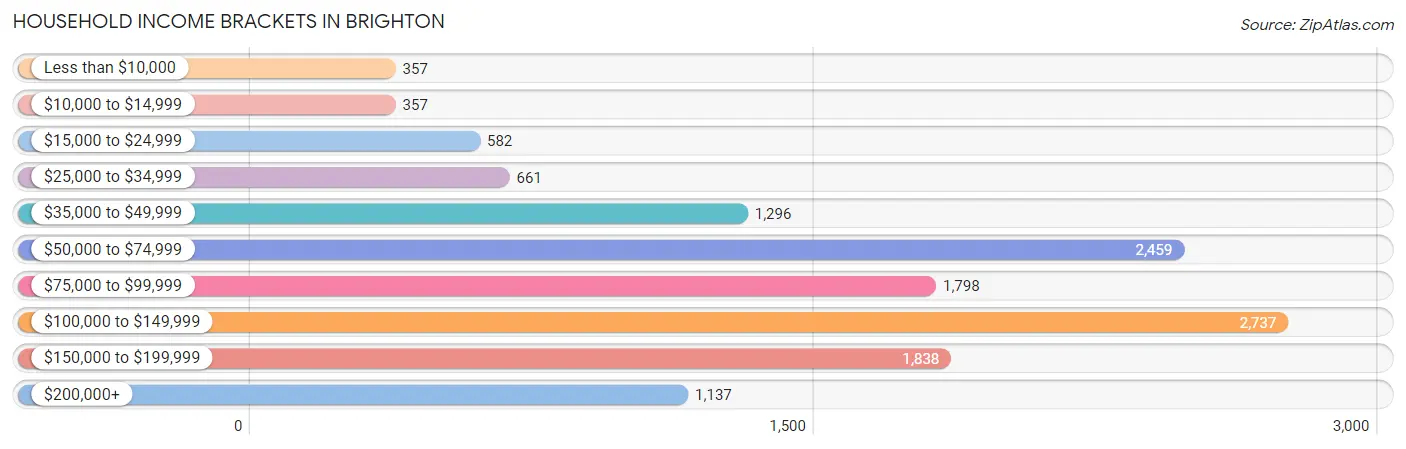
| Income Bracket | # Households | % Households |
| Less than $10,000 | 357 | 2.7% |
| $10,000 to $14,999 | 357 | 2.7% |
| $15,000 to $24,999 | 582 | 4.4% |
| $25,000 to $34,999 | 661 | 5.0% |
| $35,000 to $49,999 | 1,296 | 9.8% |
| $50,000 to $74,999 | 2,459 | 18.6% |
| $75,000 to $99,999 | 1,798 | 13.6% |
| $100,000 to $149,999 | 2,737 | 20.7% |
| $150,000 to $199,999 | 1,838 | 13.9% |
| $200,000+ | 1,137 | 8.6% |
Household Income by Householder Age in Brighton
The median household income in Brighton is $86,975, with the highest median household income of $95,931 found in the 45 to 64 years age bracket for the primary householder. A total of 5,402 households (40.9%) fall into this category. Meanwhile, the 15 to 24 years age bracket for the primary householder has the lowest median household income of $0, with 403 households (3.0%) in this group.
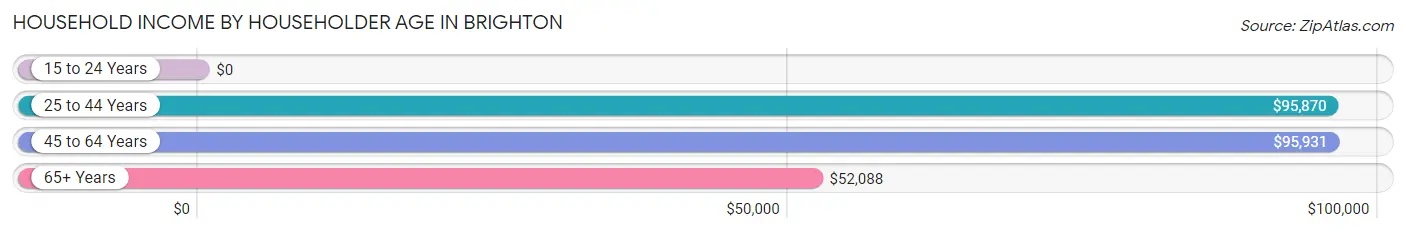
| Income Bracket | # Households | Median Income |
| 15 to 24 Years | 403 (3.0%) | $0 |
| 25 to 44 Years | 5,176 (39.2%) | $95,870 |
| 45 to 64 Years | 5,402 (40.9%) | $95,931 |
| 65+ Years | 2,240 (16.9%) | $52,088 |
| Total | 13,221 (100.0%) | $86,975 |
Poverty in Brighton
Income Below Poverty by Sex and Age in Brighton
With 6.7% poverty level for males and 11.7% for females among the residents of Brighton, 16 and 17 year old males and 12 to 14 year old females are the most vulnerable to poverty, with 180 males (24.1%) and 309 females (30.1%) in their respective age groups living below the poverty level.
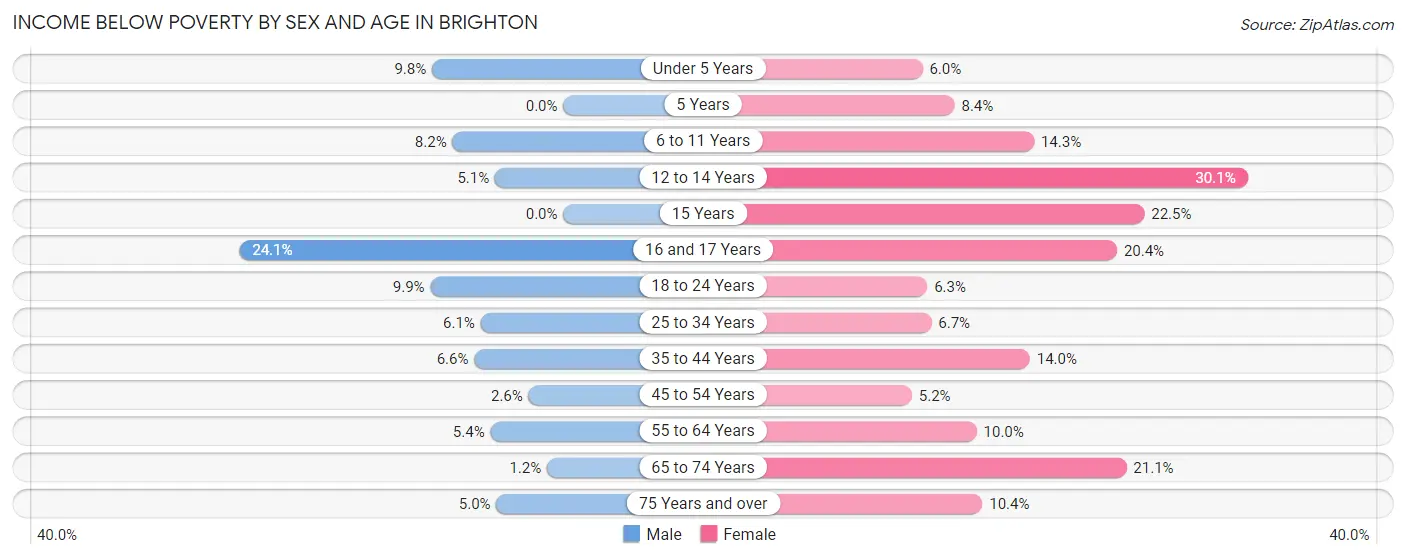
| Age Bracket | Male | Female |
| Under 5 Years | 147 (9.8%) | 64 (6.0%) |
| 5 Years | 0 (0.0%) | 21 (8.4%) |
| 6 to 11 Years | 187 (8.2%) | 270 (14.3%) |
| 12 to 14 Years | 41 (5.1%) | 309 (30.1%) |
| 15 Years | 0 (0.0%) | 64 (22.5%) |
| 16 and 17 Years | 180 (24.1%) | 114 (20.4%) |
| 18 to 24 Years | 159 (9.9%) | 78 (6.3%) |
| 25 to 34 Years | 186 (6.1%) | 197 (6.7%) |
| 35 to 44 Years | 208 (6.6%) | 354 (14.0%) |
| 45 to 54 Years | 64 (2.6%) | 139 (5.2%) |
| 55 to 64 Years | 124 (5.4%) | 239 (10.0%) |
| 65 to 74 Years | 11 (1.2%) | 307 (21.1%) |
| 75 Years and over | 28 (5.0%) | 101 (10.4%) |
| Total | 1,335 (6.7%) | 2,257 (11.7%) |
Income Above Poverty by Sex and Age in Brighton
According to the poverty statistics in Brighton, males aged 5 years and females aged 45 to 54 years are the age groups that are most secure financially, with 100.0% of males and 94.8% of females in these age groups living above the poverty line.
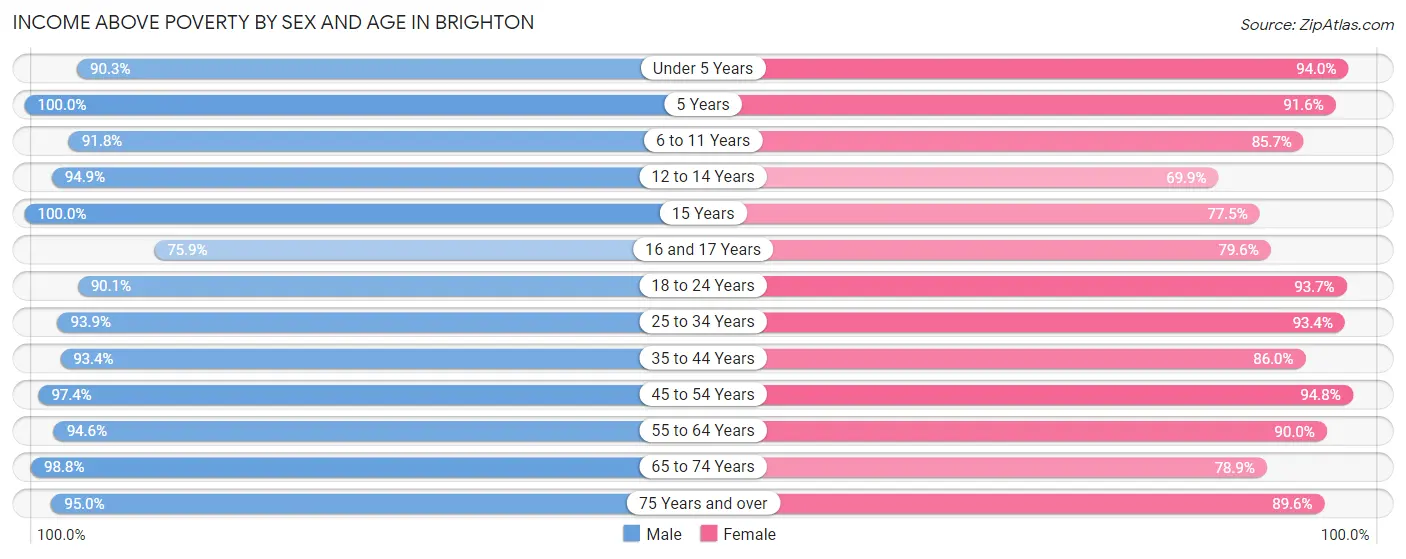
| Age Bracket | Male | Female |
| Under 5 Years | 1,360 (90.2%) | 1,004 (94.0%) |
| 5 Years | 307 (100.0%) | 230 (91.6%) |
| 6 to 11 Years | 2,084 (91.8%) | 1,622 (85.7%) |
| 12 to 14 Years | 767 (94.9%) | 717 (69.9%) |
| 15 Years | 341 (100.0%) | 221 (77.5%) |
| 16 and 17 Years | 568 (75.9%) | 444 (79.6%) |
| 18 to 24 Years | 1,452 (90.1%) | 1,153 (93.7%) |
| 25 to 34 Years | 2,845 (93.9%) | 2,766 (93.3%) |
| 35 to 44 Years | 2,937 (93.4%) | 2,181 (86.0%) |
| 45 to 54 Years | 2,412 (97.4%) | 2,535 (94.8%) |
| 55 to 64 Years | 2,168 (94.6%) | 2,148 (90.0%) |
| 65 to 74 Years | 897 (98.8%) | 1,146 (78.9%) |
| 75 Years and over | 535 (95.0%) | 867 (89.6%) |
| Total | 18,673 (93.3%) | 17,034 (88.3%) |
Income Below Poverty Among Married-Couple Families in Brighton
The poverty statistics for married-couple families in Brighton show that 2.5% or 190 of the total 7,529 families live below the poverty line. Families with 3 or 4 children have the highest poverty rate of 9.8%, comprising of 78 families. On the other hand, families with 5 or more children have the lowest poverty rate of 0.0%, which includes 0 families.
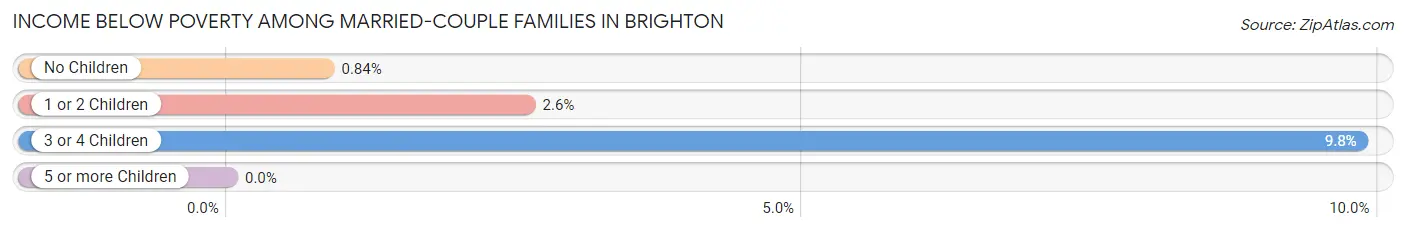
| Children | Above Poverty | Below Poverty |
| No Children | 3,527 (99.2%) | 30 (0.8%) |
| 1 or 2 Children | 3,078 (97.4%) | 82 (2.6%) |
| 3 or 4 Children | 715 (90.2%) | 78 (9.8%) |
| 5 or more Children | 19 (100.0%) | 0 (0.0%) |
| Total | 7,339 (97.5%) | 190 (2.5%) |
Income Below Poverty Among Single-Parent Households in Brighton
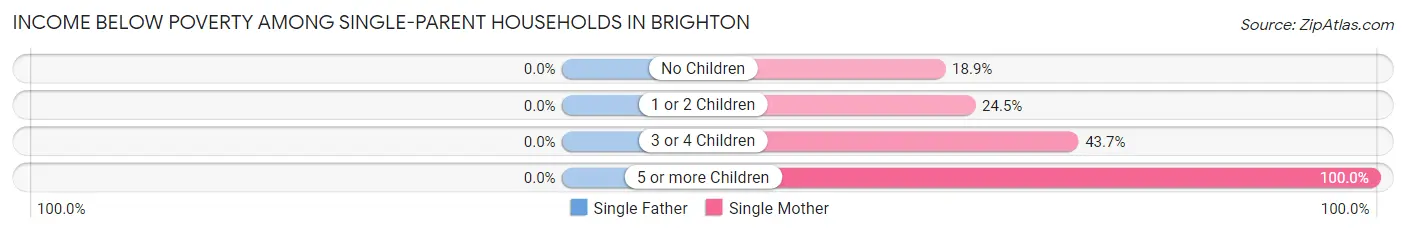
| Children | Single Father | Single Mother |
| No Children | 0 (0.0%) | 79 (18.9%) |
| 1 or 2 Children | 0 (0.0%) | 229 (24.5%) |
| 3 or 4 Children | 0 (0.0%) | 90 (43.7%) |
| 5 or more Children | 0 (0.0%) | 19 (100.0%) |
| Total | 0 (0.0%) | 417 (26.4%) |
Income Below Poverty Among Married-Couple vs Single-Parent Households in Brighton
The poverty data for Brighton shows that 190 of the married-couple family households (2.5%) and 417 of the single-parent households (20.0%) are living below the poverty level. Within the married-couple family households, those with 3 or 4 children have the highest poverty rate, with 78 households (9.8%) falling below the poverty line. Among the single-parent households, those with 5 or more children have the highest poverty rate, with 19 household (100.0%) living below poverty.
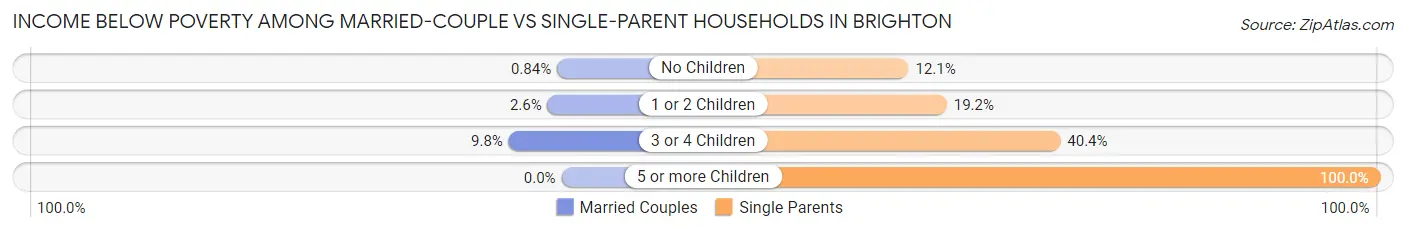
| Children | Married-Couple Families | Single-Parent Households |
| No Children | 30 (0.8%) | 79 (12.1%) |
| 1 or 2 Children | 82 (2.6%) | 229 (19.2%) |
| 3 or 4 Children | 78 (9.8%) | 90 (40.4%) |
| 5 or more Children | 0 (0.0%) | 19 (100.0%) |
| Total | 190 (2.5%) | 417 (20.0%) |
Race in Brighton
The most populous races in Brighton are White / Caucasian (27,670 | 68.2%), Hispanic or Latino (15,674 | 38.6%), and Two or more Races (5,911 | 14.6%).
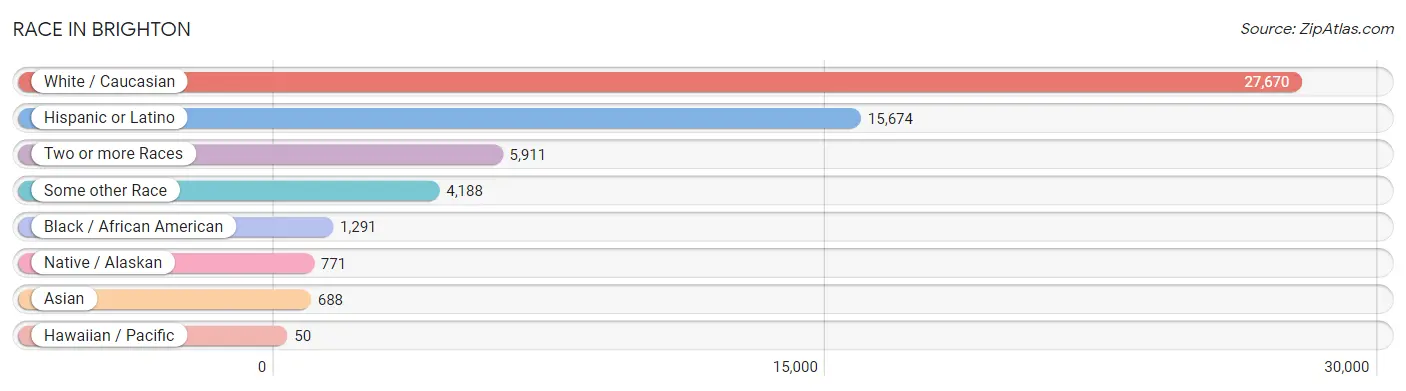
| Race | # Population | % Population |
| Asian | 688 | 1.7% |
| Black / African American | 1,291 | 3.2% |
| Hawaiian / Pacific | 50 | 0.1% |
| Hispanic or Latino | 15,674 | 38.6% |
| Native / Alaskan | 771 | 1.9% |
| White / Caucasian | 27,670 | 68.2% |
| Two or more Races | 5,911 | 14.6% |
| Some other Race | 4,188 | 10.3% |
| Total | 40,569 | 100.0% |
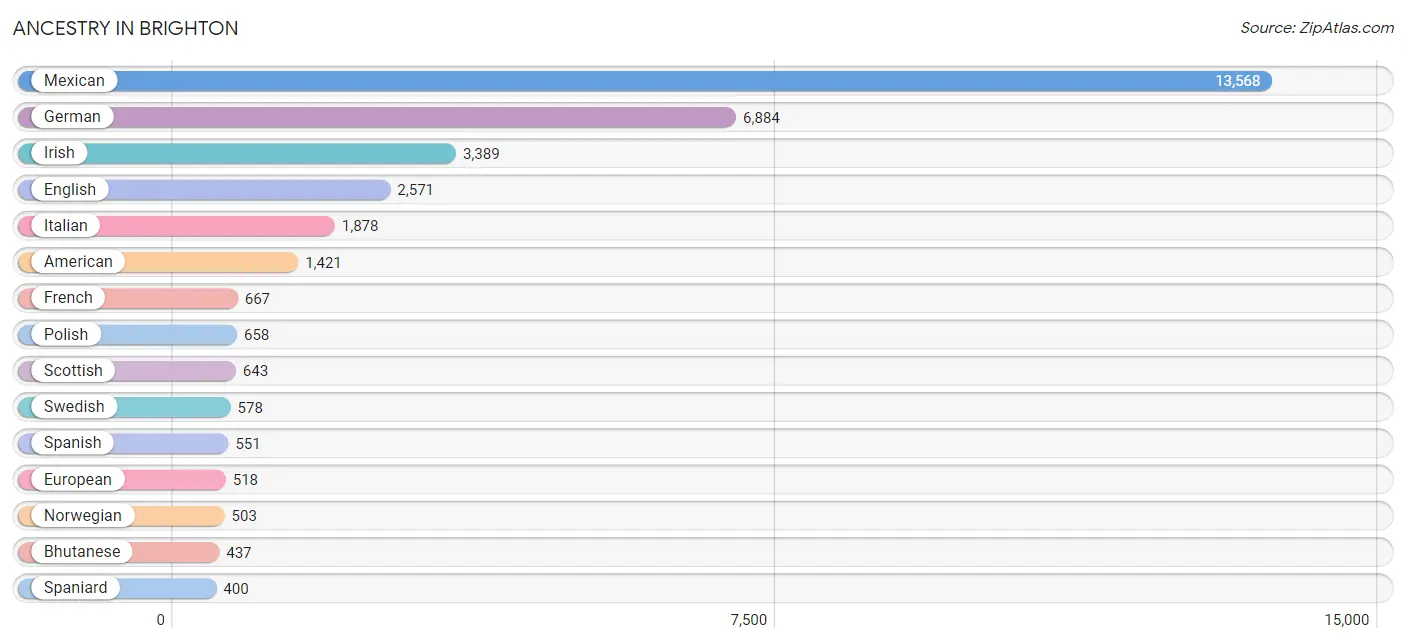
Ancestry in Brighton
The most populous ancestries reported in Brighton are Mexican (13,568 | 33.4%), German (6,884 | 17.0%), Irish (3,389 | 8.4%), English (2,571 | 6.3%), and Italian (1,878 | 4.6%), together accounting for 69.7% of all Brighton residents.
| Ancestry | # Population | % Population |
| Aleut | 36 | 0.1% |
| American | 1,421 | 3.5% |
| Apache | 128 | 0.3% |
| Arab | 29 | 0.1% |
| Armenian | 109 | 0.3% |
| Australian | 4 | 0.0% |
| Austrian | 56 | 0.1% |
| Bangladeshi | 143 | 0.4% |
| Belgian | 104 | 0.3% |
| Bhutanese | 437 | 1.1% |
| Blackfeet | 18 | 0.0% |
| Brazilian | 25 | 0.1% |
| British | 104 | 0.3% |
| Bulgarian | 36 | 0.1% |
| Burmese | 42 | 0.1% |
| Canadian | 93 | 0.2% |
| Central American | 86 | 0.2% |
| Central American Indian | 19 | 0.1% |
| Cherokee | 278 | 0.7% |
| Colombian | 47 | 0.1% |
| Croatian | 16 | 0.0% |
| Czech | 88 | 0.2% |
| Czechoslovakian | 56 | 0.1% |
| Danish | 204 | 0.5% |
| Dutch | 268 | 0.7% |
| Eastern European | 150 | 0.4% |
| English | 2,571 | 6.3% |
| European | 518 | 1.3% |
| Finnish | 49 | 0.1% |
| French | 667 | 1.6% |
| French Canadian | 221 | 0.5% |
| German | 6,884 | 17.0% |
| German Russian | 4 | 0.0% |
| Greek | 2 | 0.0% |
| Guamanian / Chamorro | 13 | 0.0% |
| Guatemalan | 16 | 0.0% |
| Honduran | 36 | 0.1% |
| Hungarian | 131 | 0.3% |
| Indian (Asian) | 158 | 0.4% |
| Indonesian | 60 | 0.2% |
| Inupiat | 51 | 0.1% |
| Irish | 3,389 | 8.4% |
| Italian | 1,878 | 4.6% |
| Jamaican | 2 | 0.0% |
| Japanese | 51 | 0.1% |
| Korean | 208 | 0.5% |
| Lithuanian | 59 | 0.2% |
| Mexican | 13,568 | 33.4% |
| Mexican American Indian | 112 | 0.3% |
| Native Hawaiian | 60 | 0.2% |
| Navajo | 197 | 0.5% |
| Nigerian | 17 | 0.0% |
| Northern European | 143 | 0.4% |
| Norwegian | 503 | 1.2% |
| Osage | 30 | 0.1% |
| Polish | 658 | 1.6% |
| Portuguese | 76 | 0.2% |
| Puerto Rican | 224 | 0.5% |
| Romanian | 4 | 0.0% |
| Russian | 189 | 0.5% |
| Salvadoran | 34 | 0.1% |
| Samoan | 39 | 0.1% |
| Scandinavian | 100 | 0.3% |
| Scotch-Irish | 144 | 0.4% |
| Scottish | 643 | 1.6% |
| Sioux | 51 | 0.1% |
| Slovak | 35 | 0.1% |
| South African | 10 | 0.0% |
| South American | 47 | 0.1% |
| Spaniard | 400 | 1.0% |
| Spanish | 551 | 1.4% |
| Spanish American | 4 | 0.0% |
| Sri Lankan | 98 | 0.2% |
| Subsaharan African | 145 | 0.4% |
| Swedish | 578 | 1.4% |
| Swiss | 178 | 0.4% |
| Thai | 110 | 0.3% |
| Trinidadian and Tobagonian | 21 | 0.1% |
| Welsh | 218 | 0.5% |
| Yaqui | 43 | 0.1% |
| Yugoslavian | 24 | 0.1% | View All 81 Rows |
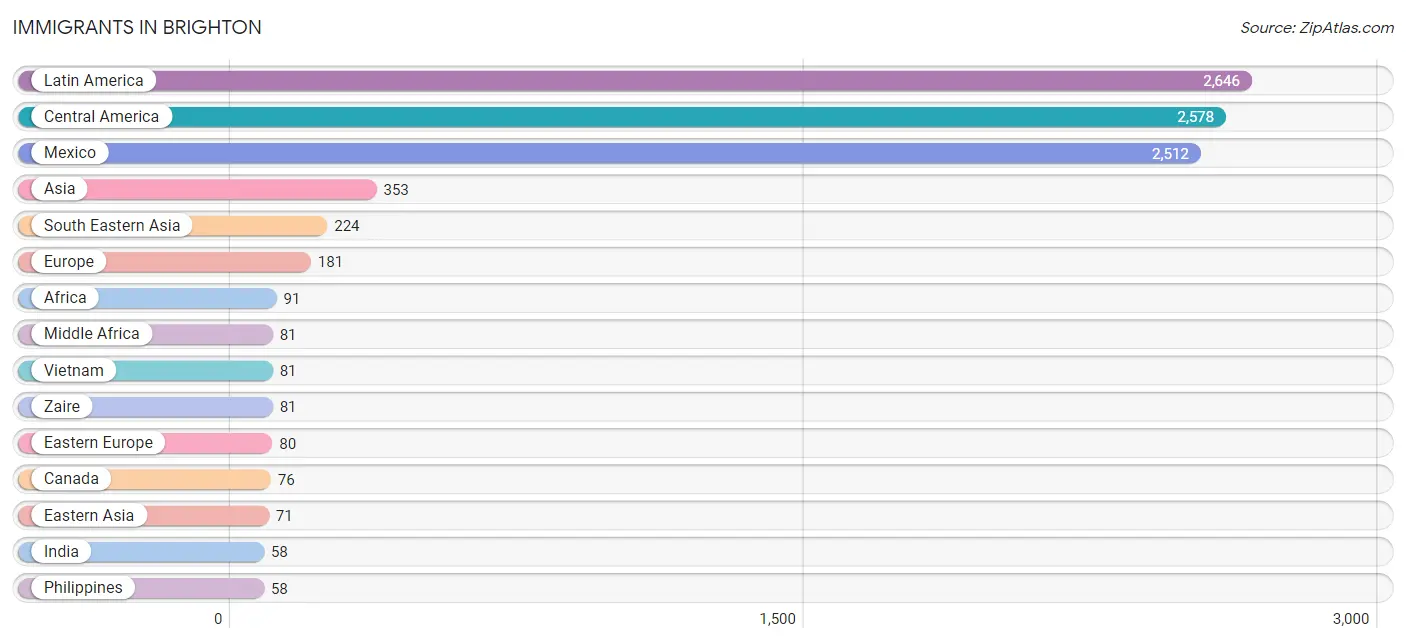
Immigrants in Brighton
The most numerous immigrant groups reported in Brighton came from Latin America (2,646 | 6.5%), Central America (2,578 | 6.4%), Mexico (2,512 | 6.2%), Asia (353 | 0.9%), and South Eastern Asia (224 | 0.5%), together accounting for 20.5% of all Brighton residents.
| Immigration Origin | # Population | % Population |
| Africa | 91 | 0.2% |
| Asia | 353 | 0.9% |
| Australia | 4 | 0.0% |
| Belize | 19 | 0.1% |
| Brazil | 25 | 0.1% |
| Bulgaria | 28 | 0.1% |
| Cambodia | 28 | 0.1% |
| Canada | 76 | 0.2% |
| Caribbean | 26 | 0.1% |
| Central America | 2,578 | 6.4% |
| China | 51 | 0.1% |
| Colombia | 8 | 0.0% |
| Cuba | 26 | 0.1% |
| Czechoslovakia | 21 | 0.1% |
| Denmark | 13 | 0.0% |
| Eastern Asia | 71 | 0.2% |
| Eastern Europe | 80 | 0.2% |
| England | 15 | 0.0% |
| Europe | 181 | 0.4% |
| Germany | 37 | 0.1% |
| Honduras | 36 | 0.1% |
| India | 58 | 0.1% |
| Japan | 20 | 0.1% |
| Latin America | 2,646 | 6.5% |
| Malaysia | 15 | 0.0% |
| Mexico | 2,512 | 6.2% |
| Middle Africa | 81 | 0.2% |
| Netherlands | 17 | 0.0% |
| Northern Europe | 47 | 0.1% |
| Oceania | 4 | 0.0% |
| Panama | 11 | 0.0% |
| Philippines | 58 | 0.1% |
| Russia | 31 | 0.1% |
| South Africa | 10 | 0.0% |
| South America | 42 | 0.1% |
| South Central Asia | 58 | 0.1% |
| South Eastern Asia | 224 | 0.5% |
| Sweden | 5 | 0.0% |
| Taiwan | 51 | 0.1% |
| Venezuela | 9 | 0.0% |
| Vietnam | 81 | 0.2% |
| Western Europe | 54 | 0.1% |
| Zaire | 81 | 0.2% | View All 43 Rows |
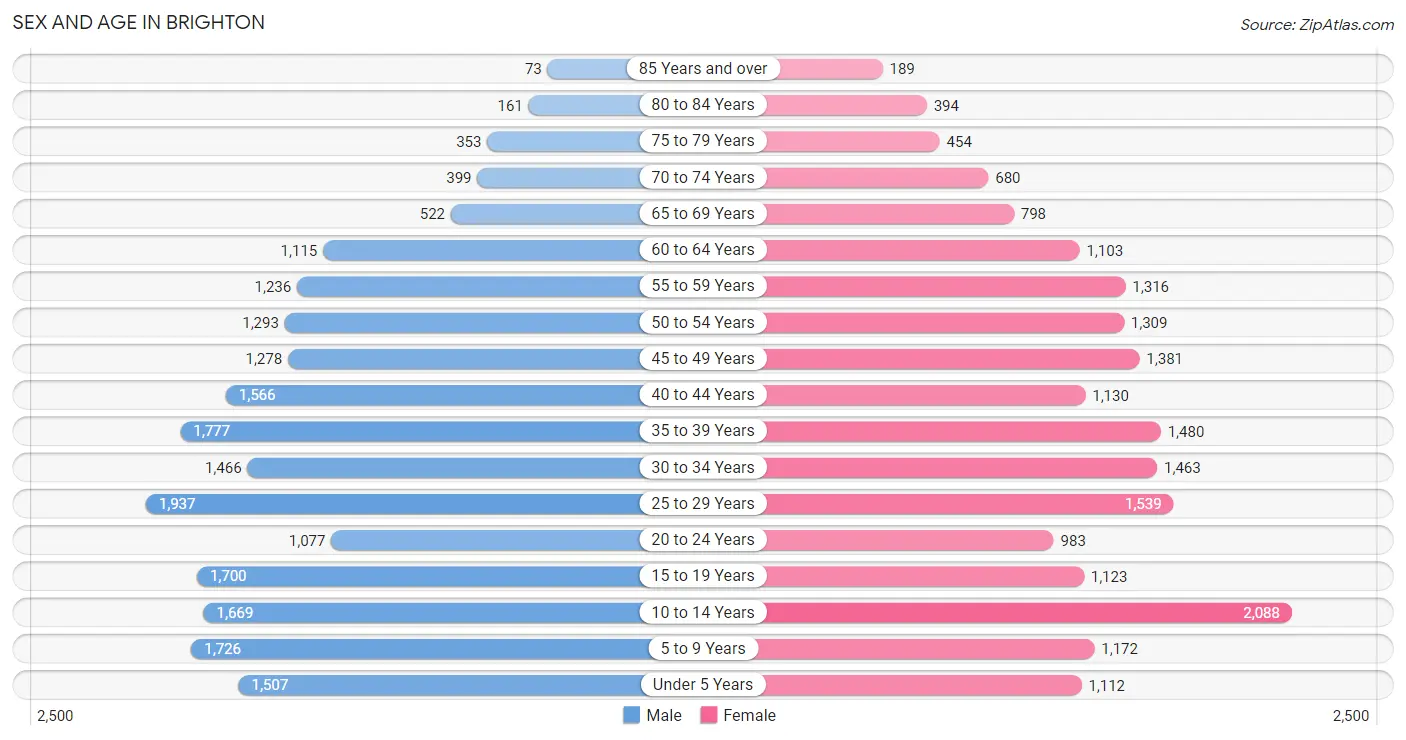
Sex and Age in Brighton
Sex and Age in Brighton
The most populous age groups in Brighton are 25 to 29 Years (1,937 | 9.3%) for men and 10 to 14 Years (2,088 | 10.6%) for women.
| Age Bracket | Male | Female |
| Under 5 Years | 1,507 (7.2%) | 1,112 (5.6%) |
| 5 to 9 Years | 1,726 (8.3%) | 1,172 (5.9%) |
| 10 to 14 Years | 1,669 (8.0%) | 2,088 (10.6%) |
| 15 to 19 Years | 1,700 (8.2%) | 1,123 (5.7%) |
| 20 to 24 Years | 1,077 (5.2%) | 983 (5.0%) |
| 25 to 29 Years | 1,937 (9.3%) | 1,539 (7.8%) |
| 30 to 34 Years | 1,466 (7.0%) | 1,463 (7.4%) |
| 35 to 39 Years | 1,777 (8.5%) | 1,480 (7.5%) |
| 40 to 44 Years | 1,566 (7.5%) | 1,130 (5.7%) |
| 45 to 49 Years | 1,278 (6.1%) | 1,381 (7.0%) |
| 50 to 54 Years | 1,293 (6.2%) | 1,309 (6.6%) |
| 55 to 59 Years | 1,236 (5.9%) | 1,316 (6.7%) |
| 60 to 64 Years | 1,115 (5.3%) | 1,103 (5.6%) |
| 65 to 69 Years | 522 (2.5%) | 798 (4.1%) |
| 70 to 74 Years | 399 (1.9%) | 680 (3.5%) |
| 75 to 79 Years | 353 (1.7%) | 454 (2.3%) |
| 80 to 84 Years | 161 (0.8%) | 394 (2.0%) |
| 85 Years and over | 73 (0.4%) | 189 (1.0%) |
| Total | 20,855 (100.0%) | 19,714 (100.0%) |
Families and Households in Brighton
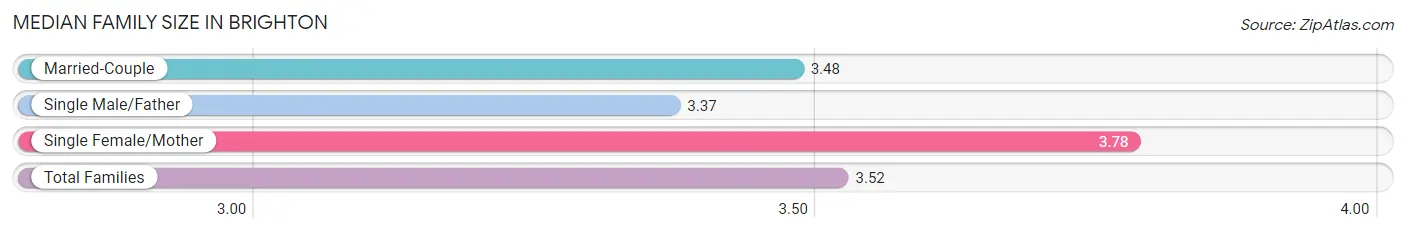
Median Family Size in Brighton
The median family size in Brighton is 3.52 persons per family, with single female/mother families (1,578 | 16.4%) accounting for the largest median family size of 3.78 persons per family. On the other hand, single male/father families (510 | 5.3%) represent the smallest median family size with 3.37 persons per family.
| Family Type | # Families | Family Size |
| Married-Couple | 7,529 (78.3%) | 3.48 |
| Single Male/Father | 510 (5.3%) | 3.37 |
| Single Female/Mother | 1,578 (16.4%) | 3.78 |
| Total Families | 9,617 (100.0%) | 3.52 |
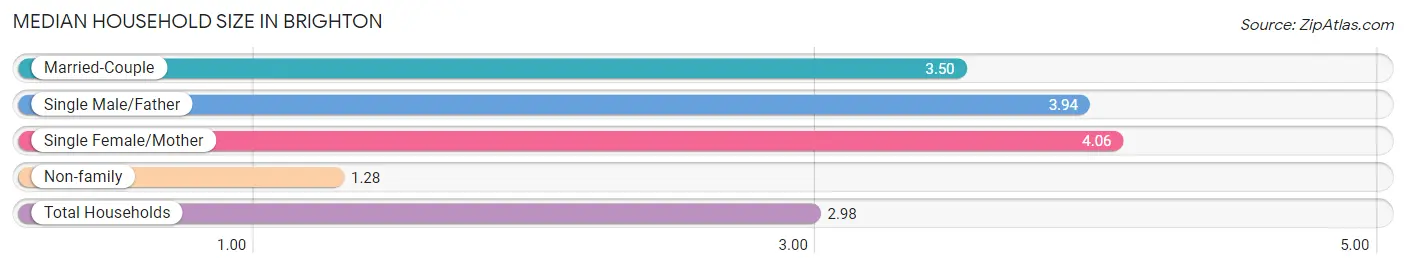
Median Household Size in Brighton
The median household size in Brighton is 2.98 persons per household, with single female/mother households (1,578 | 11.9%) accounting for the largest median household size of 4.06 persons per household. non-family households (3,604 | 27.3%) represent the smallest median household size with 1.28 persons per household.
| Household Type | # Households | Household Size |
| Married-Couple | 7,529 (57.0%) | 3.50 |
| Single Male/Father | 510 (3.9%) | 3.94 |
| Single Female/Mother | 1,578 (11.9%) | 4.06 |
| Non-family | 3,604 (27.3%) | 1.28 |
| Total Households | 13,221 (100.0%) | 2.98 |
Household Size by Marriage Status in Brighton
Out of a total of 13,221 households in Brighton, 9,617 (72.7%) are family households, while 3,604 (27.3%) are nonfamily households. The most numerous type of family households are 2-person households, comprising 3,101, and the most common type of nonfamily households are 1-person households, comprising 2,909.
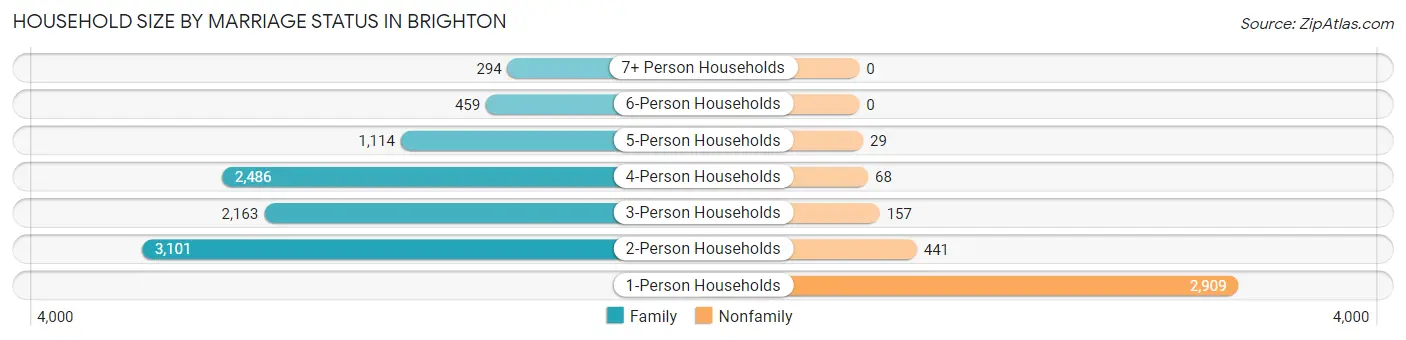
| Household Size | Family Households | Nonfamily Households |
| 1-Person Households | - | 2,909 (22.0%) |
| 2-Person Households | 3,101 (23.5%) | 441 (3.3%) |
| 3-Person Households | 2,163 (16.4%) | 157 (1.2%) |
| 4-Person Households | 2,486 (18.8%) | 68 (0.5%) |
| 5-Person Households | 1,114 (8.4%) | 29 (0.2%) |
| 6-Person Households | 459 (3.5%) | 0 (0.0%) |
| 7+ Person Households | 294 (2.2%) | 0 (0.0%) |
| Total | 9,617 (72.7%) | 3,604 (27.3%) |
Female Fertility in Brighton
Fertility by Age in Brighton
Average fertility rate in Brighton is 50.0 births per 1,000 women. Women in the age bracket of 20 to 34 years have the highest fertility rate with 106.0 births per 1,000 women. Women in the age bracket of 20 to 34 years acount for 91.0% of all women with births.
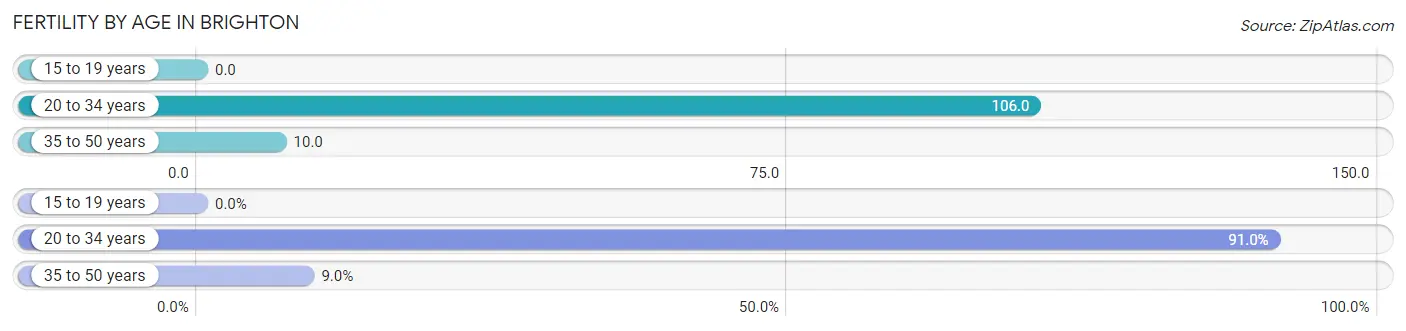
| Age Bracket | Women with Births | Births / 1,000 Women |
| 15 to 19 years | 0 (0.0%) | 0.0 |
| 20 to 34 years | 423 (91.0%) | 106.0 |
| 35 to 50 years | 42 (9.0%) | 10.0 |
| Total | 465 (100.0%) | 50.0 |
Fertility by Age by Marriage Status in Brighton
72.9% of women with births (465) in Brighton are married. The highest percentage of unmarried women with births falls into 20 to 34 years age bracket with 29.8% of them unmarried at the time of birth, while the lowest percentage of unmarried women with births belong to 35 to 50 years age bracket with 0.0% of them unmarried.
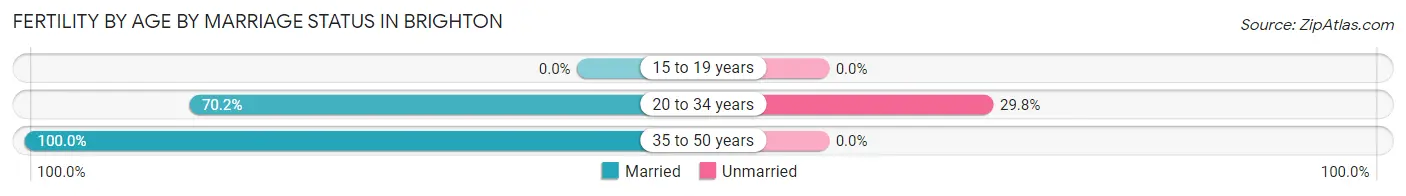
| Age Bracket | Married | Unmarried |
| 15 to 19 years | 0 (0.0%) | 0 (0.0%) |
| 20 to 34 years | 297 (70.2%) | 126 (29.8%) |
| 35 to 50 years | 42 (100.0%) | 0 (0.0%) |
| Total | 339 (72.9%) | 126 (27.1%) |
Fertility by Education in Brighton
Average fertility rate in Brighton is 50.0 births per 1,000 women. Women with the education attainment of less than high school have the highest fertility rate of 59.0 births per 1,000 women, while women with the education attainment of graduate degree have the lowest fertility at 16.0 births per 1,000 women. Women with the education attainment of college or associate's degree represent 28.2% of all women with births.
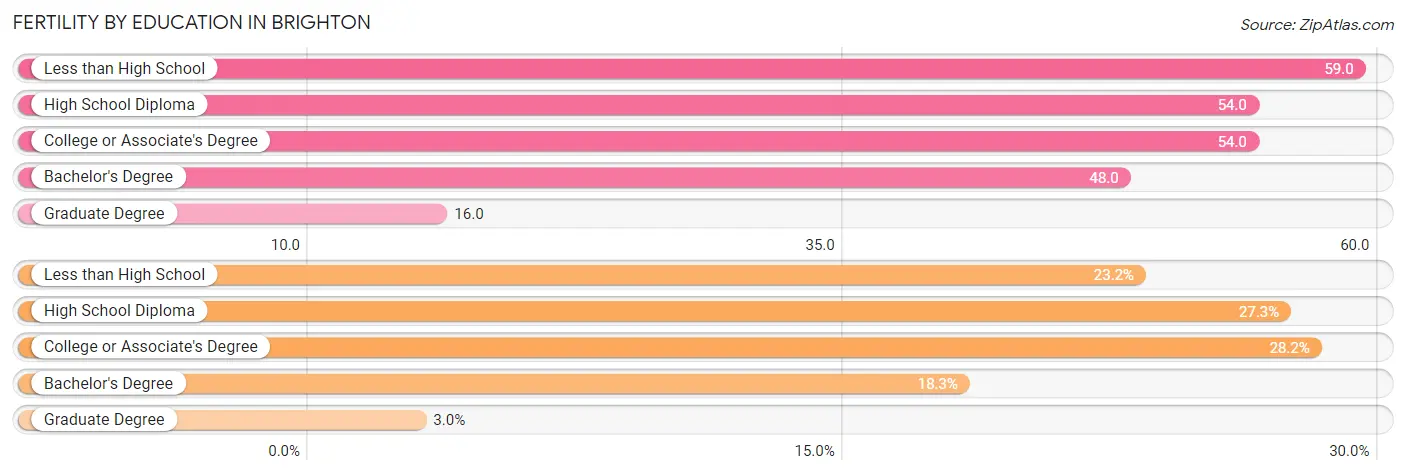
| Educational Attainment | Women with Births | Births / 1,000 Women |
| Less than High School | 108 (23.2%) | 59.0 |
| High School Diploma | 127 (27.3%) | 54.0 |
| College or Associate's Degree | 131 (28.2%) | 54.0 |
| Bachelor's Degree | 85 (18.3%) | 48.0 |
| Graduate Degree | 14 (3.0%) | 16.0 |
| Total | 465 (100.0%) | 50.0 |
Fertility by Education by Marriage Status in Brighton
27.1% of women with births in Brighton are unmarried. Women with the educational attainment of less than high school are most likely to be married with 100.0% of them married at childbirth, while women with the educational attainment of high school diploma are least likely to be married with 60.6% of them unmarried at childbirth.
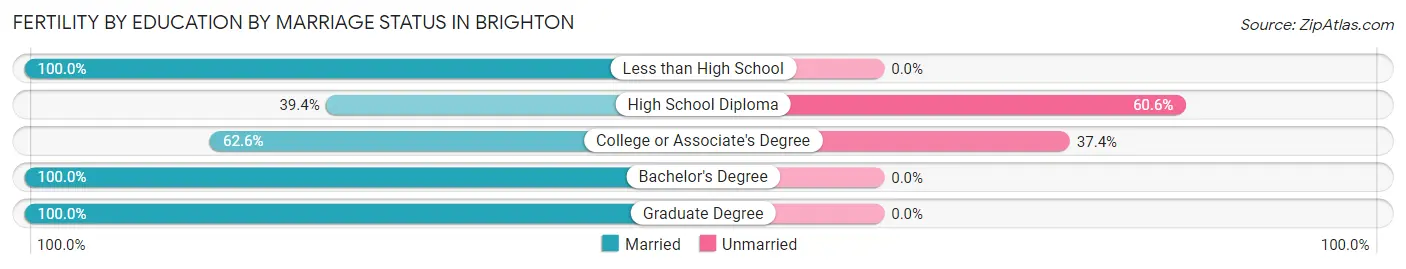
| Educational Attainment | Married | Unmarried |
| Less than High School | 108 (100.0%) | 0 (0.0%) |
| High School Diploma | 50 (39.4%) | 77 (60.6%) |
| College or Associate's Degree | 82 (62.6%) | 49 (37.4%) |
| Bachelor's Degree | 85 (100.0%) | 0 (0.0%) |
| Graduate Degree | 14 (100.0%) | 0 (0.0%) |
| Total | 339 (72.9%) | 126 (27.1%) |
Employment Characteristics in Brighton
Employment by Class of Employer in Brighton
Among the 20,279 employed individuals in Brighton, private company employees (14,197 | 70.0%), local government employees (2,049 | 10.1%), and not-for-profit organizations (1,046 | 5.2%) make up the most common classes of employment.
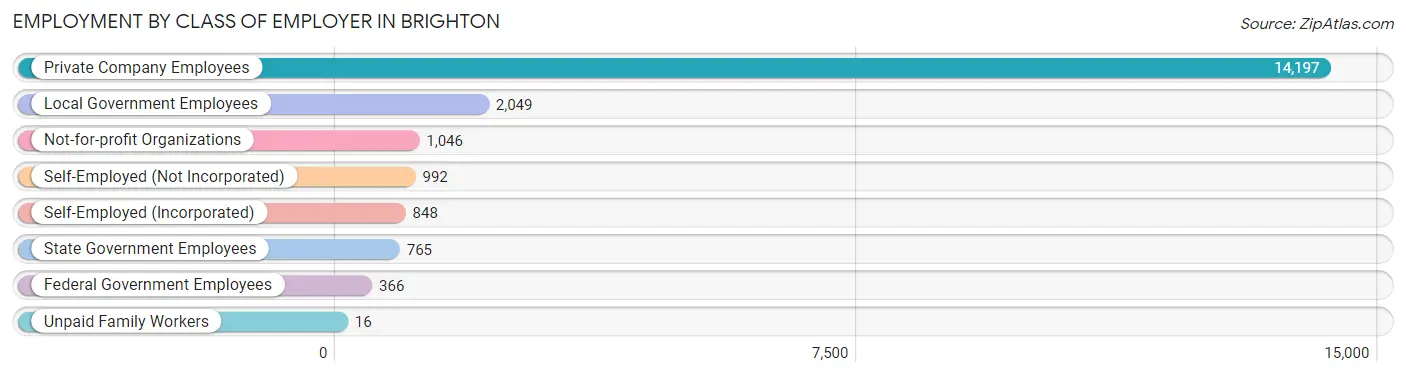
| Employer Class | # Employees | % Employees |
| Private Company Employees | 14,197 | 70.0% |
| Self-Employed (Incorporated) | 848 | 4.2% |
| Self-Employed (Not Incorporated) | 992 | 4.9% |
| Not-for-profit Organizations | 1,046 | 5.2% |
| Local Government Employees | 2,049 | 10.1% |
| State Government Employees | 765 | 3.8% |
| Federal Government Employees | 366 | 1.8% |
| Unpaid Family Workers | 16 | 0.1% |
| Total | 20,279 | 100.0% |
Employment Status by Age in Brighton
According to the labor force statistics for Brighton, out of the total population over 16 years of age (30,667), 70.7% or 21,682 individuals are in the labor force, with 5.1% or 1,106 of them unemployed. The age group with the highest labor force participation rate is 35 to 44 years, with 86.3% or 5,137 individuals in the labor force. Within the labor force, the 16 to 19 years age range has the highest percentage of unemployed individuals, with 22.4% or 260 of them being unemployed.
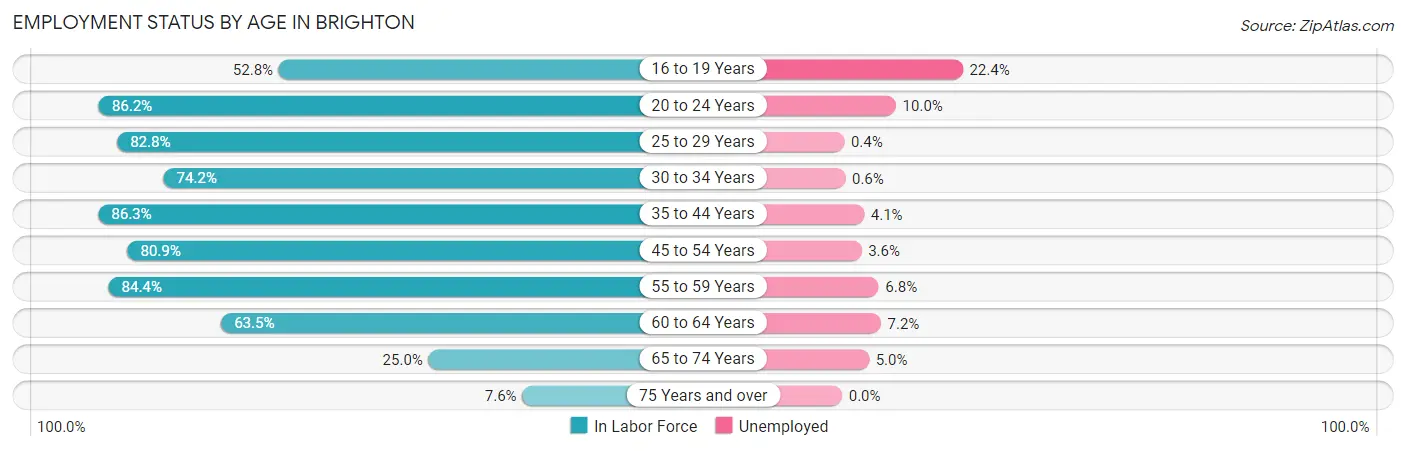
| Age Bracket | In Labor Force | Unemployed |
| 16 to 19 Years | 1,159 (52.8%) | 260 (22.4%) |
| 20 to 24 Years | 1,776 (86.2%) | 178 (10.0%) |
| 25 to 29 Years | 2,878 (82.8%) | 12 (0.4%) |
| 30 to 34 Years | 2,173 (74.2%) | 13 (0.6%) |
| 35 to 44 Years | 5,137 (86.3%) | 211 (4.1%) |
| 45 to 54 Years | 4,256 (80.9%) | 153 (3.6%) |
| 55 to 59 Years | 2,154 (84.4%) | 146 (6.8%) |
| 60 to 64 Years | 1,408 (63.5%) | 101 (7.2%) |
| 65 to 74 Years | 600 (25.0%) | 30 (5.0%) |
| 75 Years and over | 123 (7.6%) | 0 (0.0%) |
| Total | 21,682 (70.7%) | 1,106 (5.1%) |
Employment Status by Educational Attainment in Brighton
According to labor force statistics for Brighton, 80.4% of individuals (18,001) out of the total population between 25 and 64 years of age (22,389) are in the labor force, with 3.5% or 630 of them being unemployed. The group with the highest labor force participation rate are those with the educational attainment of bachelor's degree or higher, with 91.2% or 4,636 individuals in the labor force. Within the labor force, individuals with less than high school education have the highest percentage of unemployment, with 12.0% or 256 of them being unemployed.
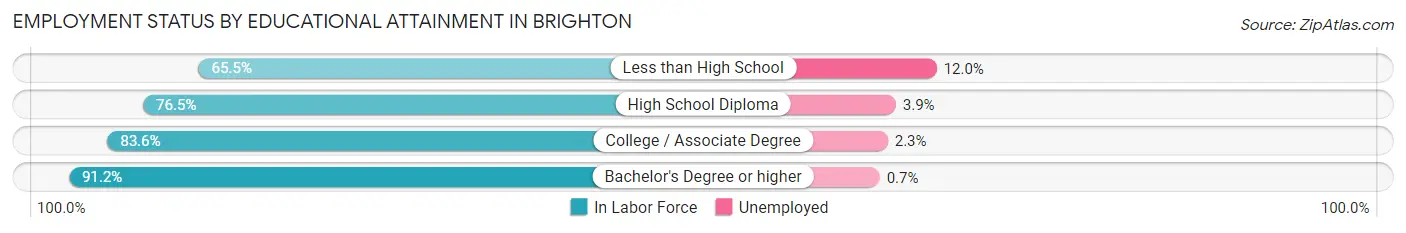
| Educational Attainment | In Labor Force | Unemployed |
| Less than High School | 2,135 (65.5%) | 391 (12.0%) |
| High School Diploma | 5,416 (76.5%) | 276 (3.9%) |
| College / Associate Degree | 5,824 (83.6%) | 160 (2.3%) |
| Bachelor's Degree or higher | 4,636 (91.2%) | 36 (0.7%) |
| Total | 18,001 (80.4%) | 784 (3.5%) |
Employment Occupations by Sex in Brighton
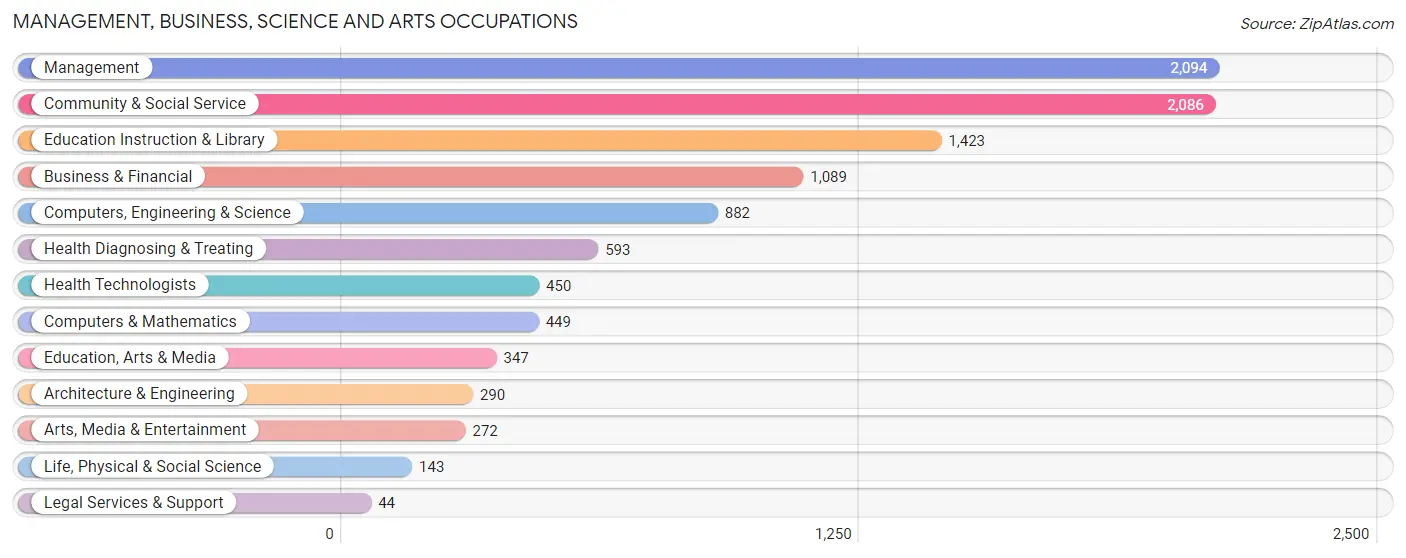
Management, Business, Science and Arts Occupations
The most common Management, Business, Science and Arts occupations in Brighton are Management (2,094 | 10.2%), Community & Social Service (2,086 | 10.2%), Education Instruction & Library (1,423 | 6.9%), Business & Financial (1,089 | 5.3%), and Computers, Engineering & Science (882 | 4.3%).
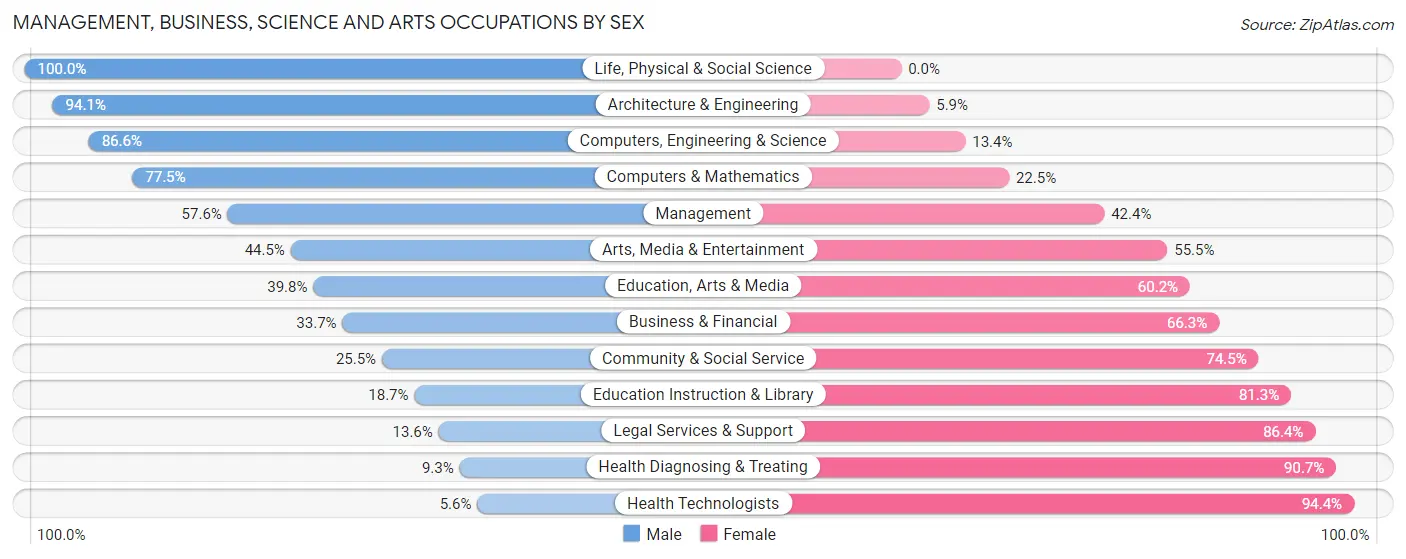
Management, Business, Science and Arts Occupations by Sex
Within the Management, Business, Science and Arts occupations in Brighton, the most male-oriented occupations are Life, Physical & Social Science (100.0%), Architecture & Engineering (94.1%), and Computers, Engineering & Science (86.6%), while the most female-oriented occupations are Health Technologists (94.4%), Health Diagnosing & Treating (90.7%), and Legal Services & Support (86.4%).
| Occupation | Male | Female |
| Management | 1,207 (57.6%) | 887 (42.4%) |
| Business & Financial | 367 (33.7%) | 722 (66.3%) |
| Computers, Engineering & Science | 764 (86.6%) | 118 (13.4%) |
| Computers & Mathematics | 348 (77.5%) | 101 (22.5%) |
| Architecture & Engineering | 273 (94.1%) | 17 (5.9%) |
| Life, Physical & Social Science | 143 (100.0%) | 0 (0.0%) |
| Community & Social Service | 531 (25.5%) | 1,555 (74.5%) |
| Education, Arts & Media | 138 (39.8%) | 209 (60.2%) |
| Legal Services & Support | 6 (13.6%) | 38 (86.4%) |
| Education Instruction & Library | 266 (18.7%) | 1,157 (81.3%) |
| Arts, Media & Entertainment | 121 (44.5%) | 151 (55.5%) |
| Health Diagnosing & Treating | 55 (9.3%) | 538 (90.7%) |
| Health Technologists | 25 (5.6%) | 425 (94.4%) |
| Total (Category) | 2,924 (43.4%) | 3,820 (56.6%) |
| Total (Overall) | 11,449 (55.7%) | 9,088 (44.3%) |
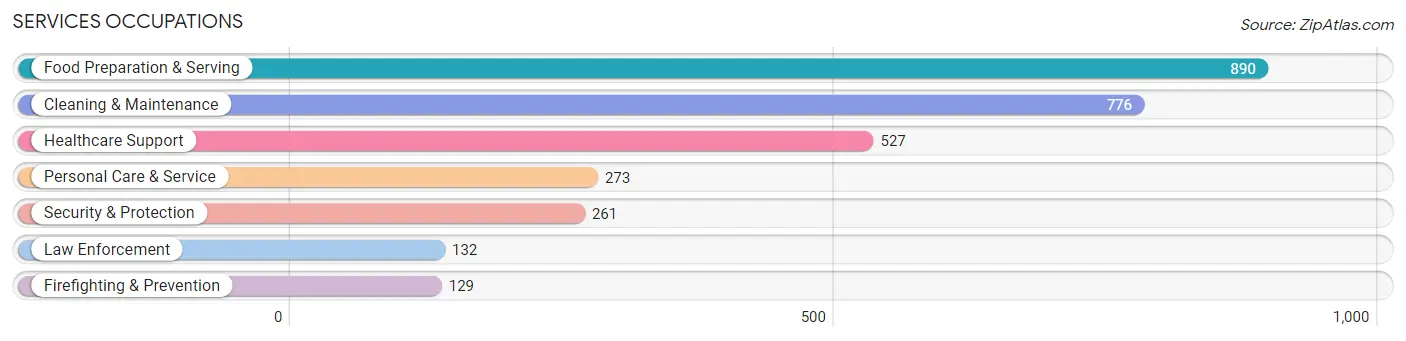
Services Occupations
The most common Services occupations in Brighton are Food Preparation & Serving (890 | 4.3%), Cleaning & Maintenance (776 | 3.8%), Healthcare Support (527 | 2.6%), Personal Care & Service (273 | 1.3%), and Security & Protection (261 | 1.3%).
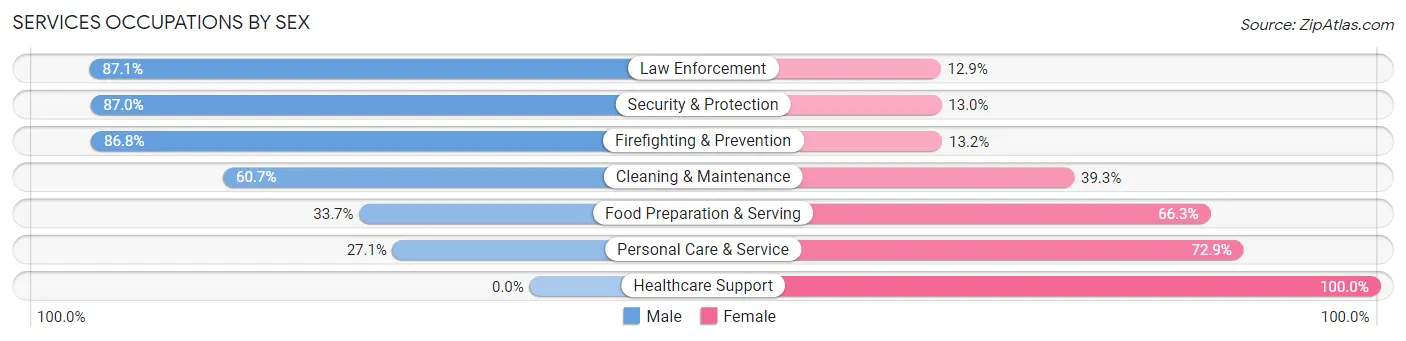
Services Occupations by Sex
Within the Services occupations in Brighton, the most male-oriented occupations are Law Enforcement (87.1%), Security & Protection (87.0%), and Firefighting & Prevention (86.8%), while the most female-oriented occupations are Healthcare Support (100.0%), Personal Care & Service (72.9%), and Food Preparation & Serving (66.3%).
| Occupation | Male | Female |
| Healthcare Support | 0 (0.0%) | 527 (100.0%) |
| Security & Protection | 227 (87.0%) | 34 (13.0%) |
| Firefighting & Prevention | 112 (86.8%) | 17 (13.2%) |
| Law Enforcement | 115 (87.1%) | 17 (12.9%) |
| Food Preparation & Serving | 300 (33.7%) | 590 (66.3%) |
| Cleaning & Maintenance | 471 (60.7%) | 305 (39.3%) |
| Personal Care & Service | 74 (27.1%) | 199 (72.9%) |
| Total (Category) | 1,072 (39.3%) | 1,655 (60.7%) |
| Total (Overall) | 11,449 (55.7%) | 9,088 (44.3%) |
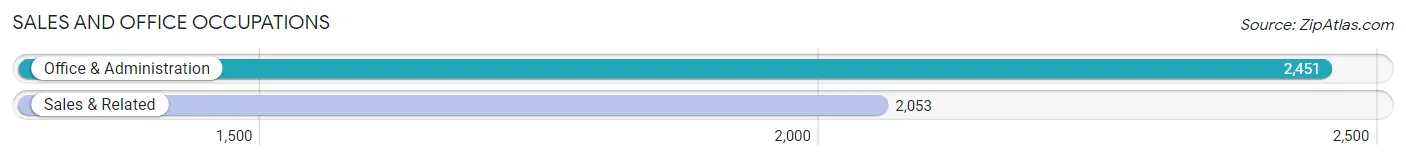
Sales and Office Occupations
The most common Sales and Office occupations in Brighton are Office & Administration (2,451 | 11.9%), and Sales & Related (2,053 | 10.0%).
Sales and Office Occupations by Sex
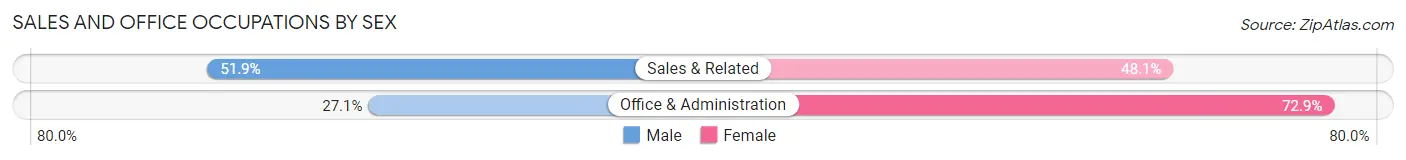
| Occupation | Male | Female |
| Sales & Related | 1,065 (51.9%) | 988 (48.1%) |
| Office & Administration | 665 (27.1%) | 1,786 (72.9%) |
| Total (Category) | 1,730 (38.4%) | 2,774 (61.6%) |
| Total (Overall) | 11,449 (55.7%) | 9,088 (44.3%) |
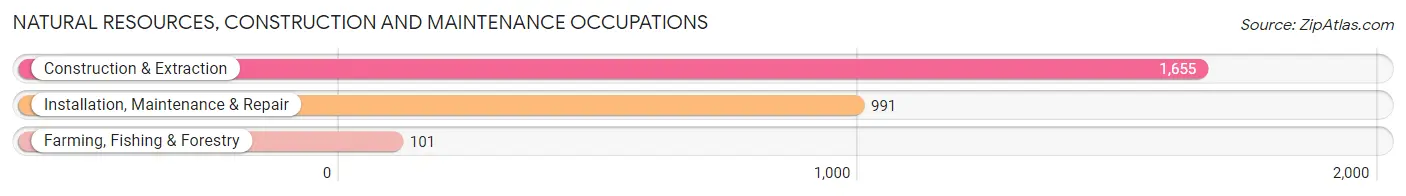
Natural Resources, Construction and Maintenance Occupations
The most common Natural Resources, Construction and Maintenance occupations in Brighton are Construction & Extraction (1,655 | 8.1%), Installation, Maintenance & Repair (991 | 4.8%), and Farming, Fishing & Forestry (101 | 0.5%).
Natural Resources, Construction and Maintenance Occupations by Sex
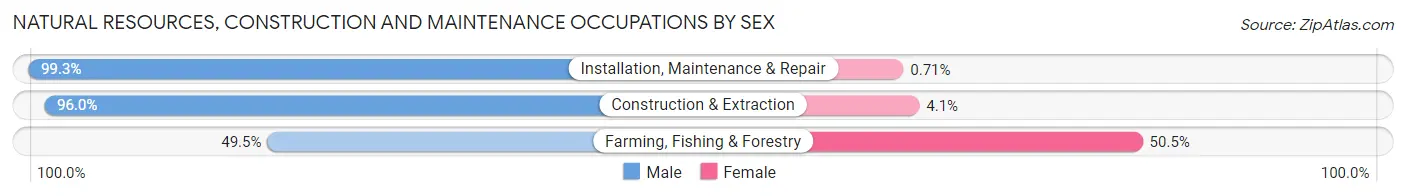
| Occupation | Male | Female |
| Farming, Fishing & Forestry | 50 (49.5%) | 51 (50.5%) |
| Construction & Extraction | 1,588 (96.0%) | 67 (4.1%) |
| Installation, Maintenance & Repair | 984 (99.3%) | 7 (0.7%) |
| Total (Category) | 2,622 (95.5%) | 125 (4.5%) |
| Total (Overall) | 11,449 (55.7%) | 9,088 (44.3%) |
Production, Transportation and Moving Occupations
The most common Production, Transportation and Moving occupations in Brighton are Material Moving (1,379 | 6.7%), Transportation (1,348 | 6.6%), and Production (1,088 | 5.3%).
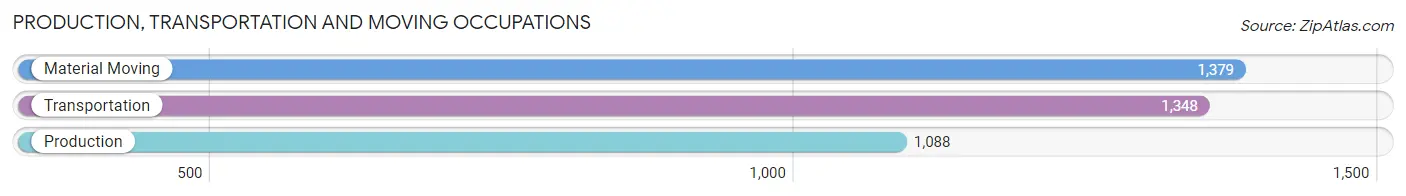
Production, Transportation and Moving Occupations by Sex
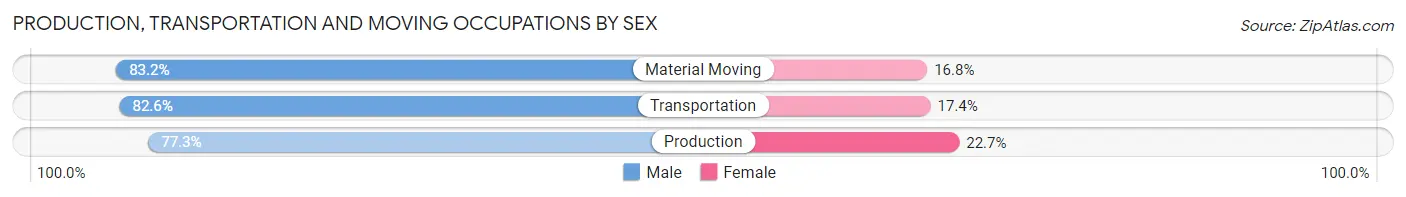
| Occupation | Male | Female |
| Production | 841 (77.3%) | 247 (22.7%) |
| Transportation | 1,113 (82.6%) | 235 (17.4%) |
| Material Moving | 1,147 (83.2%) | 232 (16.8%) |
| Total (Category) | 3,101 (81.3%) | 714 (18.7%) |
| Total (Overall) | 11,449 (55.7%) | 9,088 (44.3%) |
Employment Industries by Sex in Brighton
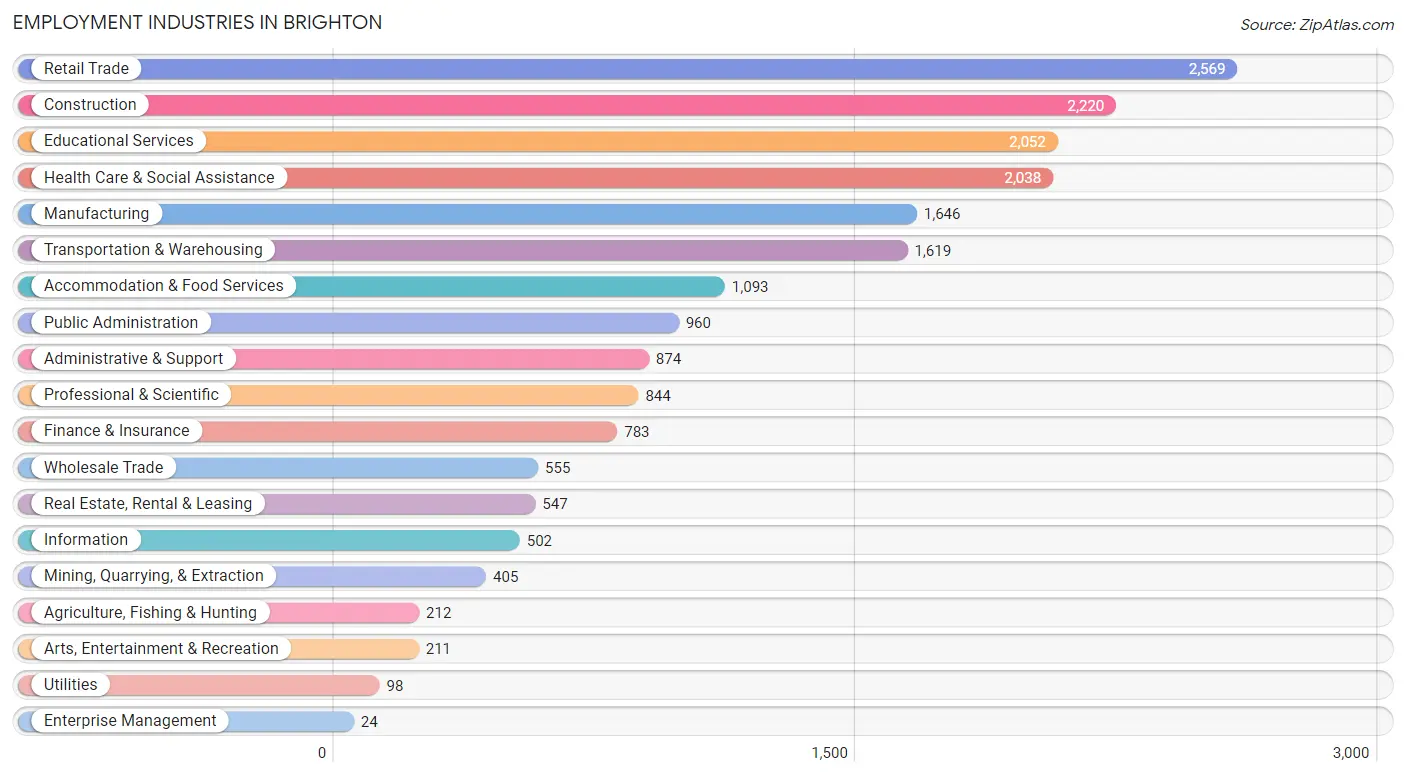
Employment Industries in Brighton
The major employment industries in Brighton include Retail Trade (2,569 | 12.5%), Construction (2,220 | 10.8%), Educational Services (2,052 | 10.0%), Health Care & Social Assistance (2,038 | 9.9%), and Manufacturing (1,646 | 8.0%).
Employment Industries by Sex in Brighton
The Brighton industries that see more men than women are Mining, Quarrying, & Extraction (90.6%), Construction (89.5%), and Wholesale Trade (84.0%), whereas the industries that tend to have a higher number of women are Enterprise Management (100.0%), Educational Services (86.4%), and Health Care & Social Assistance (82.0%).
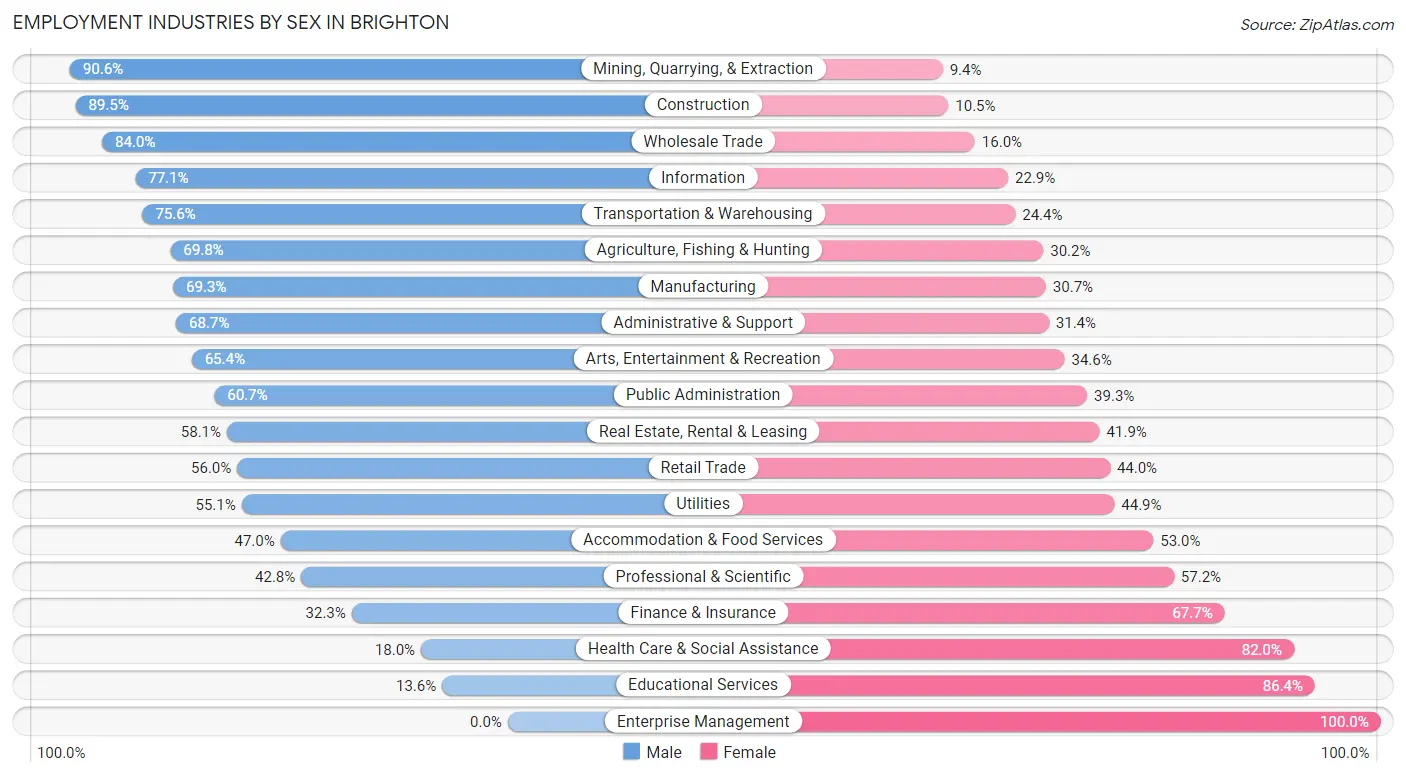
| Industry | Male | Female |
| Agriculture, Fishing & Hunting | 148 (69.8%) | 64 (30.2%) |
| Mining, Quarrying, & Extraction | 367 (90.6%) | 38 (9.4%) |
| Construction | 1,986 (89.5%) | 234 (10.5%) |
| Manufacturing | 1,140 (69.3%) | 506 (30.7%) |
| Wholesale Trade | 466 (84.0%) | 89 (16.0%) |
| Retail Trade | 1,439 (56.0%) | 1,130 (44.0%) |
| Transportation & Warehousing | 1,224 (75.6%) | 395 (24.4%) |
| Utilities | 54 (55.1%) | 44 (44.9%) |
| Information | 387 (77.1%) | 115 (22.9%) |
| Finance & Insurance | 253 (32.3%) | 530 (67.7%) |
| Real Estate, Rental & Leasing | 318 (58.1%) | 229 (41.9%) |
| Professional & Scientific | 361 (42.8%) | 483 (57.2%) |
| Enterprise Management | 0 (0.0%) | 24 (100.0%) |
| Administrative & Support | 600 (68.6%) | 274 (31.4%) |
| Educational Services | 279 (13.6%) | 1,773 (86.4%) |
| Health Care & Social Assistance | 366 (18.0%) | 1,672 (82.0%) |
| Arts, Entertainment & Recreation | 138 (65.4%) | 73 (34.6%) |
| Accommodation & Food Services | 514 (47.0%) | 579 (53.0%) |
| Public Administration | 583 (60.7%) | 377 (39.3%) |
| Total | 11,449 (55.7%) | 9,088 (44.3%) |
Education in Brighton
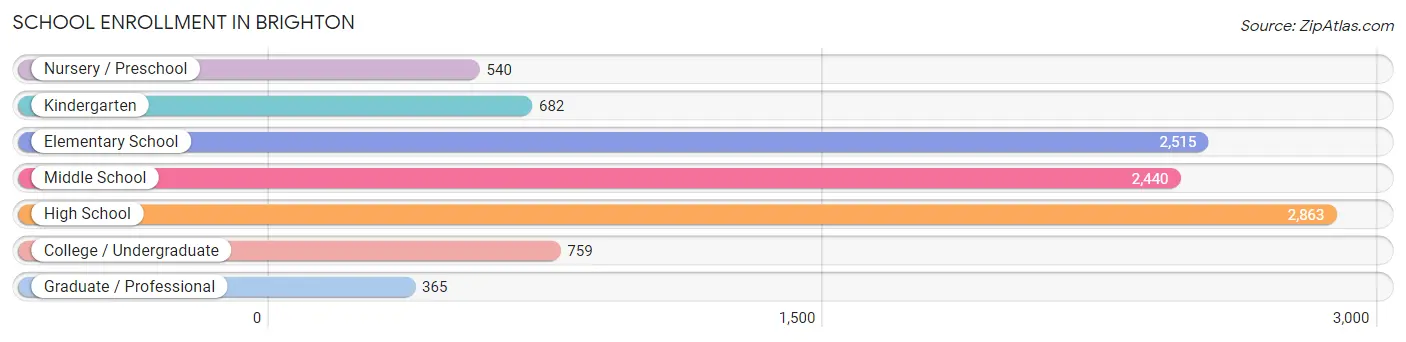
School Enrollment in Brighton
The most common levels of schooling among the 10,164 students in Brighton are high school (2,863 | 28.2%), elementary school (2,515 | 24.7%), and middle school (2,440 | 24.0%).
| School Level | # Students | % Students |
| Nursery / Preschool | 540 | 5.3% |
| Kindergarten | 682 | 6.7% |
| Elementary School | 2,515 | 24.7% |
| Middle School | 2,440 | 24.0% |
| High School | 2,863 | 28.2% |
| College / Undergraduate | 759 | 7.5% |
| Graduate / Professional | 365 | 3.6% |
| Total | 10,164 | 100.0% |
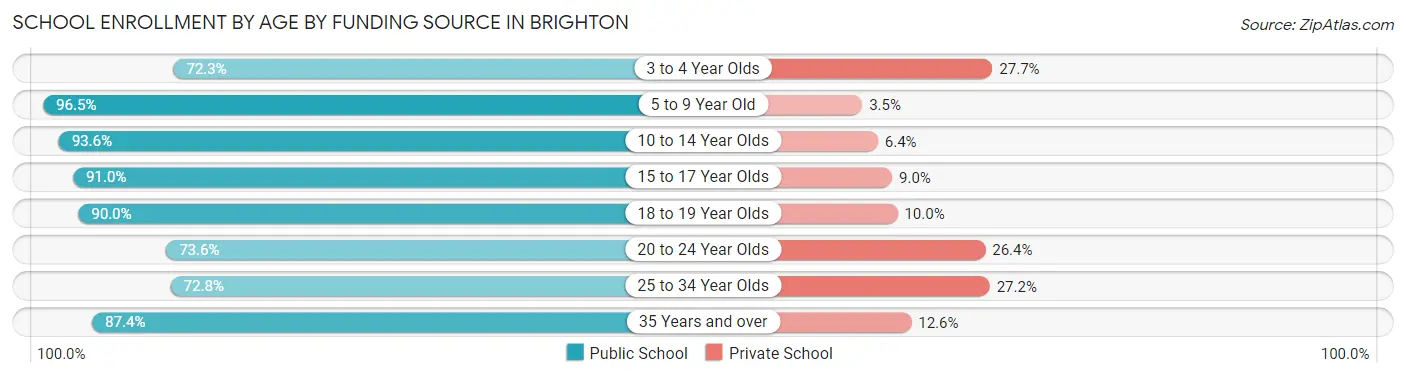
School Enrollment by Age by Funding Source in Brighton
Out of a total of 10,164 students who are enrolled in schools in Brighton, 884 (8.7%) attend a private institution, while the remaining 9,280 (91.3%) are enrolled in public schools. The age group of 3 to 4 year olds has the highest likelihood of being enrolled in private schools, with 123 (27.7% in the age bracket) enrolled. Conversely, the age group of 5 to 9 year old has the lowest likelihood of being enrolled in a private school, with 2,542 (96.5% in the age bracket) attending a public institution.
| Age Bracket | Public School | Private School |
| 3 to 4 Year Olds | 321 (72.3%) | 123 (27.7%) |
| 5 to 9 Year Old | 2,542 (96.5%) | 91 (3.5%) |
| 10 to 14 Year Olds | 3,488 (93.6%) | 237 (6.4%) |
| 15 to 17 Year Olds | 1,725 (91.0%) | 171 (9.0%) |
| 18 to 19 Year Olds | 368 (90.0%) | 41 (10.0%) |
| 20 to 24 Year Olds | 240 (73.6%) | 86 (26.4%) |
| 25 to 34 Year Olds | 214 (72.8%) | 80 (27.2%) |
| 35 Years and over | 382 (87.4%) | 55 (12.6%) |
| Total | 9,280 (91.3%) | 884 (8.7%) |
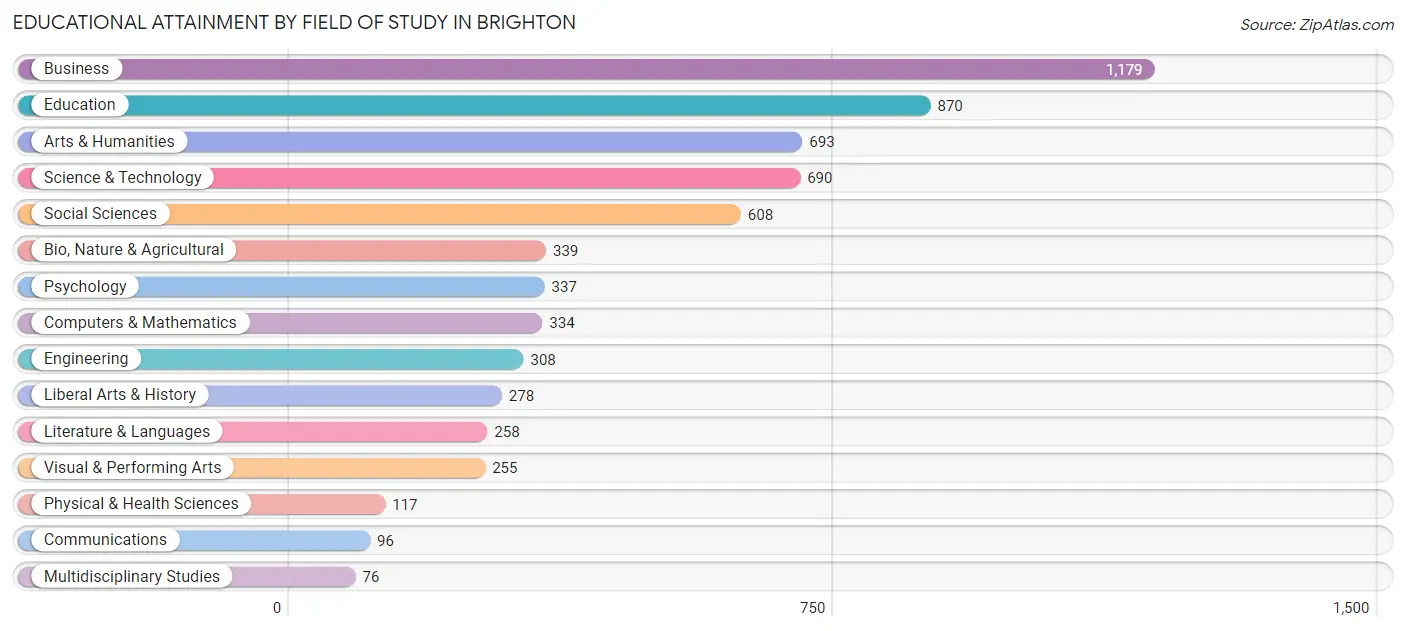
Educational Attainment by Field of Study in Brighton
Business (1,179 | 18.3%), education (870 | 13.5%), arts & humanities (693 | 10.8%), science & technology (690 | 10.7%), and social sciences (608 | 9.4%) are the most common fields of study among 6,438 individuals in Brighton who have obtained a bachelor's degree or higher.
| Field of Study | # Graduates | % Graduates |
| Computers & Mathematics | 334 | 5.2% |
| Bio, Nature & Agricultural | 339 | 5.3% |
| Physical & Health Sciences | 117 | 1.8% |
| Psychology | 337 | 5.2% |
| Social Sciences | 608 | 9.4% |
| Engineering | 308 | 4.8% |
| Multidisciplinary Studies | 76 | 1.2% |
| Science & Technology | 690 | 10.7% |
| Business | 1,179 | 18.3% |
| Education | 870 | 13.5% |
| Literature & Languages | 258 | 4.0% |
| Liberal Arts & History | 278 | 4.3% |
| Visual & Performing Arts | 255 | 4.0% |
| Communications | 96 | 1.5% |
| Arts & Humanities | 693 | 10.8% |
| Total | 6,438 | 100.0% |
Transportation & Commute in Brighton
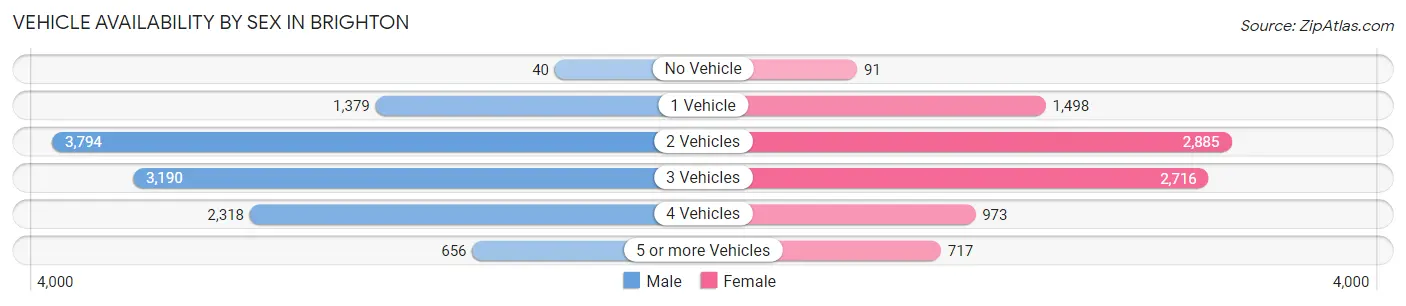
Vehicle Availability by Sex in Brighton
The most prevalent vehicle ownership categories in Brighton are males with 2 vehicles (3,794, accounting for 33.4%) and females with 2 vehicles (2,885, making up 42.7%).
| Vehicles Available | Male | Female |
| No Vehicle | 40 (0.4%) | 91 (1.0%) |
| 1 Vehicle | 1,379 (12.1%) | 1,498 (16.9%) |
| 2 Vehicles | 3,794 (33.4%) | 2,885 (32.5%) |
| 3 Vehicles | 3,190 (28.0%) | 2,716 (30.6%) |
| 4 Vehicles | 2,318 (20.4%) | 973 (11.0%) |
| 5 or more Vehicles | 656 (5.8%) | 717 (8.1%) |
| Total | 11,377 (100.0%) | 8,880 (100.0%) |
Commute Time in Brighton
The most frequently occuring commute durations in Brighton are 30 to 34 minutes (3,667 commuters, 19.7%), 45 to 59 minutes (2,191 commuters, 11.8%), and 5 to 9 minutes (2,077 commuters, 11.2%).
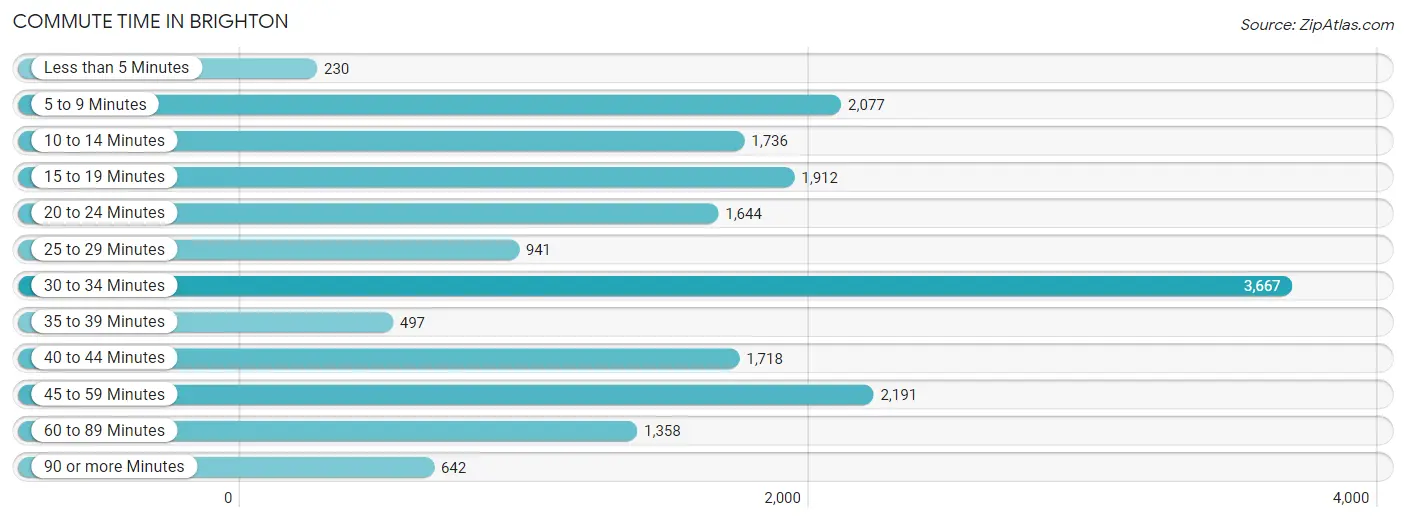
| Commute Time | # Commuters | % Commuters |
| Less than 5 Minutes | 230 | 1.2% |
| 5 to 9 Minutes | 2,077 | 11.2% |
| 10 to 14 Minutes | 1,736 | 9.3% |
| 15 to 19 Minutes | 1,912 | 10.3% |
| 20 to 24 Minutes | 1,644 | 8.8% |
| 25 to 29 Minutes | 941 | 5.1% |
| 30 to 34 Minutes | 3,667 | 19.7% |
| 35 to 39 Minutes | 497 | 2.7% |
| 40 to 44 Minutes | 1,718 | 9.2% |
| 45 to 59 Minutes | 2,191 | 11.8% |
| 60 to 89 Minutes | 1,358 | 7.3% |
| 90 or more Minutes | 642 | 3.5% |
Commute Time by Sex in Brighton
The most common commute times in Brighton are 30 to 34 minutes (2,213 commuters, 20.7%) for males and 30 to 34 minutes (1,454 commuters, 18.4%) for females.
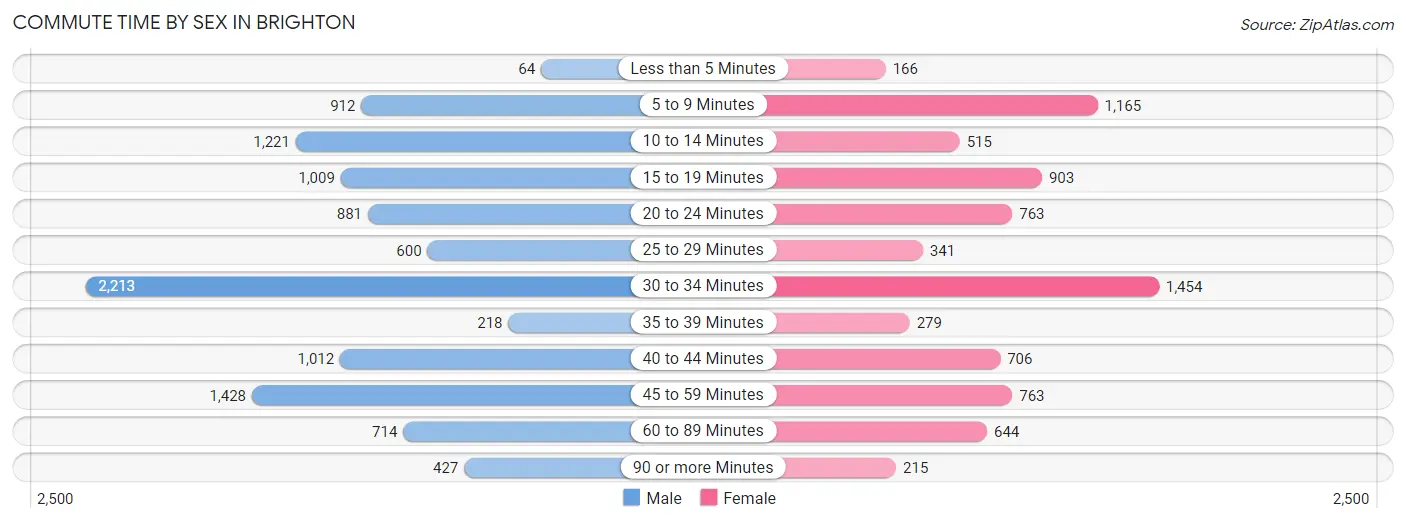
| Commute Time | Male | Female |
| Less than 5 Minutes | 64 (0.6%) | 166 (2.1%) |
| 5 to 9 Minutes | 912 (8.5%) | 1,165 (14.7%) |
| 10 to 14 Minutes | 1,221 (11.4%) | 515 (6.5%) |
| 15 to 19 Minutes | 1,009 (9.4%) | 903 (11.4%) |
| 20 to 24 Minutes | 881 (8.2%) | 763 (9.6%) |
| 25 to 29 Minutes | 600 (5.6%) | 341 (4.3%) |
| 30 to 34 Minutes | 2,213 (20.7%) | 1,454 (18.4%) |
| 35 to 39 Minutes | 218 (2.0%) | 279 (3.5%) |
| 40 to 44 Minutes | 1,012 (9.5%) | 706 (8.9%) |
| 45 to 59 Minutes | 1,428 (13.4%) | 763 (9.6%) |
| 60 to 89 Minutes | 714 (6.7%) | 644 (8.1%) |
| 90 or more Minutes | 427 (4.0%) | 215 (2.7%) |
Time of Departure to Work by Sex in Brighton
The most frequent times of departure to work in Brighton are 7:00 AM to 7:29 AM (1,477, 13.8%) for males and 6:30 AM to 6:59 AM (1,345, 17.0%) for females.
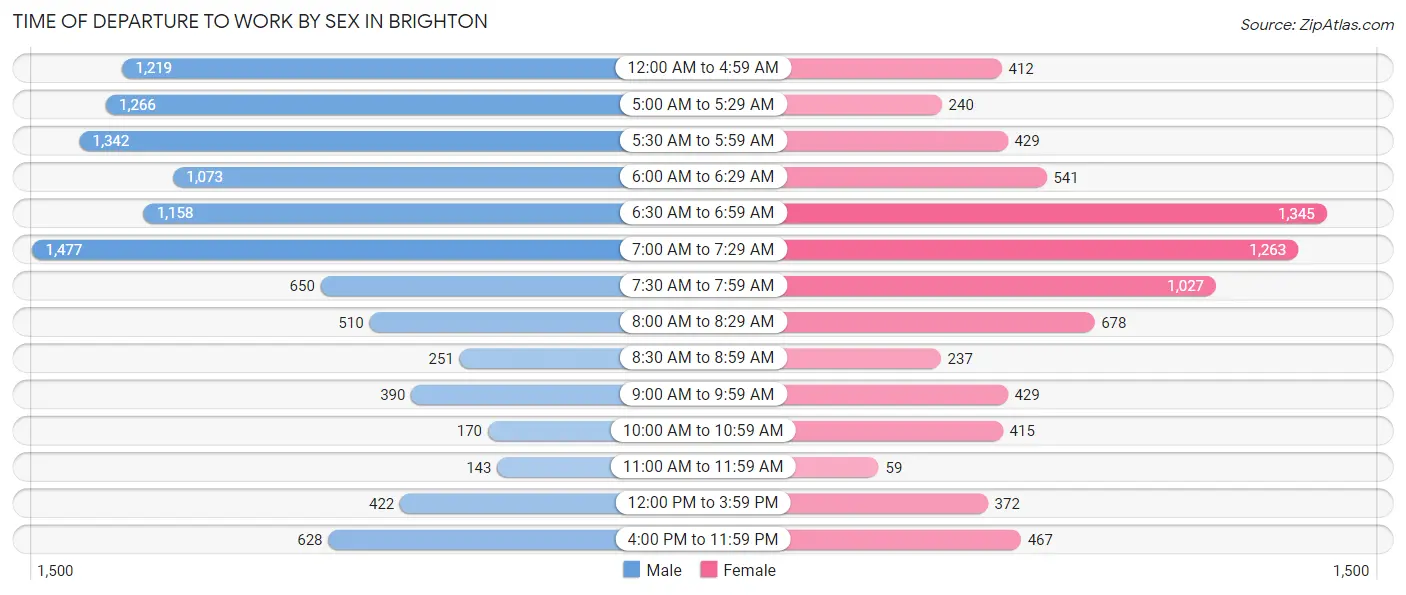
| Time of Departure | Male | Female |
| 12:00 AM to 4:59 AM | 1,219 (11.4%) | 412 (5.2%) |
| 5:00 AM to 5:29 AM | 1,266 (11.8%) | 240 (3.0%) |
| 5:30 AM to 5:59 AM | 1,342 (12.5%) | 429 (5.4%) |
| 6:00 AM to 6:29 AM | 1,073 (10.0%) | 541 (6.8%) |
| 6:30 AM to 6:59 AM | 1,158 (10.8%) | 1,345 (17.0%) |
| 7:00 AM to 7:29 AM | 1,477 (13.8%) | 1,263 (16.0%) |
| 7:30 AM to 7:59 AM | 650 (6.1%) | 1,027 (13.0%) |
| 8:00 AM to 8:29 AM | 510 (4.8%) | 678 (8.6%) |
| 8:30 AM to 8:59 AM | 251 (2.4%) | 237 (3.0%) |
| 9:00 AM to 9:59 AM | 390 (3.6%) | 429 (5.4%) |
| 10:00 AM to 10:59 AM | 170 (1.6%) | 415 (5.2%) |
| 11:00 AM to 11:59 AM | 143 (1.3%) | 59 (0.7%) |
| 12:00 PM to 3:59 PM | 422 (3.9%) | 372 (4.7%) |
| 4:00 PM to 11:59 PM | 628 (5.9%) | 467 (5.9%) |
| Total | 10,699 (100.0%) | 7,914 (100.0%) |
Housing Occupancy in Brighton
Occupancy by Ownership in Brighton
Of the total 13,221 dwellings in Brighton, owner-occupied units account for 9,126 (69.0%), while renter-occupied units make up 4,095 (31.0%).
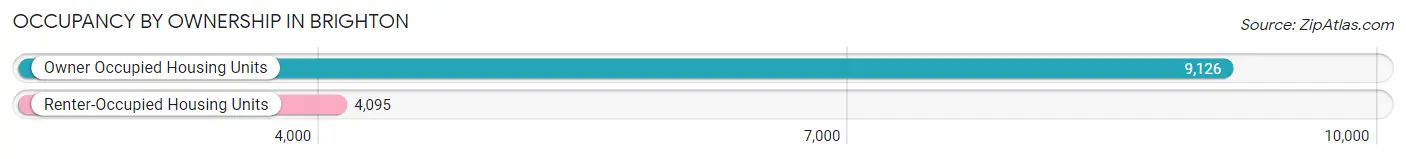
| Occupancy | # Housing Units | % Housing Units |
| Owner Occupied Housing Units | 9,126 | 69.0% |
| Renter-Occupied Housing Units | 4,095 | 31.0% |
| Total Occupied Housing Units | 13,221 | 100.0% |
Occupancy by Household Size in Brighton
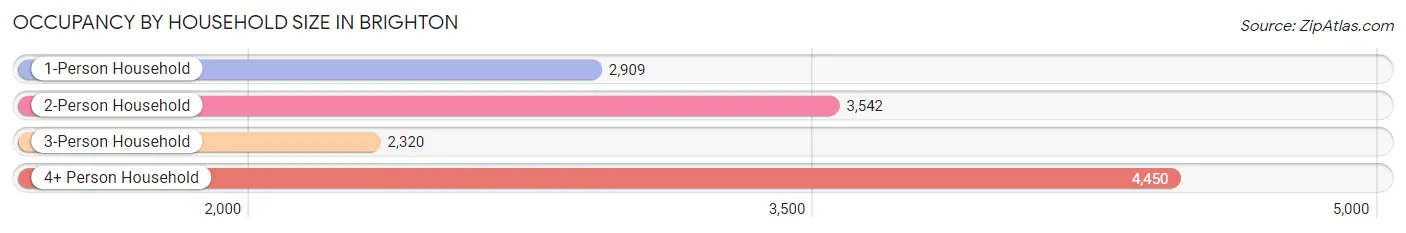
| Household Size | # Housing Units | % Housing Units |
| 1-Person Household | 2,909 | 22.0% |
| 2-Person Household | 3,542 | 26.8% |
| 3-Person Household | 2,320 | 17.5% |
| 4+ Person Household | 4,450 | 33.7% |
| Total Housing Units | 13,221 | 100.0% |
Occupancy by Ownership by Household Size in Brighton
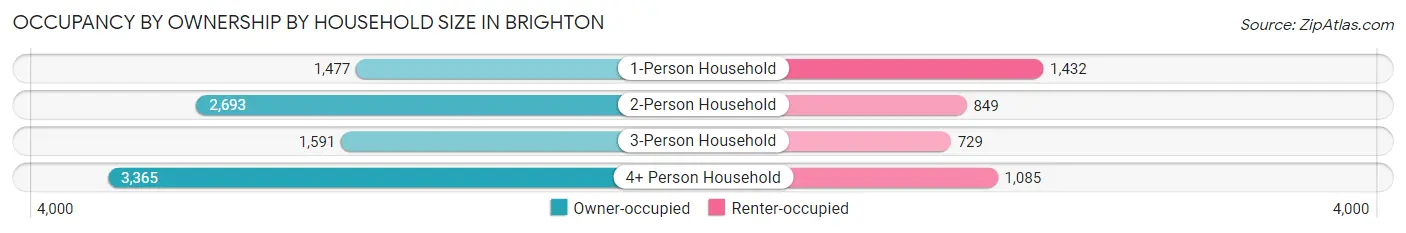
| Household Size | Owner-occupied | Renter-occupied |
| 1-Person Household | 1,477 (50.8%) | 1,432 (49.2%) |
| 2-Person Household | 2,693 (76.0%) | 849 (24.0%) |
| 3-Person Household | 1,591 (68.6%) | 729 (31.4%) |
| 4+ Person Household | 3,365 (75.6%) | 1,085 (24.4%) |
| Total Housing Units | 9,126 (69.0%) | 4,095 (31.0%) |
Occupancy by Educational Attainment in Brighton
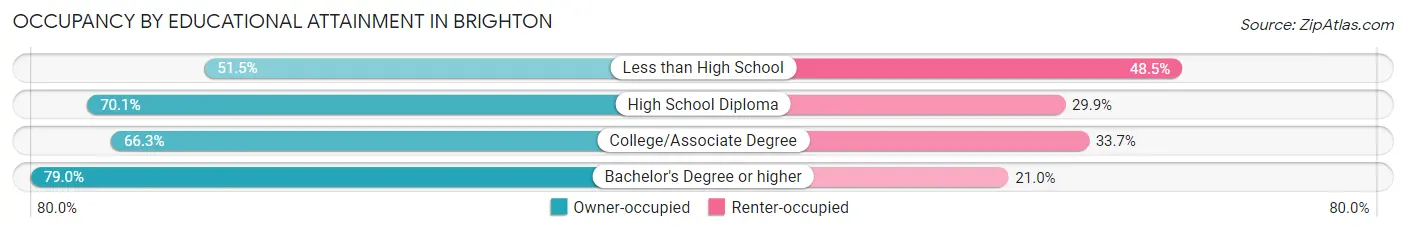
| Household Size | Owner-occupied | Renter-occupied |
| Less than High School | 714 (51.5%) | 673 (48.5%) |
| High School Diploma | 2,597 (70.1%) | 1,110 (29.9%) |
| College/Associate Degree | 3,162 (66.3%) | 1,608 (33.7%) |
| Bachelor's Degree or higher | 2,653 (79.0%) | 704 (21.0%) |
Occupancy by Age of Householder in Brighton
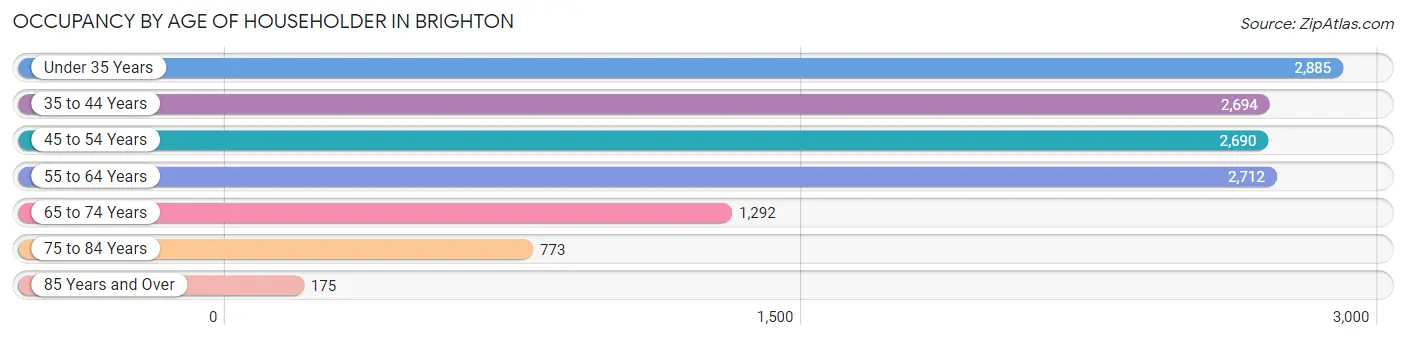
| Age Bracket | # Households | % Households |
| Under 35 Years | 2,885 | 21.8% |
| 35 to 44 Years | 2,694 | 20.4% |
| 45 to 54 Years | 2,690 | 20.3% |
| 55 to 64 Years | 2,712 | 20.5% |
| 65 to 74 Years | 1,292 | 9.8% |
| 75 to 84 Years | 773 | 5.9% |
| 85 Years and Over | 175 | 1.3% |
| Total | 13,221 | 100.0% |
Housing Finances in Brighton
Median Income by Occupancy in Brighton
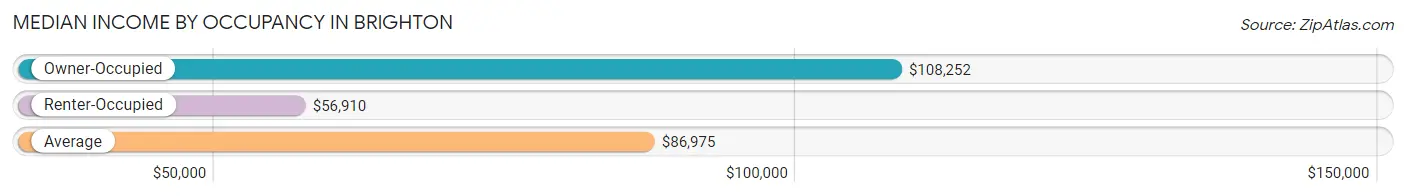
| Occupancy Type | # Households | Median Income |
| Owner-Occupied | 9,126 (69.0%) | $108,252 |
| Renter-Occupied | 4,095 (31.0%) | $56,910 |
| Average | 13,221 (100.0%) | $86,975 |
Occupancy by Householder Income Bracket in Brighton
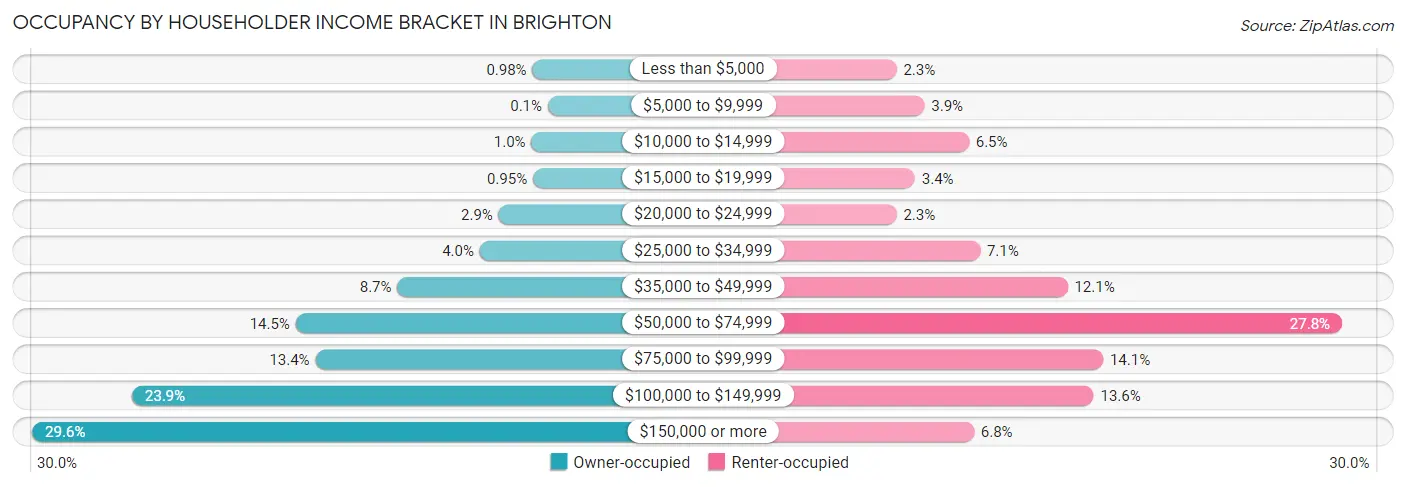
| Income Bracket | Owner-occupied | Renter-occupied |
| Less than $5,000 | 89 (1.0%) | 96 (2.3%) |
| $5,000 to $9,999 | 9 (0.1%) | 161 (3.9%) |
| $10,000 to $14,999 | 95 (1.0%) | 265 (6.5%) |
| $15,000 to $19,999 | 87 (0.9%) | 139 (3.4%) |
| $20,000 to $24,999 | 266 (2.9%) | 96 (2.3%) |
| $25,000 to $34,999 | 364 (4.0%) | 291 (7.1%) |
| $35,000 to $49,999 | 794 (8.7%) | 496 (12.1%) |
| $50,000 to $74,999 | 1,324 (14.5%) | 1,138 (27.8%) |
| $75,000 to $99,999 | 1,221 (13.4%) | 579 (14.1%) |
| $100,000 to $149,999 | 2,178 (23.9%) | 557 (13.6%) |
| $150,000 or more | 2,699 (29.6%) | 277 (6.8%) |
| Total | 9,126 (100.0%) | 4,095 (100.0%) |
Monthly Housing Cost Tiers in Brighton
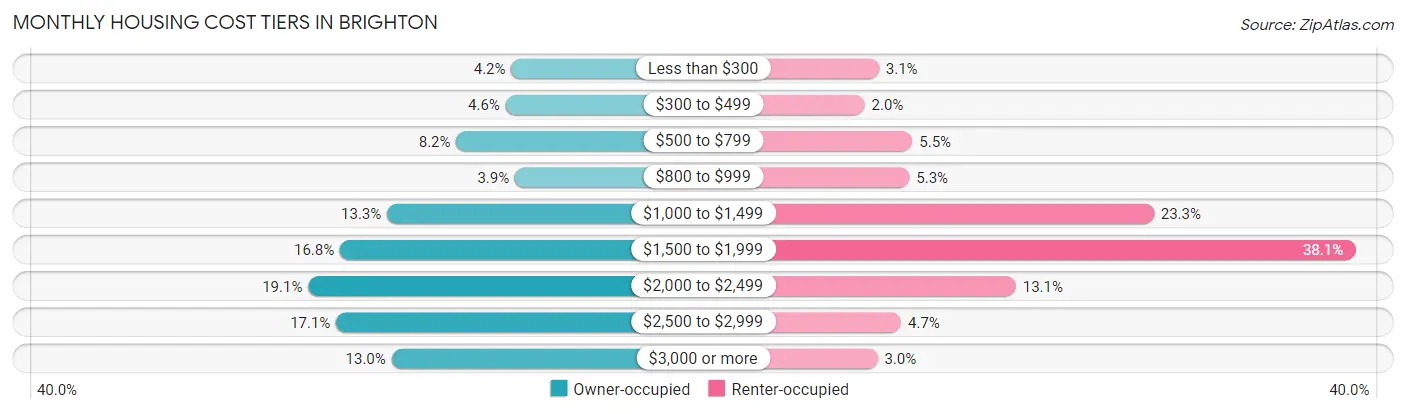
| Monthly Cost | Owner-occupied | Renter-occupied |
| Less than $300 | 379 (4.2%) | 125 (3.0%) |
| $300 to $499 | 417 (4.6%) | 82 (2.0%) |
| $500 to $799 | 748 (8.2%) | 226 (5.5%) |
| $800 to $999 | 354 (3.9%) | 217 (5.3%) |
| $1,000 to $1,499 | 1,214 (13.3%) | 954 (23.3%) |
| $1,500 to $1,999 | 1,530 (16.8%) | 1,561 (38.1%) |
| $2,000 to $2,499 | 1,744 (19.1%) | 538 (13.1%) |
| $2,500 to $2,999 | 1,556 (17.1%) | 192 (4.7%) |
| $3,000 or more | 1,184 (13.0%) | 121 (2.9%) |
| Total | 9,126 (100.0%) | 4,095 (100.0%) |
Physical Housing Characteristics in Brighton
Housing Structures in Brighton
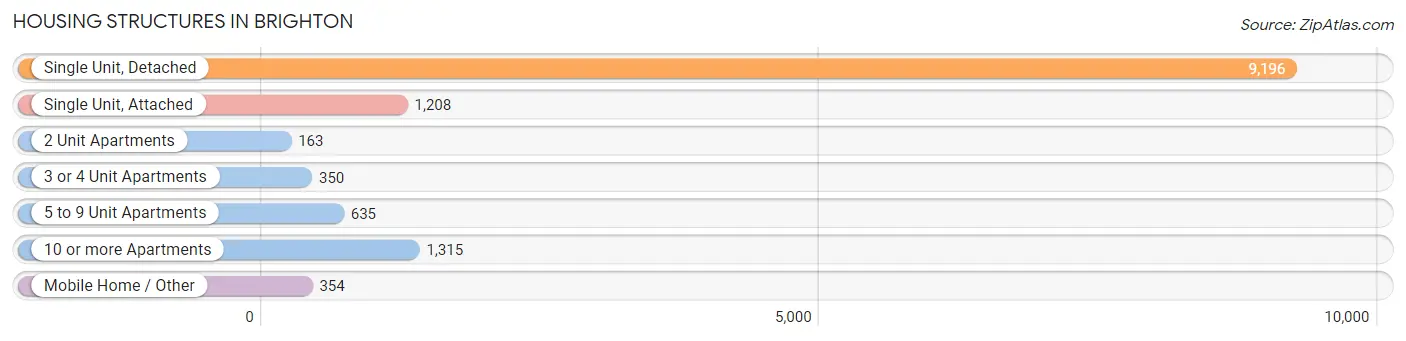
| Structure Type | # Housing Units | % Housing Units |
| Single Unit, Detached | 9,196 | 69.6% |
| Single Unit, Attached | 1,208 | 9.1% |
| 2 Unit Apartments | 163 | 1.2% |
| 3 or 4 Unit Apartments | 350 | 2.6% |
| 5 to 9 Unit Apartments | 635 | 4.8% |
| 10 or more Apartments | 1,315 | 10.0% |
| Mobile Home / Other | 354 | 2.7% |
| Total | 13,221 | 100.0% |
Housing Structures by Occupancy in Brighton
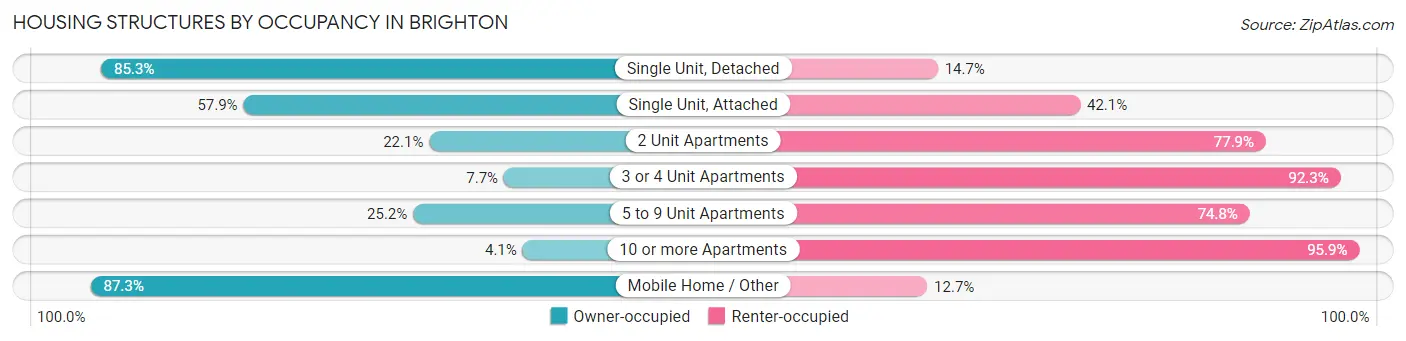
| Structure Type | Owner-occupied | Renter-occupied |
| Single Unit, Detached | 7,841 (85.3%) | 1,355 (14.7%) |
| Single Unit, Attached | 699 (57.9%) | 509 (42.1%) |
| 2 Unit Apartments | 36 (22.1%) | 127 (77.9%) |
| 3 or 4 Unit Apartments | 27 (7.7%) | 323 (92.3%) |
| 5 to 9 Unit Apartments | 160 (25.2%) | 475 (74.8%) |
| 10 or more Apartments | 54 (4.1%) | 1,261 (95.9%) |
| Mobile Home / Other | 309 (87.3%) | 45 (12.7%) |
| Total | 9,126 (69.0%) | 4,095 (31.0%) |
Housing Structures by Number of Rooms in Brighton
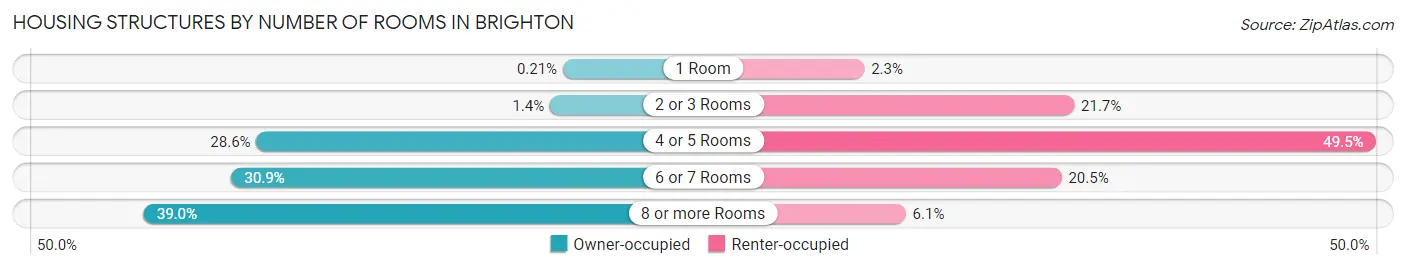
| Number of Rooms | Owner-occupied | Renter-occupied |
| 1 Room | 19 (0.2%) | 92 (2.2%) |
| 2 or 3 Rooms | 128 (1.4%) | 887 (21.7%) |
| 4 or 5 Rooms | 2,606 (28.6%) | 2,028 (49.5%) |
| 6 or 7 Rooms | 2,817 (30.9%) | 839 (20.5%) |
| 8 or more Rooms | 3,556 (39.0%) | 249 (6.1%) |
| Total | 9,126 (100.0%) | 4,095 (100.0%) |
Housing Structure by Heating Type in Brighton
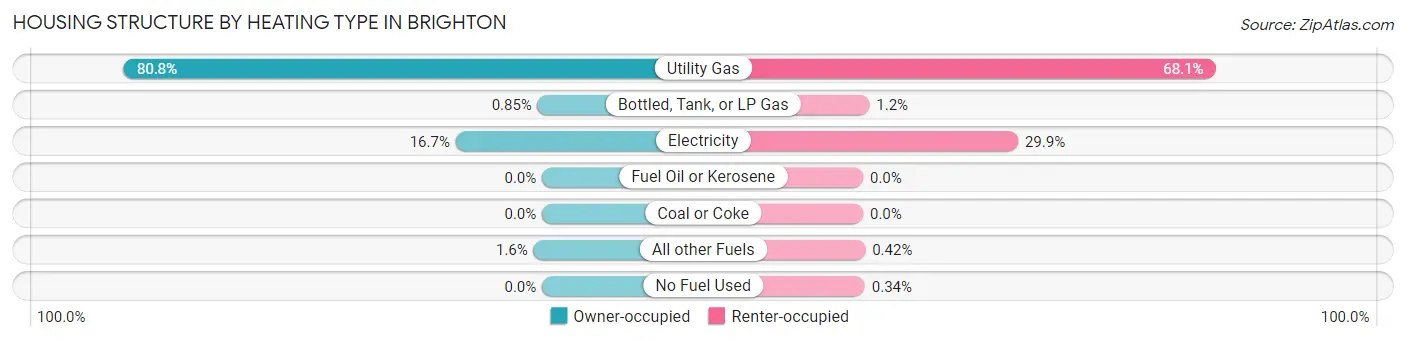
| Heating Type | Owner-occupied | Renter-occupied |
| Utility Gas | 7,375 (80.8%) | 2,788 (68.1%) |
| Bottled, Tank, or LP Gas | 78 (0.9%) | 50 (1.2%) |
| Electricity | 1,523 (16.7%) | 1,226 (29.9%) |
| Fuel Oil or Kerosene | 0 (0.0%) | 0 (0.0%) |
| Coal or Coke | 0 (0.0%) | 0 (0.0%) |
| All other Fuels | 150 (1.6%) | 17 (0.4%) |
| No Fuel Used | 0 (0.0%) | 14 (0.3%) |
| Total | 9,126 (100.0%) | 4,095 (100.0%) |
Household Vehicle Usage in Brighton
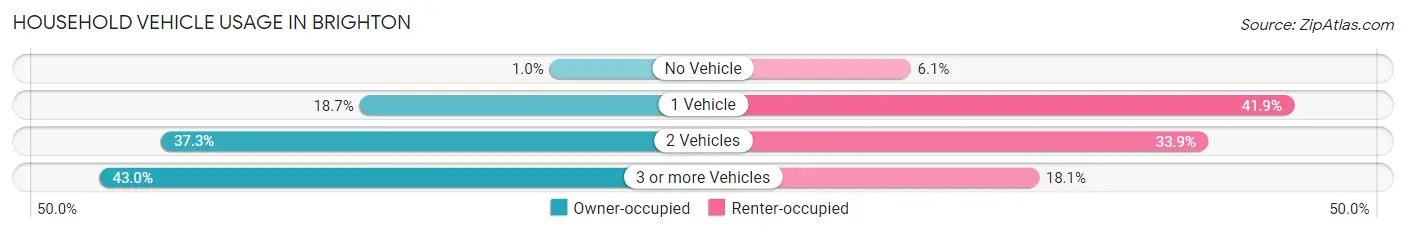
| Vehicles per Household | Owner-occupied | Renter-occupied |
| No Vehicle | 91 (1.0%) | 251 (6.1%) |
| 1 Vehicle | 1,710 (18.7%) | 1,716 (41.9%) |
| 2 Vehicles | 3,401 (37.3%) | 1,387 (33.9%) |
| 3 or more Vehicles | 3,924 (43.0%) | 741 (18.1%) |
| Total | 9,126 (100.0%) | 4,095 (100.0%) |
Real Estate & Mortgages in Brighton
Real Estate and Mortgage Overview in Brighton
| Characteristic | Without Mortgage | With Mortgage |
| Housing Units | 2,013 | 7,113 |
| Median Property Value | $376,300 | $440,200 |
| Median Household Income | $78,527 | $2,259 |
| Monthly Housing Costs | $586 | $1,184 |
| Real Estate Taxes | $2,079 | $106 |
Property Value by Mortgage Status in Brighton
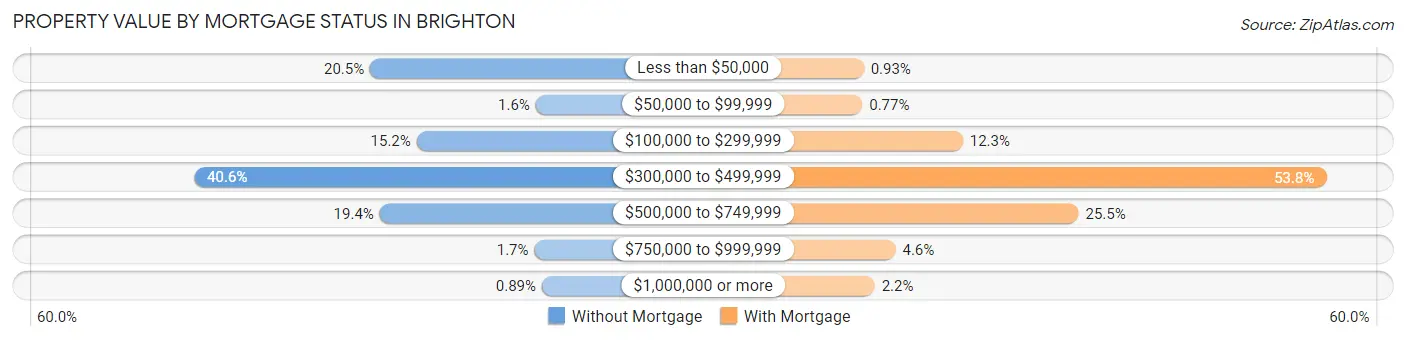
| Property Value | Without Mortgage | With Mortgage |
| Less than $50,000 | 413 (20.5%) | 66 (0.9%) |
| $50,000 to $99,999 | 32 (1.6%) | 55 (0.8%) |
| $100,000 to $299,999 | 306 (15.2%) | 872 (12.3%) |
| $300,000 to $499,999 | 818 (40.6%) | 3,826 (53.8%) |
| $500,000 to $749,999 | 391 (19.4%) | 1,813 (25.5%) |
| $750,000 to $999,999 | 35 (1.7%) | 325 (4.6%) |
| $1,000,000 or more | 18 (0.9%) | 156 (2.2%) |
| Total | 2,013 (100.0%) | 7,113 (100.0%) |
Household Income by Mortgage Status in Brighton
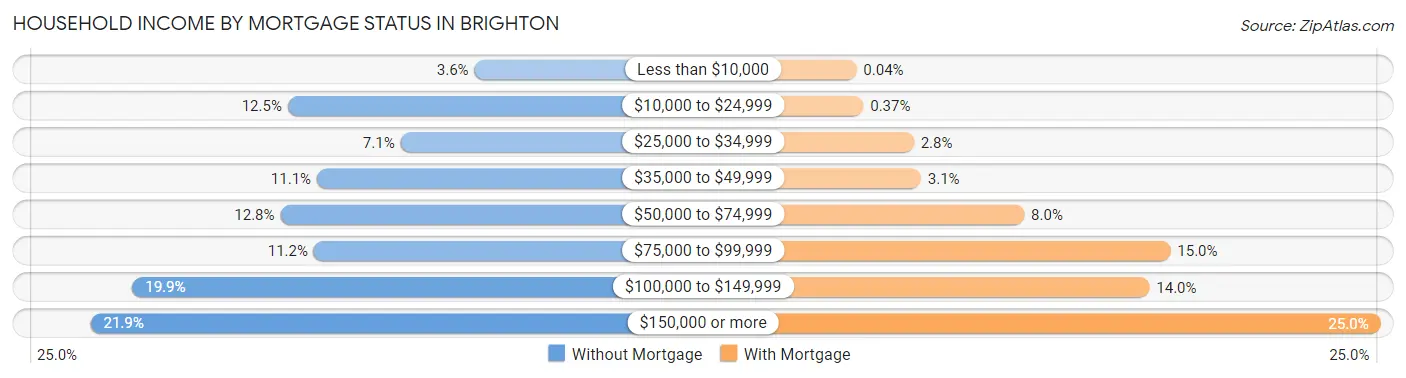
| Household Income | Without Mortgage | With Mortgage |
| Less than $10,000 | 72 (3.6%) | 3 (0.0%) |
| $10,000 to $24,999 | 251 (12.5%) | 26 (0.4%) |
| $25,000 to $34,999 | 143 (7.1%) | 197 (2.8%) |
| $35,000 to $49,999 | 223 (11.1%) | 221 (3.1%) |
| $50,000 to $74,999 | 258 (12.8%) | 571 (8.0%) |
| $75,000 to $99,999 | 226 (11.2%) | 1,066 (15.0%) |
| $100,000 to $149,999 | 400 (19.9%) | 995 (14.0%) |
| $150,000 or more | 440 (21.9%) | 1,778 (25.0%) |
| Total | 2,013 (100.0%) | 7,113 (100.0%) |
Property Value to Household Income Ratio in Brighton
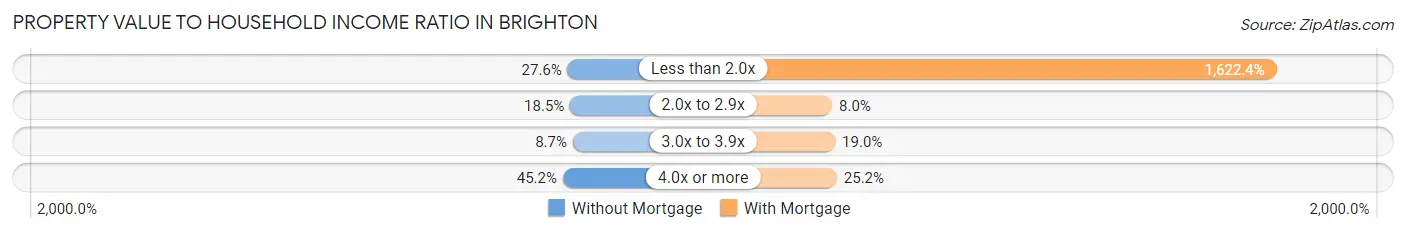
| Value-to-Income Ratio | Without Mortgage | With Mortgage |
| Less than 2.0x | 556 (27.6%) | 115,399 (1,622.4%) |
| 2.0x to 2.9x | 372 (18.5%) | 570 (8.0%) |
| 3.0x to 3.9x | 176 (8.7%) | 1,353 (19.0%) |
| 4.0x or more | 909 (45.2%) | 1,789 (25.2%) |
| Total | 2,013 (100.0%) | 7,113 (100.0%) |
Real Estate Taxes by Mortgage Status in Brighton
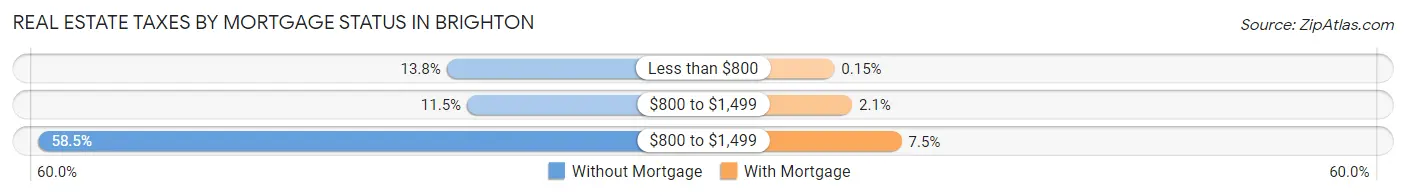
| Property Taxes | Without Mortgage | With Mortgage |
| Less than $800 | 277 (13.8%) | 11 (0.2%) |
| $800 to $1,499 | 232 (11.5%) | 149 (2.1%) |
| $800 to $1,499 | 1,177 (58.5%) | 534 (7.5%) |
| Total | 2,013 (100.0%) | 7,113 (100.0%) |
Health & Disability in Brighton
Health Insurance Coverage by Age in Brighton
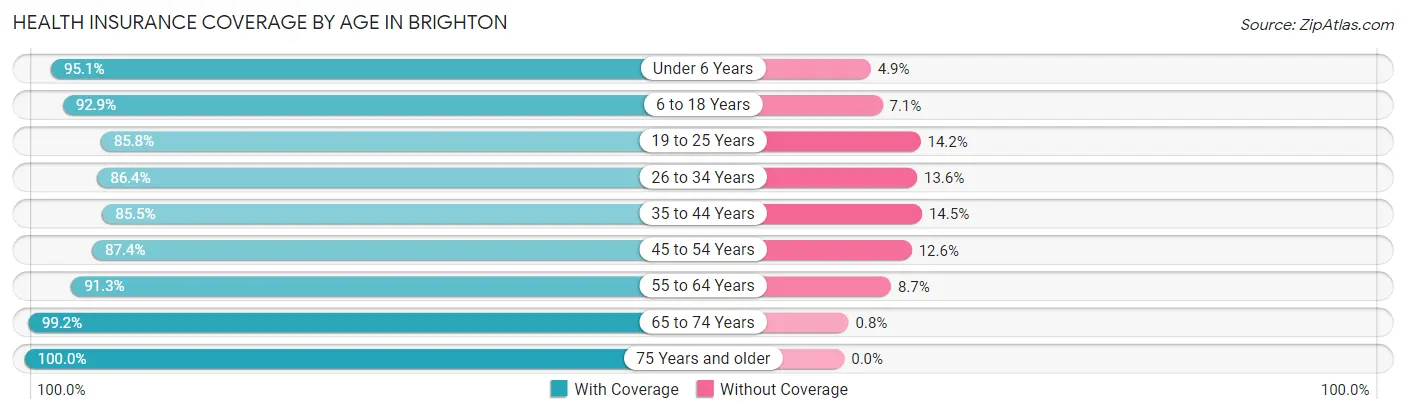
| Age Bracket | With Coverage | Without Coverage |
| Under 6 Years | 3,020 (95.1%) | 157 (4.9%) |
| 6 to 18 Years | 7,896 (92.9%) | 606 (7.1%) |
| 19 to 25 Years | 2,540 (85.8%) | 421 (14.2%) |
| 26 to 34 Years | 4,646 (86.4%) | 729 (13.6%) |
| 35 to 44 Years | 4,857 (85.5%) | 823 (14.5%) |
| 45 to 54 Years | 4,502 (87.4%) | 648 (12.6%) |
| 55 to 64 Years | 4,272 (91.3%) | 407 (8.7%) |
| 65 to 74 Years | 2,342 (99.2%) | 19 (0.8%) |
| 75 Years and older | 1,531 (100.0%) | 0 (0.0%) |
| Total | 35,606 (90.3%) | 3,810 (9.7%) |
Health Insurance Coverage by Citizenship Status in Brighton
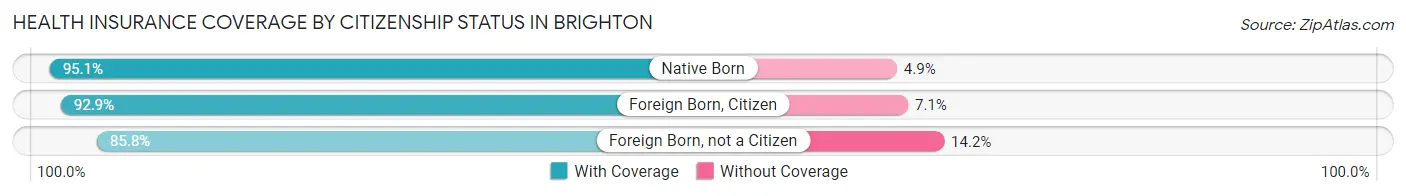
| Citizenship Status | With Coverage | Without Coverage |
| Native Born | 3,020 (95.1%) | 157 (4.9%) |
| Foreign Born, Citizen | 7,896 (92.9%) | 606 (7.1%) |
| Foreign Born, not a Citizen | 2,540 (85.8%) | 421 (14.2%) |
Health Insurance Coverage by Household Income in Brighton
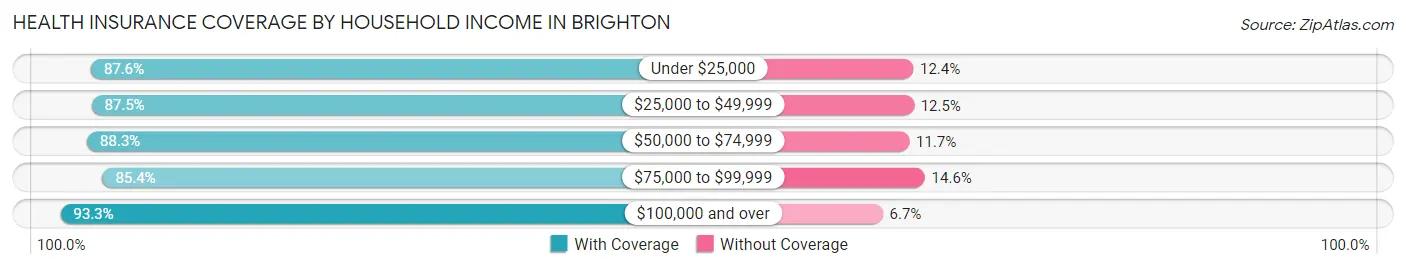
| Household Income | With Coverage | Without Coverage |
| Under $25,000 | 2,646 (87.6%) | 375 (12.4%) |
| $25,000 to $49,999 | 3,951 (87.5%) | 566 (12.5%) |
| $50,000 to $74,999 | 5,916 (88.3%) | 782 (11.7%) |
| $75,000 to $99,999 | 4,251 (85.4%) | 726 (14.6%) |
| $100,000 and over | 18,784 (93.3%) | 1,352 (6.7%) |
Public vs Private Health Insurance Coverage by Age in Brighton
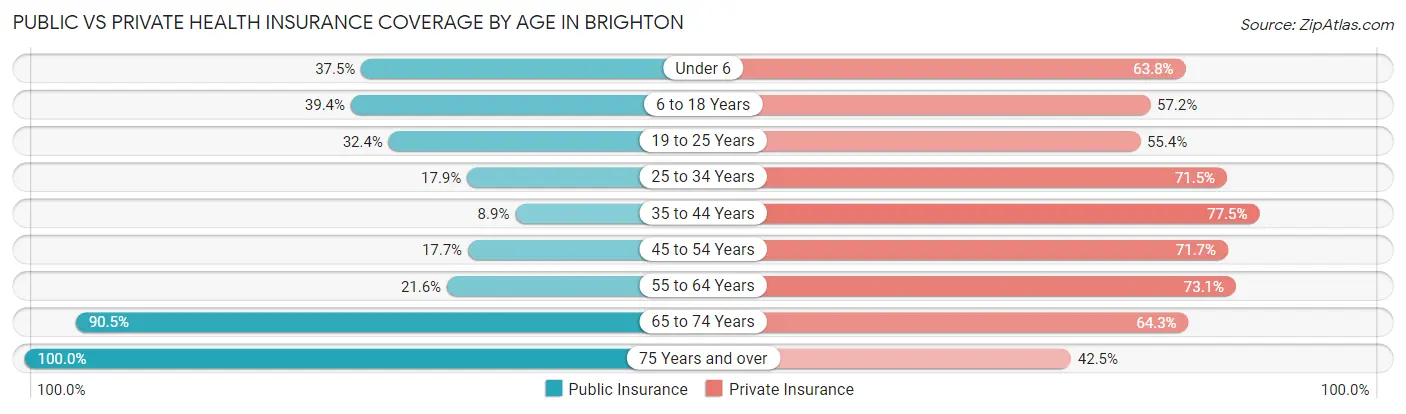
| Age Bracket | Public Insurance | Private Insurance |
| Under 6 | 1,192 (37.5%) | 2,026 (63.8%) |
| 6 to 18 Years | 3,353 (39.4%) | 4,864 (57.2%) |
| 19 to 25 Years | 960 (32.4%) | 1,639 (55.3%) |
| 25 to 34 Years | 960 (17.9%) | 3,842 (71.5%) |
| 35 to 44 Years | 507 (8.9%) | 4,402 (77.5%) |
| 45 to 54 Years | 912 (17.7%) | 3,690 (71.7%) |
| 55 to 64 Years | 1,011 (21.6%) | 3,422 (73.1%) |
| 65 to 74 Years | 2,137 (90.5%) | 1,519 (64.3%) |
| 75 Years and over | 1,531 (100.0%) | 651 (42.5%) |
| Total | 12,563 (31.9%) | 26,055 (66.1%) |
Disability Status by Sex by Age in Brighton
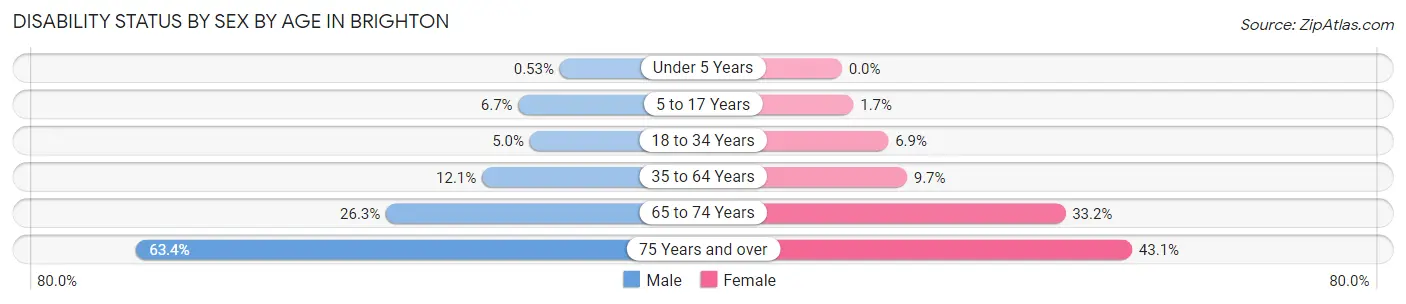
| Age Bracket | Male | Female |
| Under 5 Years | 8 (0.5%) | 0 (0.0%) |
| 5 to 17 Years | 299 (6.7%) | 70 (1.7%) |
| 18 to 34 Years | 230 (5.0%) | 289 (6.9%) |
| 35 to 64 Years | 954 (12.1%) | 733 (9.7%) |
| 65 to 74 Years | 239 (26.3%) | 482 (33.2%) |
| 75 Years and over | 357 (63.4%) | 417 (43.1%) |
Disability Class by Sex by Age in Brighton
Disability Class: Hearing Difficulty
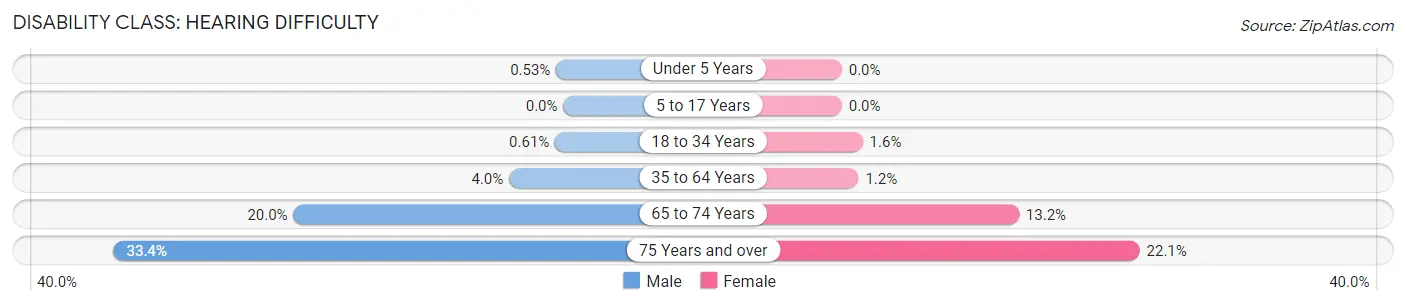
| Age Bracket | Male | Female |
| Under 5 Years | 8 (0.5%) | 0 (0.0%) |
| 5 to 17 Years | 0 (0.0%) | 0 (0.0%) |
| 18 to 34 Years | 28 (0.6%) | 65 (1.5%) |
| 35 to 64 Years | 319 (4.0%) | 94 (1.2%) |
| 65 to 74 Years | 182 (20.0%) | 191 (13.2%) |
| 75 Years and over | 188 (33.4%) | 214 (22.1%) |
Disability Class: Vision Difficulty
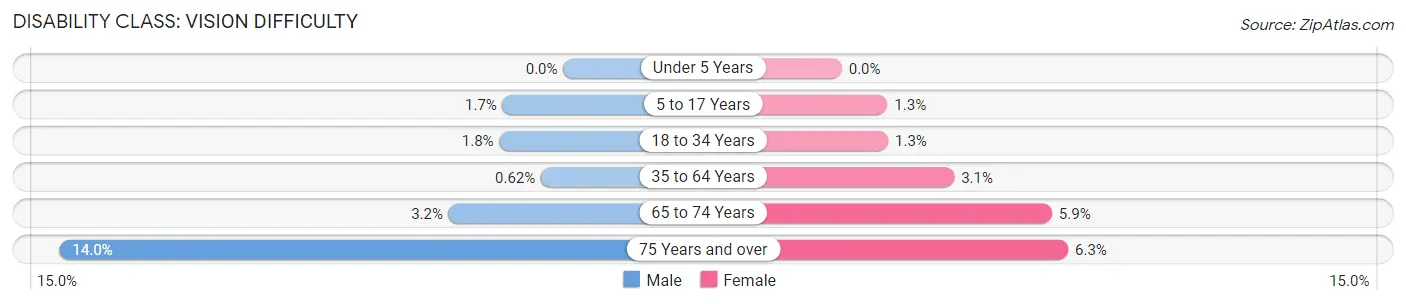
| Age Bracket | Male | Female |
| Under 5 Years | 0 (0.0%) | 0 (0.0%) |
| 5 to 17 Years | 76 (1.7%) | 52 (1.3%) |
| 18 to 34 Years | 82 (1.8%) | 54 (1.3%) |
| 35 to 64 Years | 49 (0.6%) | 238 (3.1%) |
| 65 to 74 Years | 29 (3.2%) | 85 (5.9%) |
| 75 Years and over | 79 (14.0%) | 61 (6.3%) |
Disability Class: Cognitive Difficulty
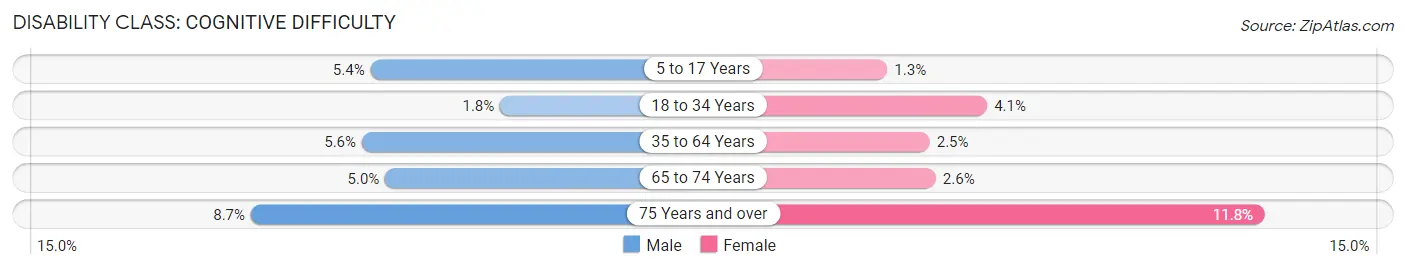
| Age Bracket | Male | Female |
| 5 to 17 Years | 241 (5.4%) | 52 (1.3%) |
| 18 to 34 Years | 81 (1.8%) | 170 (4.1%) |
| 35 to 64 Years | 444 (5.6%) | 186 (2.5%) |
| 65 to 74 Years | 45 (5.0%) | 38 (2.6%) |
| 75 Years and over | 49 (8.7%) | 114 (11.8%) |
Disability Class: Ambulatory Difficulty
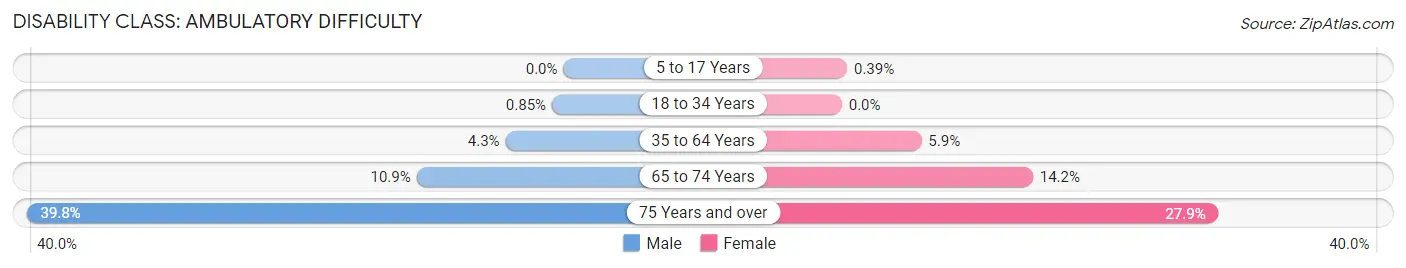
| Age Bracket | Male | Female |
| 5 to 17 Years | 0 (0.0%) | 16 (0.4%) |
| 18 to 34 Years | 39 (0.9%) | 0 (0.0%) |
| 35 to 64 Years | 340 (4.3%) | 449 (5.9%) |
| 65 to 74 Years | 99 (10.9%) | 206 (14.2%) |
| 75 Years and over | 224 (39.8%) | 270 (27.9%) |
Disability Class: Self-Care Difficulty
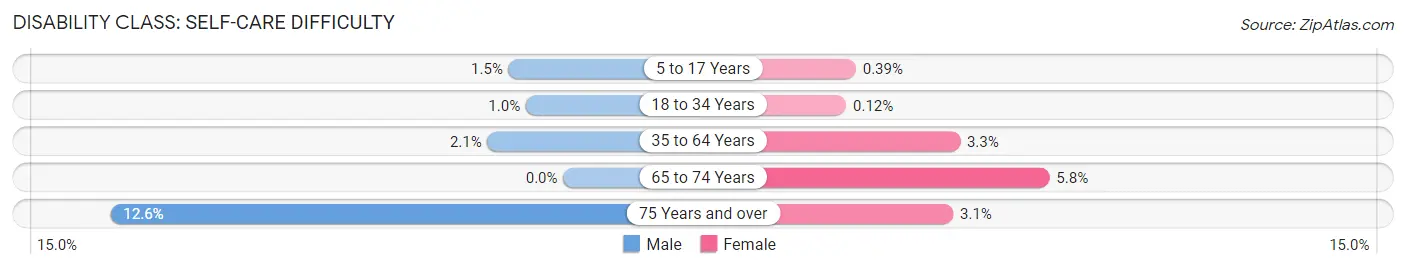
| Age Bracket | Male | Female |
| 5 to 17 Years | 68 (1.5%) | 16 (0.4%) |
| 18 to 34 Years | 48 (1.0%) | 5 (0.1%) |
| 35 to 64 Years | 167 (2.1%) | 250 (3.3%) |
| 65 to 74 Years | 0 (0.0%) | 84 (5.8%) |
| 75 Years and over | 71 (12.6%) | 30 (3.1%) |
Technology Access in Brighton
Computing Device Access in Brighton
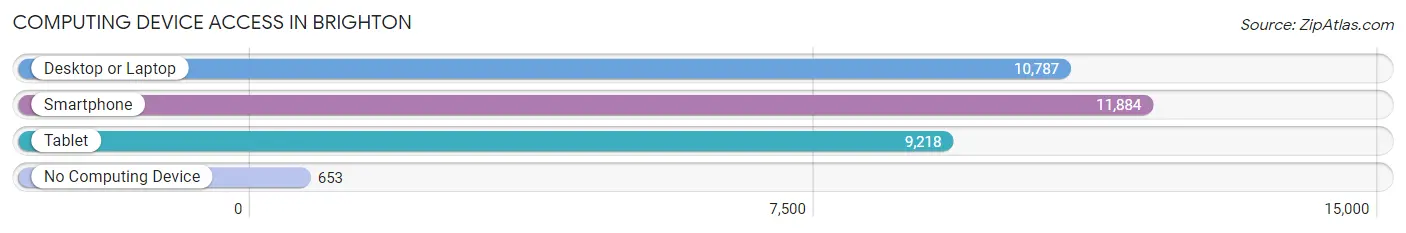
| Device Type | # Households | % Households |
| Desktop or Laptop | 10,787 | 81.6% |
| Smartphone | 11,884 | 89.9% |
| Tablet | 9,218 | 69.7% |
| No Computing Device | 653 | 4.9% |
| Total | 13,221 | 100.0% |
Internet Access in Brighton
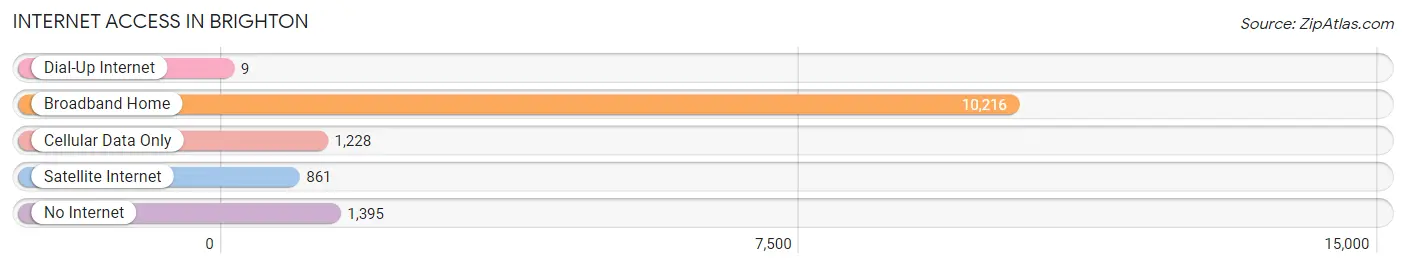
| Internet Type | # Households | % Households |
| Dial-Up Internet | 9 | 0.1% |
| Broadband Home | 10,216 | 77.3% |
| Cellular Data Only | 1,228 | 9.3% |
| Satellite Internet | 861 | 6.5% |
| No Internet | 1,395 | 10.5% |
| Total | 13,221 | 100.0% |
Brighton Summary
Brighton, Colorado is a city located in Adams County, Colorado, United States. It is a suburb of Denver and is located approximately 20 miles northeast of the city. As of the 2010 census, the population of Brighton was 30,521.
History
The area that is now Brighton was originally inhabited by the Arapaho and Cheyenne Native American tribes. The first settlers in the area were the Goldrick family, who arrived in 1859. The Goldricks built a log cabin and began farming the land.
In 1870, the town of Brighton was founded by John A. Brighton, a former Union Army soldier. The town was named after him and was incorporated in 1887.
In the late 19th century, Brighton was a small agricultural community. The town was known for its sugar beet production and was home to several sugar beet processing plants.
In the early 20th century, Brighton began to grow rapidly. The town was connected to Denver by the Denver and Interurban Railroad in 1908. This allowed for easy access to the city and helped to spur growth.
In the 1950s, Brighton experienced a population boom as people moved to the area from other parts of the country. This growth continued into the 1960s and 1970s.
Geography
Brighton is located in Adams County, Colorado, approximately 20 miles northeast of Denver. The city is situated at an elevation of 5,082 feet above sea level.
The city covers an area of 11.2 square miles and is bordered by the cities of Thornton, Commerce City, and Northglenn. The city is located in the South Platte River Valley and is surrounded by rolling hills and prairies.
Economy
Brighton’s economy is largely based on agriculture and manufacturing. The city is home to several large agricultural companies, including Leprino Foods, which produces cheese and other dairy products.
The city is also home to several manufacturing companies, including the Ball Corporation, which produces metal cans and containers.
Brighton is also home to several retail stores, restaurants, and other businesses. The city is home to the Prairie Center Shopping Center, which is the largest shopping center in the city.
Demographics
As of the 2010 census, the population of Brighton was 30,521. The racial makeup of the city was 77.3% White, 1.7% African American, 0.7% Native American, 1.2% Asian, 0.1% Pacific Islander, 16.2% from other races, and 3.0% from two or more races. Hispanic or Latino of any race were 33.2% of the population.
The median household income in Brighton was $60,945 and the median family income was $68,945. The per capita income for the city was $25,945.
Conclusion
Brighton, Colorado is a city located in Adams County, Colorado, United States. It is a suburb of Denver and is located approximately 20 miles northeast of the city. As of the 2010 census, the population of Brighton was 30,521. The city’s economy is largely based on agriculture and manufacturing. The city is also home to several retail stores, restaurants, and other businesses. The racial makeup of the city was 77.3% White, 1.7% African American, 0.7% Native American, 1.2% Asian, 0.1% Pacific Islander, 16.2% from other races, and 3.0% from two or more races. Hispanic or Latino of any race were 33.2% of the population. Brighton is a vibrant city with a rich history and a bright future.
Common Questions
What is Per Capita Income in Brighton?
Per Capita income in Brighton is $37,177.
What is the Median Family Income in Brighton?
Median Family Income in Brighton is $101,669.
What is the Median Household income in Brighton?
Median Household Income in Brighton is $86,975.
What is Income or Wage Gap in Brighton?
Income or Wage Gap in Brighton is 22.5%.
Women in Brighton earn 77.5 cents for every dollar earned by a man.
What is Family Income Deficit in Brighton?
Family Income Deficit in Brighton is $10,735.
Families that are below poverty line in Brighton earn $10,735 less on average than the poverty threshold level.
What is Inequality or Gini Index in Brighton?
Inequality or Gini Index in Brighton is 0.43.
What is the Total Population of Brighton?
Total Population of Brighton is 40,569.
What is the Total Male Population of Brighton?
Total Male Population of Brighton is 20,855.
What is the Total Female Population of Brighton?
Total Female Population of Brighton is 19,714.
What is the Ratio of Males per 100 Females in Brighton?
There are 105.79 Males per 100 Females in Brighton.
What is the Ratio of Females per 100 Males in Brighton?
There are 94.53 Females per 100 Males in Brighton.
What is the Median Population Age in Brighton?
Median Population Age in Brighton is 34.5 Years.
What is the Average Family Size in Brighton
Average Family Size in Brighton is 3.5 People.
What is the Average Household Size in Brighton
Average Household Size in Brighton is 3.0 People.
How Large is the Labor Force in Brighton?
There are 21,682 People in the Labor Forcein in Brighton.
What is the Percentage of People in the Labor Force in Brighton?
70.7% of People are in the Labor Force in Brighton.
What is the Unemployment Rate in Brighton?
Unemployment Rate in Brighton is 5.1%.