Glenwood Springs, CO Map & Demographics
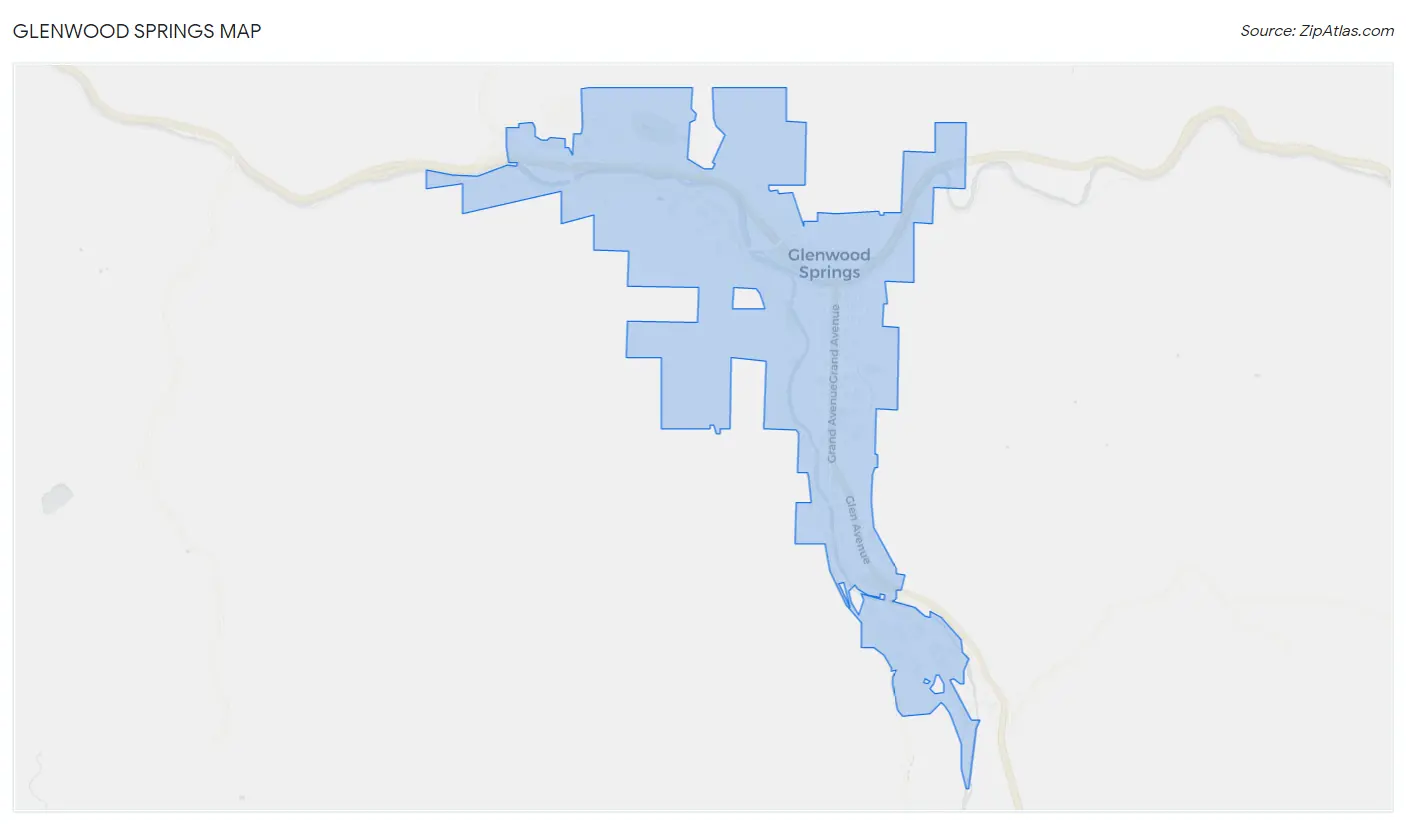
Glenwood Springs Map
Glenwood Springs Overview
$38,954
PER CAPITA INCOME
$99,245
AVG FAMILY INCOME
$80,806
AVG HOUSEHOLD INCOME
24.0%
WAGE / INCOME GAP [ % ]
76.0¢/ $1
WAGE / INCOME GAP [ $ ]
$6,772
FAMILY INCOME DEFICIT
0.41
INEQUALITY / GINI INDEX
10,100
TOTAL POPULATION
5,096
MALE POPULATION
5,004
FEMALE POPULATION
101.84
MALES / 100 FEMALES
98.19
FEMALES / 100 MALES
36.7
MEDIAN AGE
3.4
AVG FAMILY SIZE
2.5
AVG HOUSEHOLD SIZE
6,250
LABOR FORCE [ PEOPLE ]
75.1%
PERCENT IN LABOR FORCE
3.1%
UNEMPLOYMENT RATE
Glenwood Springs Zip Codes
Glenwood Springs Area Codes
Income in Glenwood Springs
Income Overview in Glenwood Springs
Per Capita Income in Glenwood Springs is $38,954, while median incomes of families and households are $99,245 and $80,806 respectively.
| Characteristic | Number | Measure |
| Per Capita Income | 10,100 | $38,954 |
| Median Family Income | 2,106 | $99,245 |
| Mean Family Income | 2,106 | $111,006 |
| Median Household Income | 3,901 | $80,806 |
| Mean Household Income | 3,901 | $93,659 |
| Income Deficit | 2,106 | $6,772 |
| Wage / Income Gap (%) | 10,100 | 23.97% |
| Wage / Income Gap ($) | 10,100 | 76.03¢ per $1 |
| Gini / Inequality Index | 10,100 | 0.41 |
Earnings by Sex in Glenwood Springs
Average Earnings in Glenwood Springs are $40,332, $45,885 for men and $34,886 for women, a difference of 24.0%.
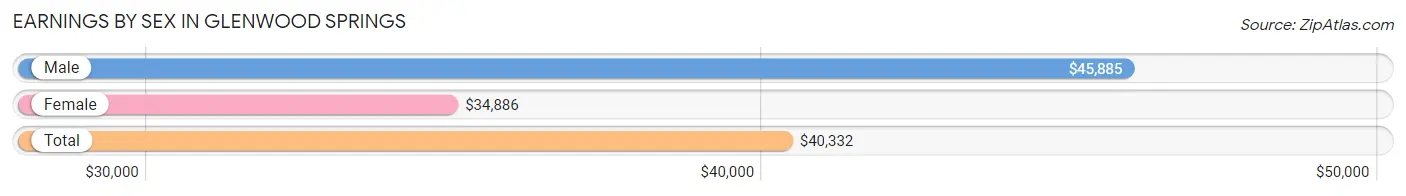
| Sex | Number | Average Earnings |
| Male | 3,658 (55.1%) | $45,885 |
| Female | 2,984 (44.9%) | $34,886 |
| Total | 6,642 (100.0%) | $40,332 |
Earnings by Sex by Income Bracket in Glenwood Springs
The most common earnings brackets in Glenwood Springs are $75,000 to $99,999 for men (418 | 11.4%) and $25,000 to $29,999 for women (326 | 10.9%).
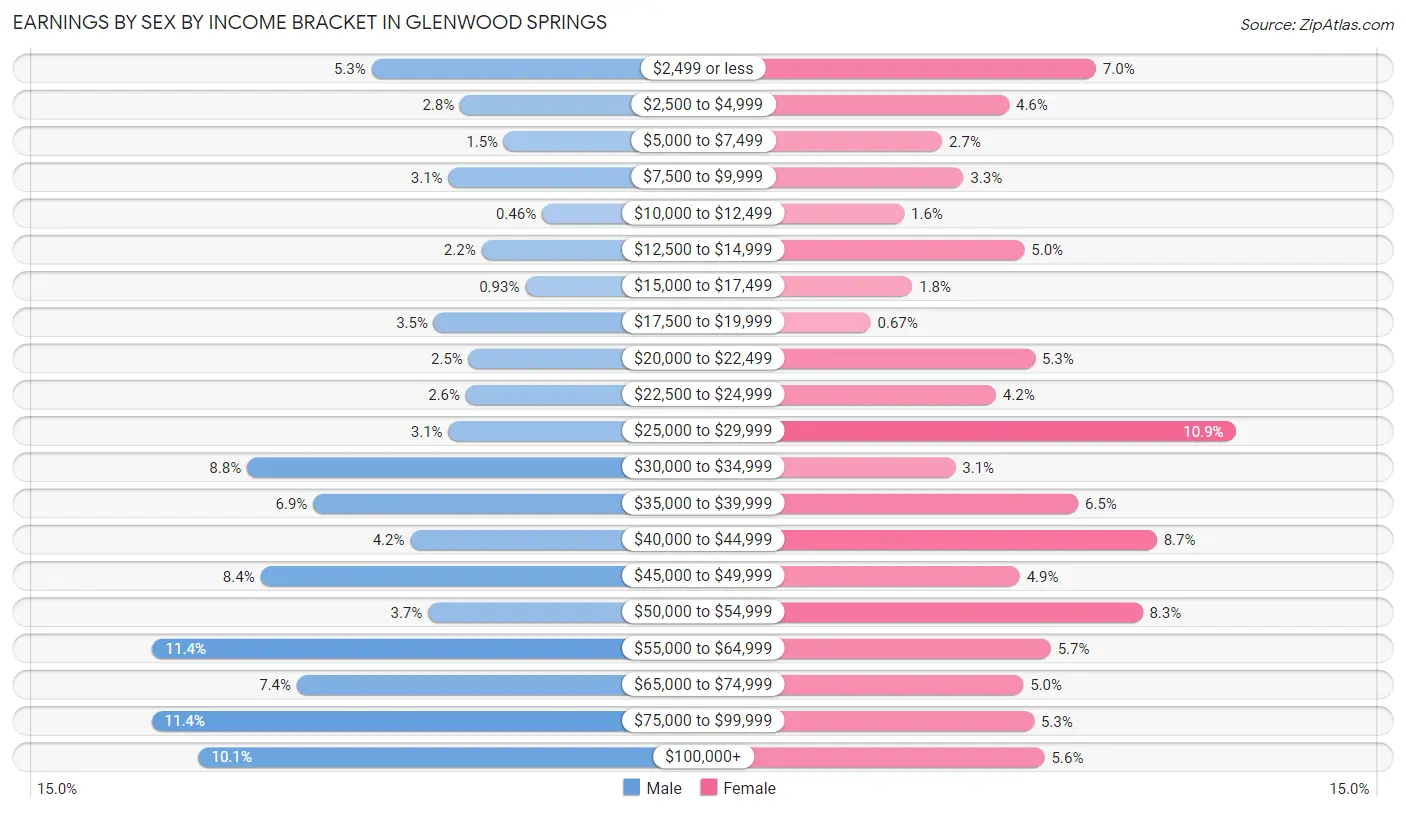
| Income | Male | Female |
| $2,499 or less | 192 (5.2%) | 209 (7.0%) |
| $2,500 to $4,999 | 101 (2.8%) | 136 (4.6%) |
| $5,000 to $7,499 | 56 (1.5%) | 80 (2.7%) |
| $7,500 to $9,999 | 113 (3.1%) | 98 (3.3%) |
| $10,000 to $12,499 | 17 (0.5%) | 48 (1.6%) |
| $12,500 to $14,999 | 79 (2.2%) | 149 (5.0%) |
| $15,000 to $17,499 | 34 (0.9%) | 55 (1.8%) |
| $17,500 to $19,999 | 128 (3.5%) | 20 (0.7%) |
| $20,000 to $22,499 | 92 (2.5%) | 158 (5.3%) |
| $22,500 to $24,999 | 95 (2.6%) | 125 (4.2%) |
| $25,000 to $29,999 | 113 (3.1%) | 326 (10.9%) |
| $30,000 to $34,999 | 320 (8.7%) | 91 (3.0%) |
| $35,000 to $39,999 | 252 (6.9%) | 194 (6.5%) |
| $40,000 to $44,999 | 152 (4.2%) | 260 (8.7%) |
| $45,000 to $49,999 | 306 (8.4%) | 145 (4.9%) |
| $50,000 to $54,999 | 134 (3.7%) | 248 (8.3%) |
| $55,000 to $64,999 | 417 (11.4%) | 171 (5.7%) |
| $65,000 to $74,999 | 269 (7.3%) | 148 (5.0%) |
| $75,000 to $99,999 | 418 (11.4%) | 157 (5.3%) |
| $100,000+ | 370 (10.1%) | 166 (5.6%) |
| Total | 3,658 (100.0%) | 2,984 (100.0%) |
Earnings by Sex by Educational Attainment in Glenwood Springs
Average earnings in Glenwood Springs are $51,719 for men and $38,295 for women, a difference of 26.0%. Men with an educational attainment of graduate degree enjoy the highest average annual earnings of $64,784, while those with high school diploma education earn the least with $37,221. Women with an educational attainment of graduate degree earn the most with the average annual earnings of $58,750, while those with college or associate's degree education have the smallest earnings of $31,688.
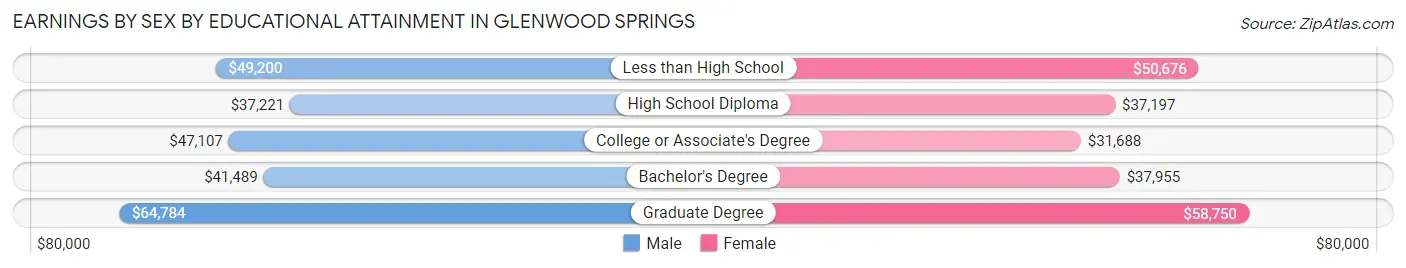
| Educational Attainment | Male Income | Female Income |
| Less than High School | $49,200 | $50,676 |
| High School Diploma | $37,221 | $37,197 |
| College or Associate's Degree | $47,107 | $31,688 |
| Bachelor's Degree | $41,489 | $37,955 |
| Graduate Degree | $64,784 | $58,750 |
| Total | $51,719 | $38,295 |
Family Income in Glenwood Springs
Family Income Brackets in Glenwood Springs
According to the Glenwood Springs family income data, there are 575 families falling into the $100,000 to $149,999 income range, which is the most common income bracket and makes up 27.3% of all families. Conversely, the $10,000 to $14,999 income bracket is the least frequent group with only 25 families (1.2%) belonging to this category.
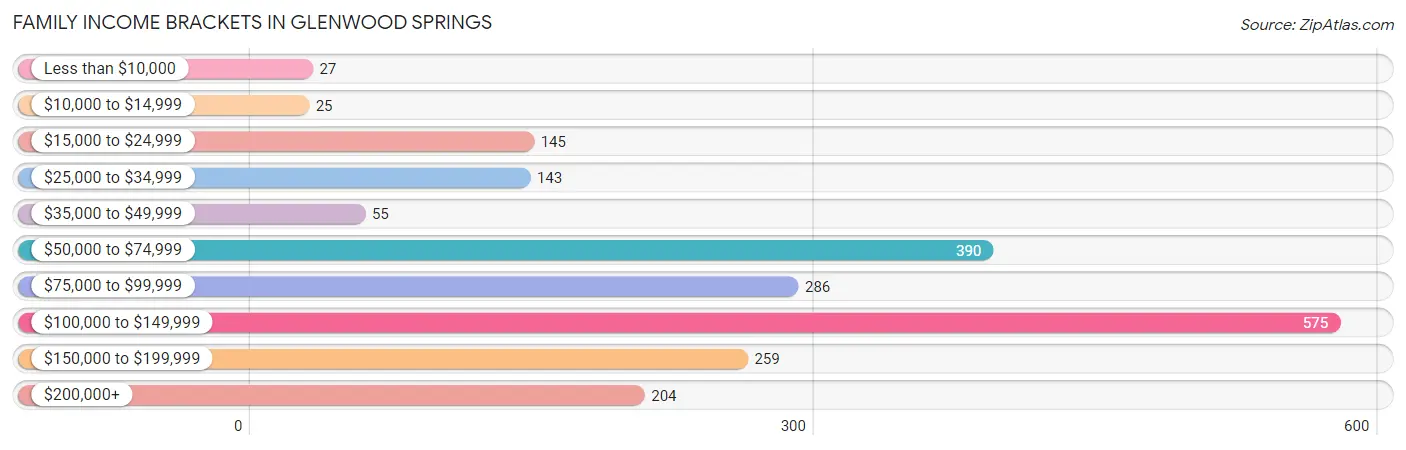
| Income Bracket | # Families | % Families |
| Less than $10,000 | 27 | 1.3% |
| $10,000 to $14,999 | 25 | 1.2% |
| $15,000 to $24,999 | 145 | 6.9% |
| $25,000 to $34,999 | 143 | 6.8% |
| $35,000 to $49,999 | 55 | 2.6% |
| $50,000 to $74,999 | 390 | 18.5% |
| $75,000 to $99,999 | 286 | 13.6% |
| $100,000 to $149,999 | 575 | 27.3% |
| $150,000 to $199,999 | 259 | 12.3% |
| $200,000+ | 204 | 9.7% |
Family Income by Famaliy Size in Glenwood Springs
6-person families (53 | 2.5%) account for the highest median family income in Glenwood Springs with $165,759 per family, while 3-person families (513 | 24.4%) have the highest median income of $35,144 per family member.
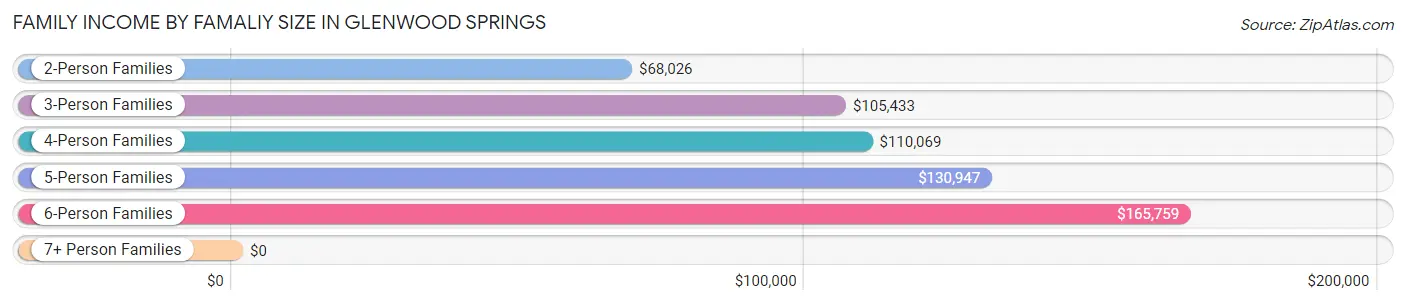
| Income Bracket | # Families | Median Income |
| 2-Person Families | 1,064 (50.5%) | $68,026 |
| 3-Person Families | 513 (24.4%) | $105,433 |
| 4-Person Families | 281 (13.3%) | $110,069 |
| 5-Person Families | 145 (6.9%) | $130,947 |
| 6-Person Families | 53 (2.5%) | $165,759 |
| 7+ Person Families | 50 (2.4%) | $0 |
| Total | 2,106 (100.0%) | $99,245 |
Family Income by Number of Earners in Glenwood Springs
The median family income in Glenwood Springs is $99,245, with families comprising 3+ earners (344) having the highest median family income of $130,833, while families with 1 earner (554) have the lowest median family income of $55,238, accounting for 16.3% and 26.3% of families, respectively.
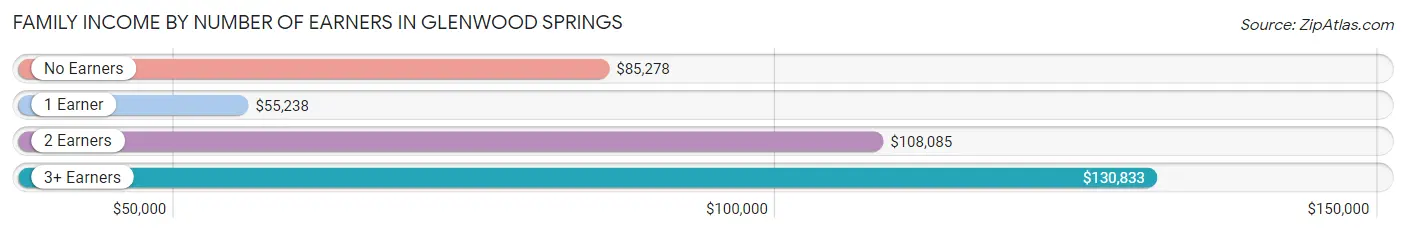
| Number of Earners | # Families | Median Income |
| No Earners | 148 (7.0%) | $85,278 |
| 1 Earner | 554 (26.3%) | $55,238 |
| 2 Earners | 1,060 (50.3%) | $108,085 |
| 3+ Earners | 344 (16.3%) | $130,833 |
| Total | 2,106 (100.0%) | $99,245 |
Household Income in Glenwood Springs
Household Income Brackets in Glenwood Springs
With 1,042 households falling in the category, the $100,000 to $149,999 income range is the most frequent in Glenwood Springs, accounting for 26.7% of all households. In contrast, only 144 households (3.7%) fall into the $10,000 to $14,999 income bracket, making it the least populous group.
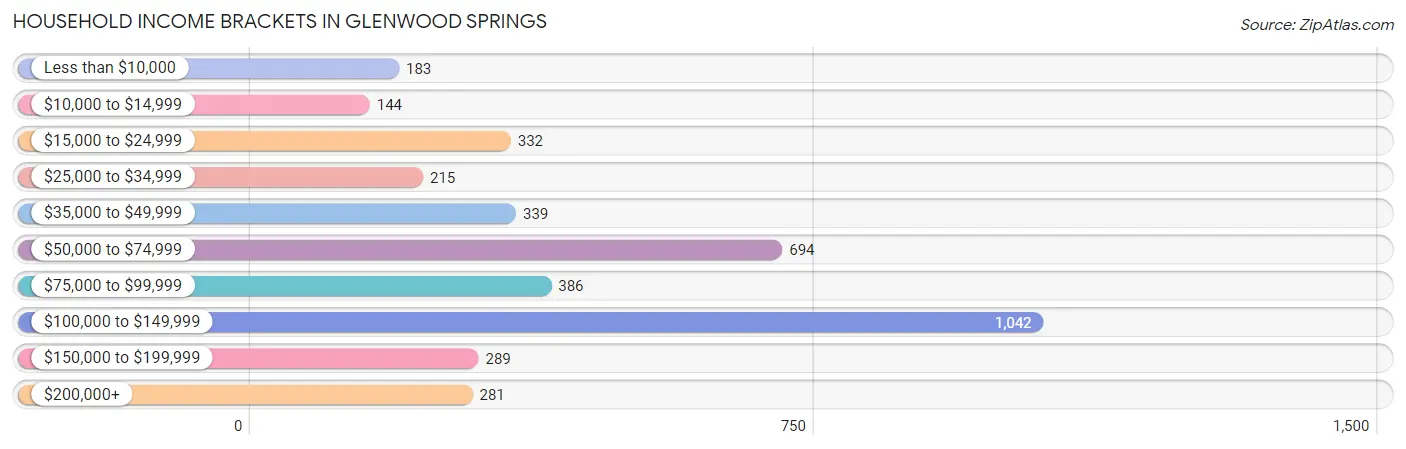
| Income Bracket | # Households | % Households |
| Less than $10,000 | 183 | 4.7% |
| $10,000 to $14,999 | 144 | 3.7% |
| $15,000 to $24,999 | 332 | 8.5% |
| $25,000 to $34,999 | 215 | 5.5% |
| $35,000 to $49,999 | 339 | 8.7% |
| $50,000 to $74,999 | 694 | 17.8% |
| $75,000 to $99,999 | 386 | 9.9% |
| $100,000 to $149,999 | 1,042 | 26.7% |
| $150,000 to $199,999 | 289 | 7.4% |
| $200,000+ | 281 | 7.2% |
Household Income by Householder Age in Glenwood Springs
The median household income in Glenwood Springs is $80,806, with the highest median household income of $94,639 found in the 45 to 64 years age bracket for the primary householder. A total of 1,331 households (34.1%) fall into this category. Meanwhile, the 15 to 24 years age bracket for the primary householder has the lowest median household income of $0, with 153 households (3.9%) in this group.
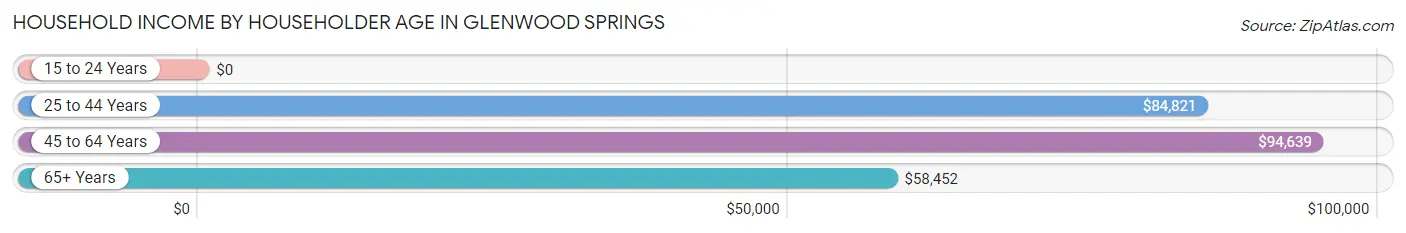
| Income Bracket | # Households | Median Income |
| 15 to 24 Years | 153 (3.9%) | $0 |
| 25 to 44 Years | 1,585 (40.6%) | $84,821 |
| 45 to 64 Years | 1,331 (34.1%) | $94,639 |
| 65+ Years | 832 (21.3%) | $58,452 |
| Total | 3,901 (100.0%) | $80,806 |
Poverty in Glenwood Springs
Income Below Poverty by Sex and Age in Glenwood Springs
With 7.1% poverty level for males and 9.9% for females among the residents of Glenwood Springs, 5 year old males and 75 year old and over females are the most vulnerable to poverty, with 36 males (66.7%) and 64 females (22.1%) in their respective age groups living below the poverty level.
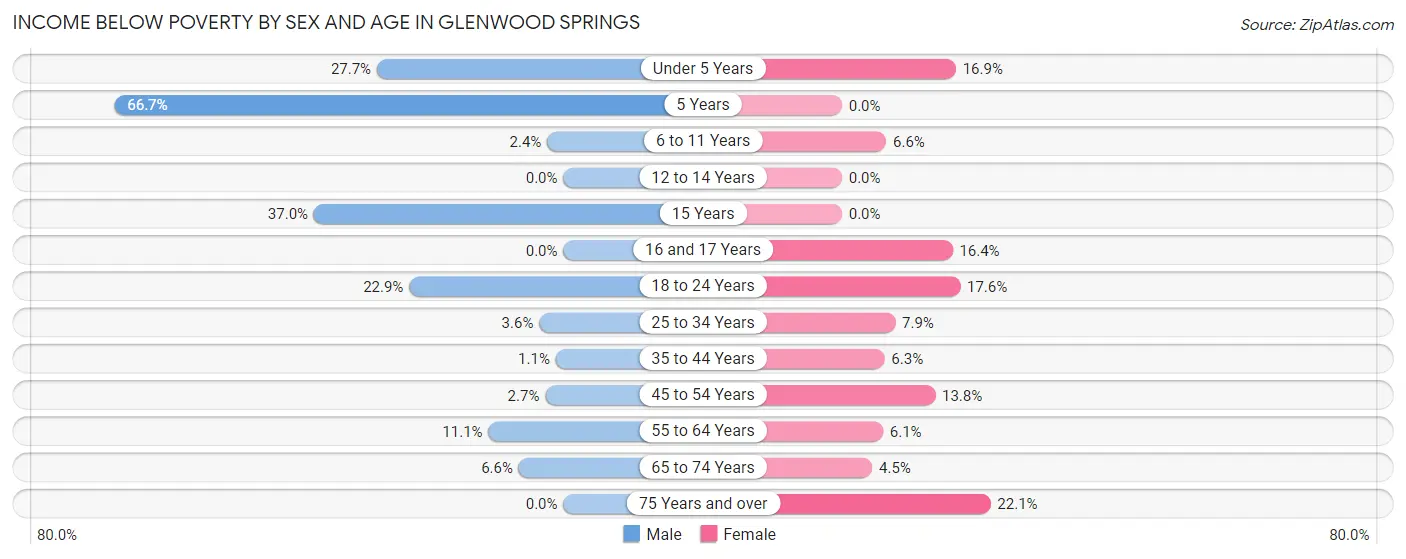
| Age Bracket | Male | Female |
| Under 5 Years | 62 (27.7%) | 44 (16.9%) |
| 5 Years | 36 (66.7%) | 0 (0.0%) |
| 6 to 11 Years | 8 (2.4%) | 21 (6.6%) |
| 12 to 14 Years | 0 (0.0%) | 0 (0.0%) |
| 15 Years | 10 (37.0%) | 0 (0.0%) |
| 16 and 17 Years | 0 (0.0%) | 46 (16.4%) |
| 18 to 24 Years | 76 (22.9%) | 92 (17.6%) |
| 25 to 34 Years | 34 (3.6%) | 56 (7.9%) |
| 35 to 44 Years | 11 (1.1%) | 48 (6.3%) |
| 45 to 54 Years | 14 (2.7%) | 66 (13.8%) |
| 55 to 64 Years | 73 (11.1%) | 35 (6.1%) |
| 65 to 74 Years | 25 (6.6%) | 20 (4.5%) |
| 75 Years and over | 0 (0.0%) | 64 (22.1%) |
| Total | 349 (7.1%) | 492 (9.9%) |
Income Above Poverty by Sex and Age in Glenwood Springs
According to the poverty statistics in Glenwood Springs, males aged 12 to 14 years and females aged 5 years are the age groups that are most secure financially, with 100.0% of males and 100.0% of females in these age groups living above the poverty line.
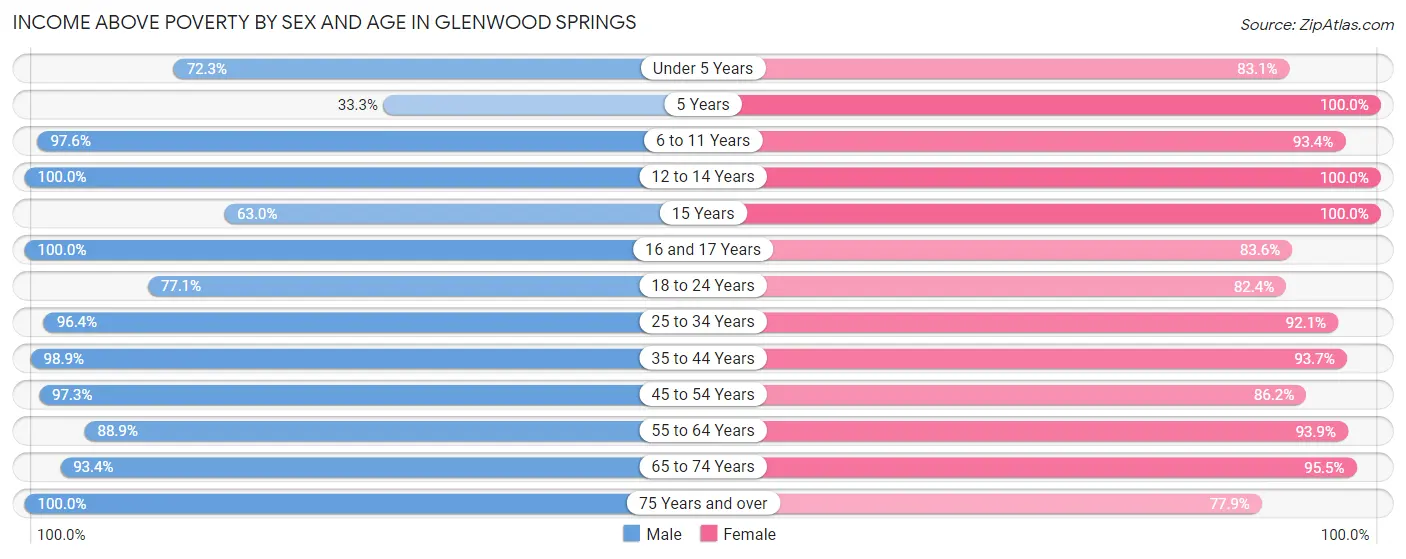
| Age Bracket | Male | Female |
| Under 5 Years | 162 (72.3%) | 216 (83.1%) |
| 5 Years | 18 (33.3%) | 25 (100.0%) |
| 6 to 11 Years | 325 (97.6%) | 298 (93.4%) |
| 12 to 14 Years | 156 (100.0%) | 252 (100.0%) |
| 15 Years | 17 (63.0%) | 57 (100.0%) |
| 16 and 17 Years | 132 (100.0%) | 234 (83.6%) |
| 18 to 24 Years | 256 (77.1%) | 432 (82.4%) |
| 25 to 34 Years | 917 (96.4%) | 651 (92.1%) |
| 35 to 44 Years | 960 (98.9%) | 710 (93.7%) |
| 45 to 54 Years | 507 (97.3%) | 411 (86.2%) |
| 55 to 64 Years | 583 (88.9%) | 539 (93.9%) |
| 65 to 74 Years | 353 (93.4%) | 424 (95.5%) |
| 75 Years and over | 192 (100.0%) | 226 (77.9%) |
| Total | 4,578 (92.9%) | 4,475 (90.1%) |
Income Below Poverty Among Married-Couple Families in Glenwood Springs
The poverty statistics for married-couple families in Glenwood Springs show that 3.6% or 53 of the total 1,453 families live below the poverty line. Families with 3 or 4 children have the highest poverty rate of 14.7%, comprising of 11 families. On the other hand, families with 5 or more children have the lowest poverty rate of 0.0%, which includes 0 families.
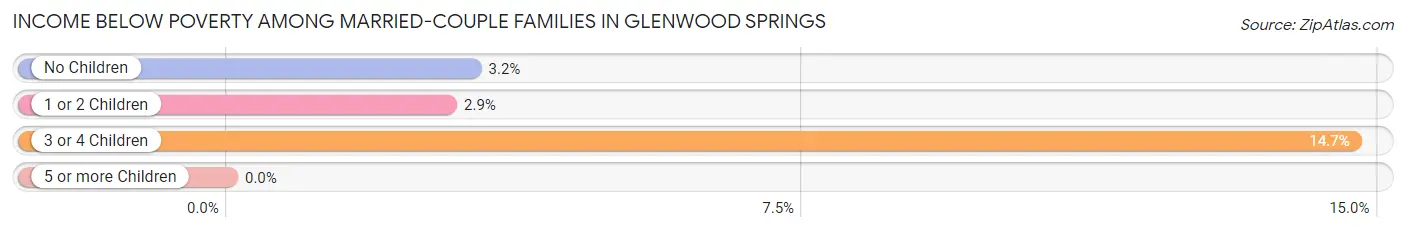
| Children | Above Poverty | Below Poverty |
| No Children | 822 (96.8%) | 27 (3.2%) |
| 1 or 2 Children | 509 (97.1%) | 15 (2.9%) |
| 3 or 4 Children | 64 (85.3%) | 11 (14.7%) |
| 5 or more Children | 5 (100.0%) | 0 (0.0%) |
| Total | 1,400 (96.4%) | 53 (3.6%) |
Income Below Poverty Among Single-Parent Households in Glenwood Springs
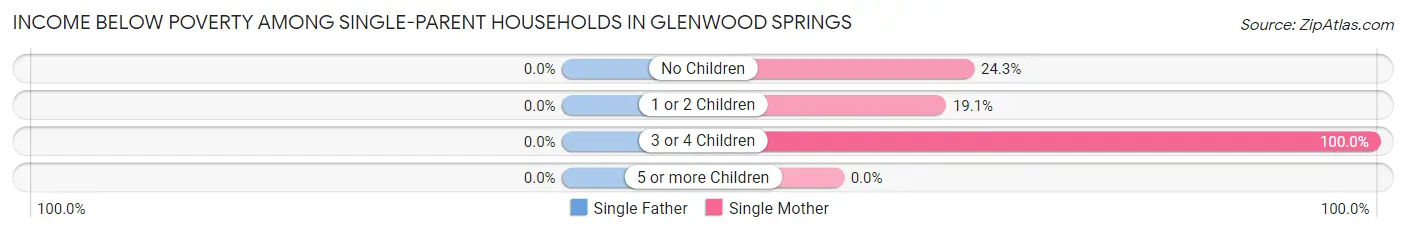
| Children | Single Father | Single Mother |
| No Children | 0 (0.0%) | 42 (24.3%) |
| 1 or 2 Children | 0 (0.0%) | 36 (19.1%) |
| 3 or 4 Children | 0 (0.0%) | 7 (100.0%) |
| 5 or more Children | 0 (0.0%) | 0 (0.0%) |
| Total | 0 (0.0%) | 85 (20.5%) |
Income Below Poverty Among Married-Couple vs Single-Parent Households in Glenwood Springs
The poverty data for Glenwood Springs shows that 53 of the married-couple family households (3.6%) and 85 of the single-parent households (13.0%) are living below the poverty level. Within the married-couple family households, those with 3 or 4 children have the highest poverty rate, with 11 households (14.7%) falling below the poverty line. Among the single-parent households, those with 3 or 4 children have the highest poverty rate, with 7 household (25.0%) living below poverty.
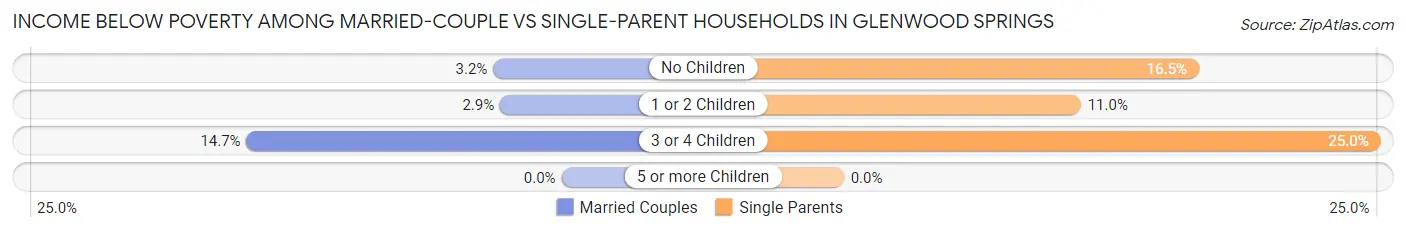
| Children | Married-Couple Families | Single-Parent Households |
| No Children | 27 (3.2%) | 42 (16.5%) |
| 1 or 2 Children | 15 (2.9%) | 36 (11.0%) |
| 3 or 4 Children | 11 (14.7%) | 7 (25.0%) |
| 5 or more Children | 0 (0.0%) | 0 (0.0%) |
| Total | 53 (3.6%) | 85 (13.0%) |
Race in Glenwood Springs
The most populous races in Glenwood Springs are White / Caucasian (6,555 | 64.9%), Hispanic or Latino (3,396 | 33.6%), and Some other Race (1,602 | 15.9%).
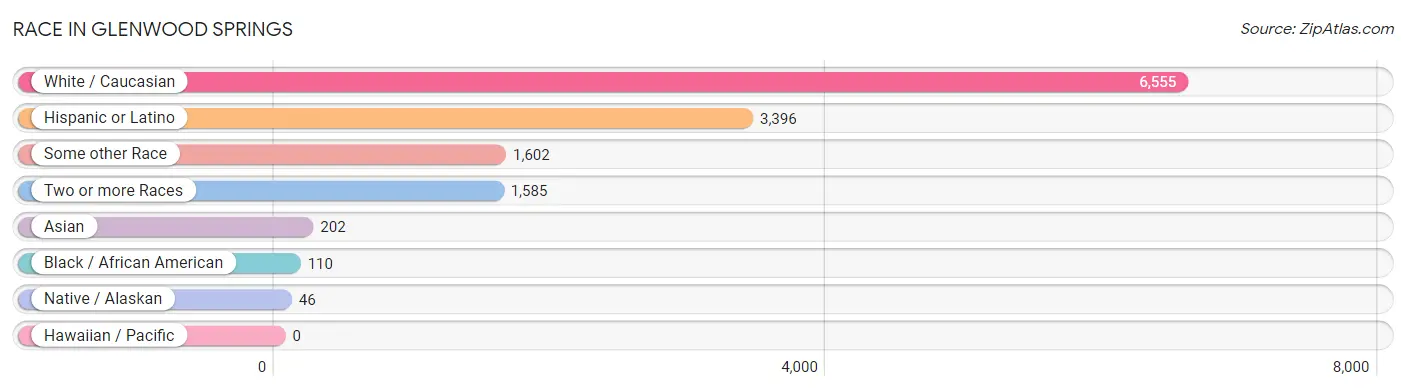
| Race | # Population | % Population |
| Asian | 202 | 2.0% |
| Black / African American | 110 | 1.1% |
| Hawaiian / Pacific | 0 | 0.0% |
| Hispanic or Latino | 3,396 | 33.6% |
| Native / Alaskan | 46 | 0.5% |
| White / Caucasian | 6,555 | 64.9% |
| Two or more Races | 1,585 | 15.7% |
| Some other Race | 1,602 | 15.9% |
| Total | 10,100 | 100.0% |
Ancestry in Glenwood Springs
The most populous ancestries reported in Glenwood Springs are Mexican (2,340 | 23.2%), English (1,171 | 11.6%), German (1,012 | 10.0%), Irish (793 | 7.9%), and European (475 | 4.7%), together accounting for 57.3% of all Glenwood Springs residents.
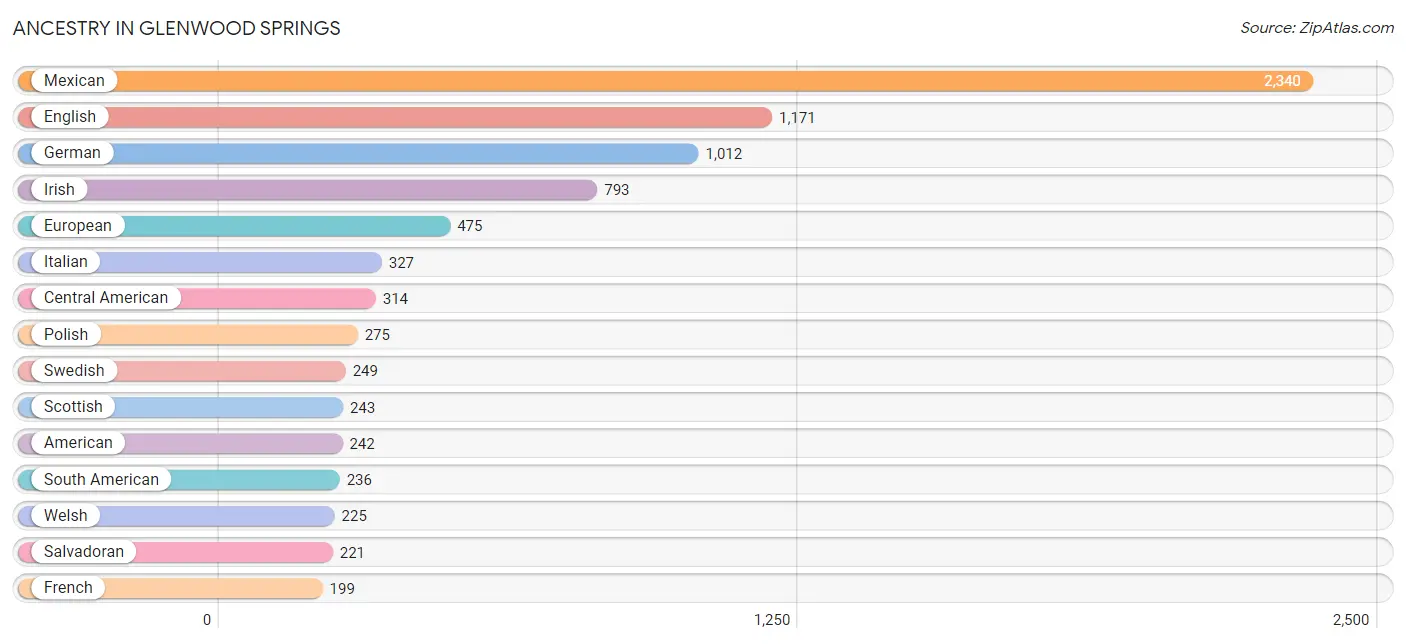
| Ancestry | # Population | % Population |
| African | 47 | 0.5% |
| American | 242 | 2.4% |
| Argentinean | 11 | 0.1% |
| Armenian | 39 | 0.4% |
| Australian | 8 | 0.1% |
| Austrian | 67 | 0.7% |
| British | 24 | 0.2% |
| Burmese | 35 | 0.4% |
| Canadian | 14 | 0.1% |
| Central American | 314 | 3.1% |
| Cherokee | 35 | 0.4% |
| Chilean | 8 | 0.1% |
| Colombian | 124 | 1.2% |
| Creek | 7 | 0.1% |
| Croatian | 8 | 0.1% |
| Czech | 58 | 0.6% |
| Danish | 75 | 0.7% |
| Dominican | 76 | 0.7% |
| Dutch | 105 | 1.0% |
| English | 1,171 | 11.6% |
| European | 475 | 4.7% |
| Finnish | 25 | 0.3% |
| French | 199 | 2.0% |
| French Canadian | 34 | 0.3% |
| German | 1,012 | 10.0% |
| Greek | 28 | 0.3% |
| Guamanian / Chamorro | 76 | 0.7% |
| Honduran | 86 | 0.9% |
| Hopi | 13 | 0.1% |
| Hungarian | 33 | 0.3% |
| Indian (Asian) | 61 | 0.6% |
| Inupiat | 76 | 0.7% |
| Irish | 793 | 7.9% |
| Italian | 327 | 3.2% |
| Jamaican | 24 | 0.2% |
| Japanese | 12 | 0.1% |
| Mexican | 2,340 | 23.2% |
| Native Hawaiian | 15 | 0.2% |
| Nicaraguan | 7 | 0.1% |
| Nigerian | 15 | 0.2% |
| Northern European | 90 | 0.9% |
| Norwegian | 67 | 0.7% |
| Pakistani | 155 | 1.5% |
| Peruvian | 93 | 0.9% |
| Polish | 275 | 2.7% |
| Portuguese | 11 | 0.1% |
| Puerto Rican | 181 | 1.8% |
| Russian | 34 | 0.3% |
| Salvadoran | 221 | 2.2% |
| Scandinavian | 146 | 1.5% |
| Scotch-Irish | 92 | 0.9% |
| Scottish | 243 | 2.4% |
| Slavic | 14 | 0.1% |
| Slovak | 32 | 0.3% |
| South American | 236 | 2.3% |
| Spaniard | 30 | 0.3% |
| Spanish | 19 | 0.2% |
| Sri Lankan | 18 | 0.2% |
| Subsaharan African | 62 | 0.6% |
| Swedish | 249 | 2.5% |
| Swiss | 28 | 0.3% |
| Thai | 13 | 0.1% |
| Ukrainian | 61 | 0.6% |
| Welsh | 225 | 2.2% | View All 64 Rows |
Immigrants in Glenwood Springs
The most numerous immigrant groups reported in Glenwood Springs came from Latin America (1,462 | 14.5%), Central America (1,234 | 12.2%), Mexico (942 | 9.3%), El Salvador (264 | 2.6%), and South America (204 | 2.0%), together accounting for 40.7% of all Glenwood Springs residents.
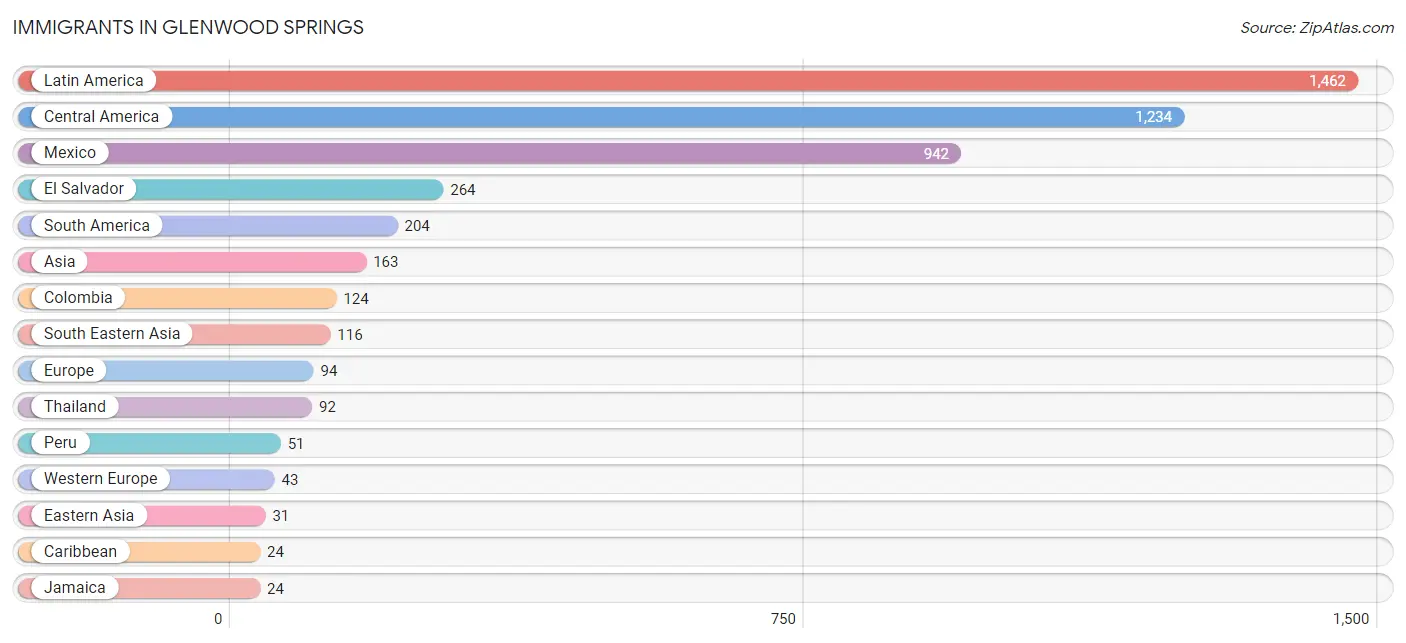
| Immigration Origin | # Population | % Population |
| Argentina | 11 | 0.1% |
| Asia | 163 | 1.6% |
| Australia | 15 | 0.2% |
| Austria | 10 | 0.1% |
| Brazil | 10 | 0.1% |
| Canada | 14 | 0.1% |
| Caribbean | 24 | 0.2% |
| Central America | 1,234 | 12.2% |
| Chile | 8 | 0.1% |
| China | 18 | 0.2% |
| Colombia | 124 | 1.2% |
| Eastern Asia | 31 | 0.3% |
| Eastern Europe | 21 | 0.2% |
| El Salvador | 264 | 2.6% |
| England | 7 | 0.1% |
| Europe | 94 | 0.9% |
| Germany | 10 | 0.1% |
| Honduras | 21 | 0.2% |
| Hungary | 21 | 0.2% |
| India | 16 | 0.2% |
| Indonesia | 18 | 0.2% |
| Ireland | 6 | 0.1% |
| Italy | 8 | 0.1% |
| Jamaica | 24 | 0.2% |
| Japan | 6 | 0.1% |
| Korea | 7 | 0.1% |
| Latin America | 1,462 | 14.5% |
| Mexico | 942 | 9.3% |
| Netherlands | 13 | 0.1% |
| Nicaragua | 7 | 0.1% |
| Northern Europe | 22 | 0.2% |
| Oceania | 15 | 0.2% |
| Peru | 51 | 0.5% |
| South America | 204 | 2.0% |
| South Central Asia | 16 | 0.2% |
| South Eastern Asia | 116 | 1.1% |
| Southern Europe | 8 | 0.1% |
| Sweden | 9 | 0.1% |
| Switzerland | 10 | 0.1% |
| Thailand | 92 | 0.9% |
| Vietnam | 6 | 0.1% |
| Western Europe | 43 | 0.4% | View All 42 Rows |
Sex and Age in Glenwood Springs
Sex and Age in Glenwood Springs
The most populous age groups in Glenwood Springs are 30 to 34 Years (546 | 10.7%) for men and 15 to 19 Years (443 | 8.8%) for women.
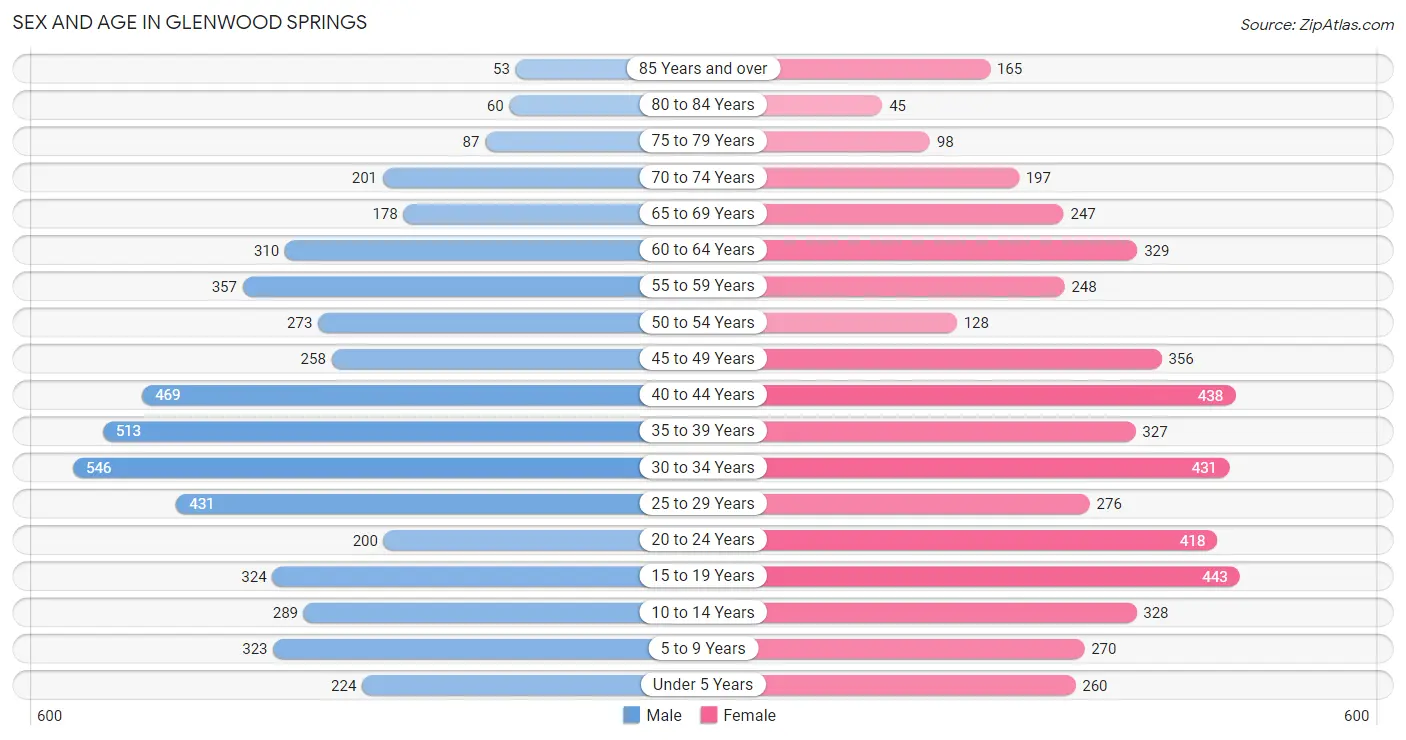
| Age Bracket | Male | Female |
| Under 5 Years | 224 (4.4%) | 260 (5.2%) |
| 5 to 9 Years | 323 (6.3%) | 270 (5.4%) |
| 10 to 14 Years | 289 (5.7%) | 328 (6.6%) |
| 15 to 19 Years | 324 (6.4%) | 443 (8.8%) |
| 20 to 24 Years | 200 (3.9%) | 418 (8.4%) |
| 25 to 29 Years | 431 (8.5%) | 276 (5.5%) |
| 30 to 34 Years | 546 (10.7%) | 431 (8.6%) |
| 35 to 39 Years | 513 (10.1%) | 327 (6.5%) |
| 40 to 44 Years | 469 (9.2%) | 438 (8.7%) |
| 45 to 49 Years | 258 (5.1%) | 356 (7.1%) |
| 50 to 54 Years | 273 (5.4%) | 128 (2.6%) |
| 55 to 59 Years | 357 (7.0%) | 248 (5.0%) |
| 60 to 64 Years | 310 (6.1%) | 329 (6.6%) |
| 65 to 69 Years | 178 (3.5%) | 247 (4.9%) |
| 70 to 74 Years | 201 (3.9%) | 197 (3.9%) |
| 75 to 79 Years | 87 (1.7%) | 98 (2.0%) |
| 80 to 84 Years | 60 (1.2%) | 45 (0.9%) |
| 85 Years and over | 53 (1.0%) | 165 (3.3%) |
| Total | 5,096 (100.0%) | 5,004 (100.0%) |
Families and Households in Glenwood Springs
Median Family Size in Glenwood Springs
The median family size in Glenwood Springs is 3.36 persons per family, with single female/mother families (414 | 19.7%) accounting for the largest median family size of 4.04 persons per family. On the other hand, single male/father families (239 | 11.4%) represent the smallest median family size with 2.95 persons per family.
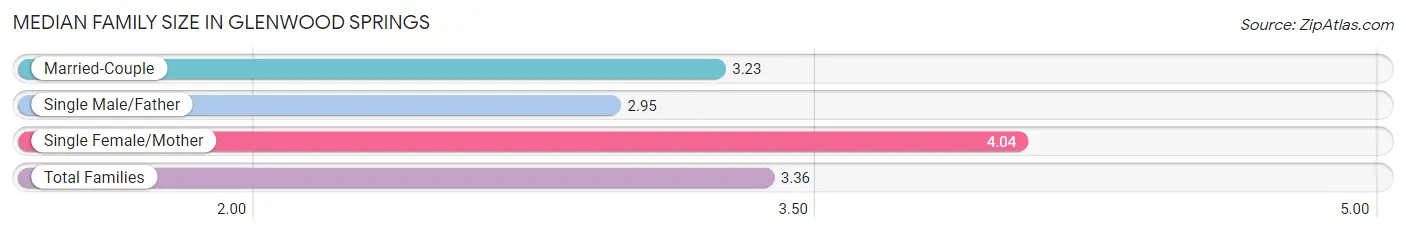
| Family Type | # Families | Family Size |
| Married-Couple | 1,453 (69.0%) | 3.23 |
| Single Male/Father | 239 (11.4%) | 2.95 |
| Single Female/Mother | 414 (19.7%) | 4.04 |
| Total Families | 2,106 (100.0%) | 3.36 |
Median Household Size in Glenwood Springs
The median household size in Glenwood Springs is 2.54 persons per household, with single female/mother households (414 | 10.6%) accounting for the largest median household size of 4.22 persons per household. non-family households (1,795 | 46.0%) represent the smallest median household size with 1.35 persons per household.
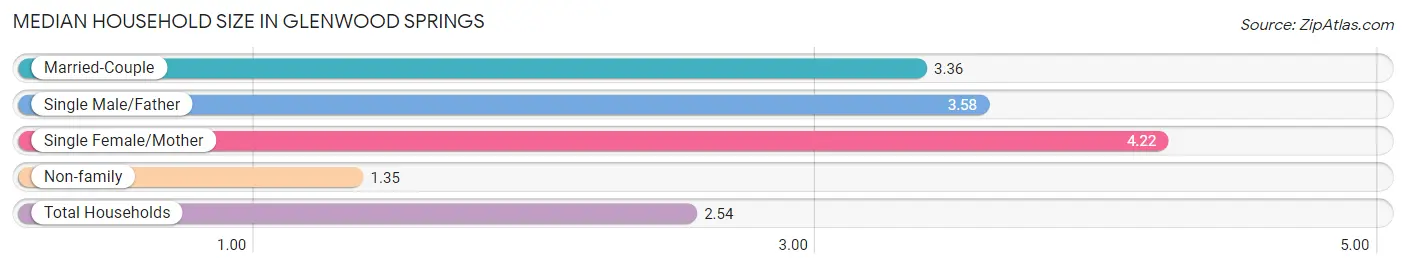
| Household Type | # Households | Household Size |
| Married-Couple | 1,453 (37.2%) | 3.36 |
| Single Male/Father | 239 (6.1%) | 3.58 |
| Single Female/Mother | 414 (10.6%) | 4.22 |
| Non-family | 1,795 (46.0%) | 1.35 |
| Total Households | 3,901 (100.0%) | 2.54 |
Household Size by Marriage Status in Glenwood Springs
Out of a total of 3,901 households in Glenwood Springs, 2,106 (54.0%) are family households, while 1,795 (46.0%) are nonfamily households. The most numerous type of family households are 2-person households, comprising 939, and the most common type of nonfamily households are 1-person households, comprising 1,451.
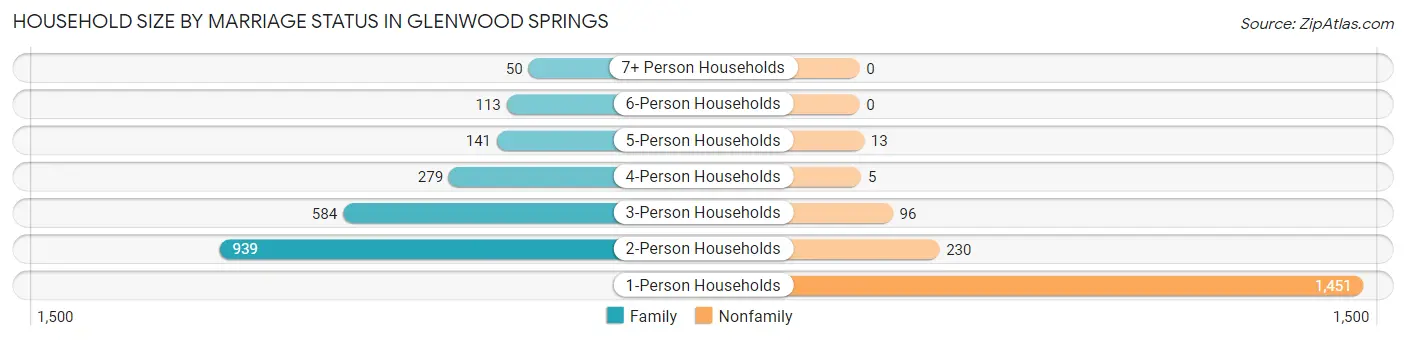
| Household Size | Family Households | Nonfamily Households |
| 1-Person Households | - | 1,451 (37.2%) |
| 2-Person Households | 939 (24.1%) | 230 (5.9%) |
| 3-Person Households | 584 (15.0%) | 96 (2.5%) |
| 4-Person Households | 279 (7.1%) | 5 (0.1%) |
| 5-Person Households | 141 (3.6%) | 13 (0.3%) |
| 6-Person Households | 113 (2.9%) | 0 (0.0%) |
| 7+ Person Households | 50 (1.3%) | 0 (0.0%) |
| Total | 2,106 (54.0%) | 1,795 (46.0%) |
Female Fertility in Glenwood Springs
Fertility by Age in Glenwood Springs
Average fertility rate in Glenwood Springs is 49.0 births per 1,000 women. Women in the age bracket of 20 to 34 years have the highest fertility rate with 84.0 births per 1,000 women. Women in the age bracket of 20 to 34 years acount for 70.9% of all women with births.
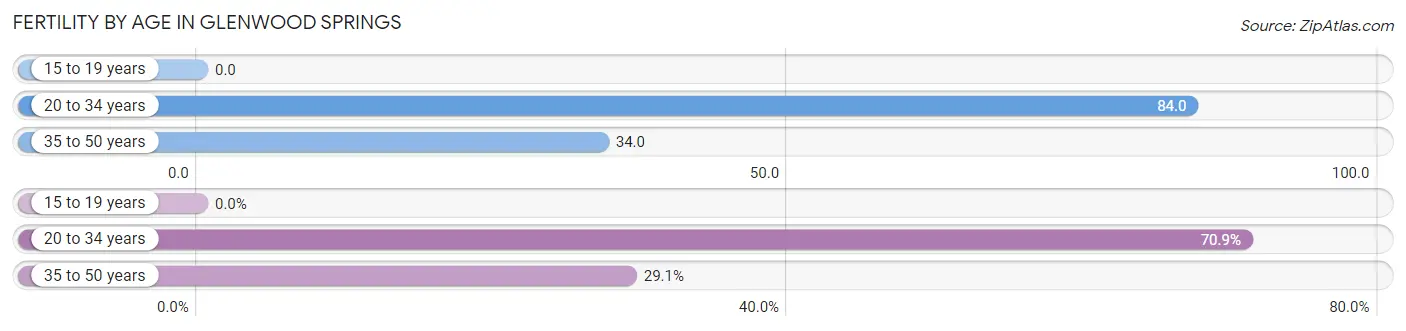
| Age Bracket | Women with Births | Births / 1,000 Women |
| 15 to 19 years | 0 (0.0%) | 0.0 |
| 20 to 34 years | 95 (70.9%) | 84.0 |
| 35 to 50 years | 39 (29.1%) | 34.0 |
| Total | 134 (100.0%) | 49.0 |
Fertility by Age by Marriage Status in Glenwood Springs
90.3% of women with births (134) in Glenwood Springs are married. The highest percentage of unmarried women with births falls into 35 to 50 years age bracket with 33.3% of them unmarried at the time of birth, while the lowest percentage of unmarried women with births belong to 20 to 34 years age bracket with 0.0% of them unmarried.
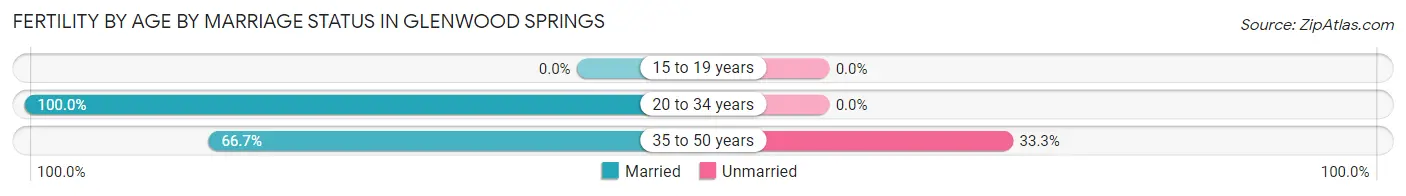
| Age Bracket | Married | Unmarried |
| 15 to 19 years | 0 (0.0%) | 0 (0.0%) |
| 20 to 34 years | 95 (100.0%) | 0 (0.0%) |
| 35 to 50 years | 26 (66.7%) | 13 (33.3%) |
| Total | 121 (90.3%) | 13 (9.7%) |
Fertility by Education in Glenwood Springs
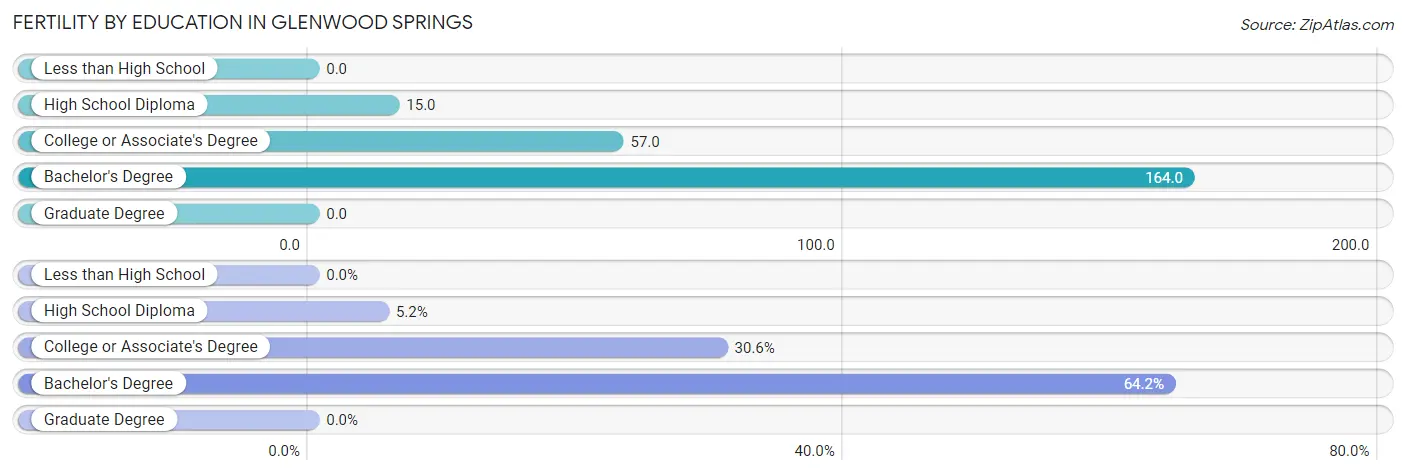
| Educational Attainment | Women with Births | Births / 1,000 Women |
| Less than High School | 0 (0.0%) | 0.0 |
| High School Diploma | 7 (5.2%) | 15.0 |
| College or Associate's Degree | 41 (30.6%) | 57.0 |
| Bachelor's Degree | 86 (64.2%) | 164.0 |
| Graduate Degree | 0 (0.0%) | 0.0 |
| Total | 134 (100.0%) | 49.0 |
Fertility by Education by Marriage Status in Glenwood Springs
9.7% of women with births in Glenwood Springs are unmarried. Women with the educational attainment of high school diploma are most likely to be married with 100.0% of them married at childbirth, while women with the educational attainment of bachelor's degree are least likely to be married with 15.1% of them unmarried at childbirth.
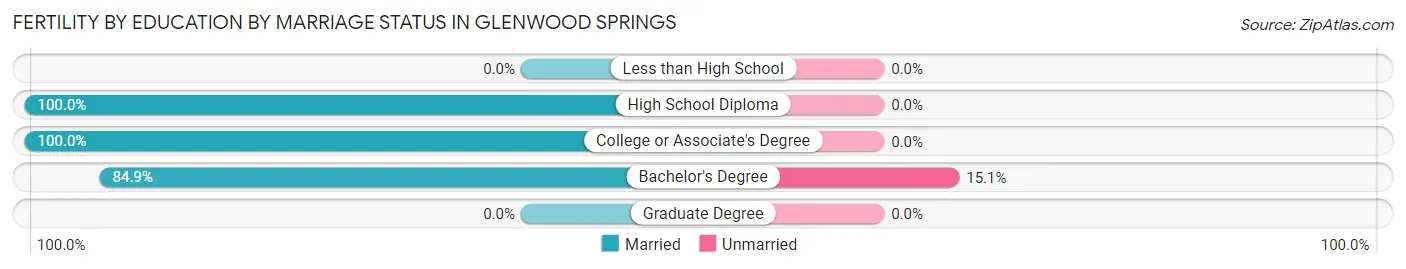
| Educational Attainment | Married | Unmarried |
| Less than High School | 0 (0.0%) | 0 (0.0%) |
| High School Diploma | 7 (100.0%) | 0 (0.0%) |
| College or Associate's Degree | 41 (100.0%) | 0 (0.0%) |
| Bachelor's Degree | 73 (84.9%) | 13 (15.1%) |
| Graduate Degree | 0 (0.0%) | 0 (0.0%) |
| Total | 121 (90.3%) | 13 (9.7%) |
Employment Characteristics in Glenwood Springs
Employment by Class of Employer in Glenwood Springs
Among the 5,904 employed individuals in Glenwood Springs, private company employees (3,694 | 62.6%), local government employees (562 | 9.5%), and not-for-profit organizations (546 | 9.2%) make up the most common classes of employment.
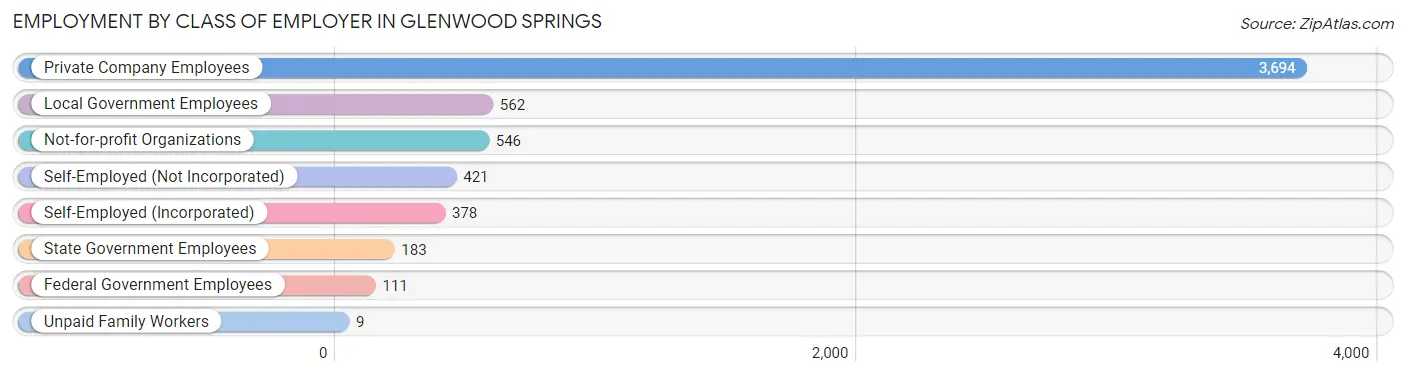
| Employer Class | # Employees | % Employees |
| Private Company Employees | 3,694 | 62.6% |
| Self-Employed (Incorporated) | 378 | 6.4% |
| Self-Employed (Not Incorporated) | 421 | 7.1% |
| Not-for-profit Organizations | 546 | 9.2% |
| Local Government Employees | 562 | 9.5% |
| State Government Employees | 183 | 3.1% |
| Federal Government Employees | 111 | 1.9% |
| Unpaid Family Workers | 9 | 0.2% |
| Total | 5,904 | 100.0% |
Employment Status by Age in Glenwood Springs
According to the labor force statistics for Glenwood Springs, out of the total population over 16 years of age (8,322), 75.1% or 6,250 individuals are in the labor force, with 3.1% or 194 of them unemployed. The age group with the highest labor force participation rate is 30 to 34 years, with 95.0% or 928 individuals in the labor force. Within the labor force, the 60 to 64 years age range has the highest percentage of unemployed individuals, with 22.0% or 95 of them being unemployed.
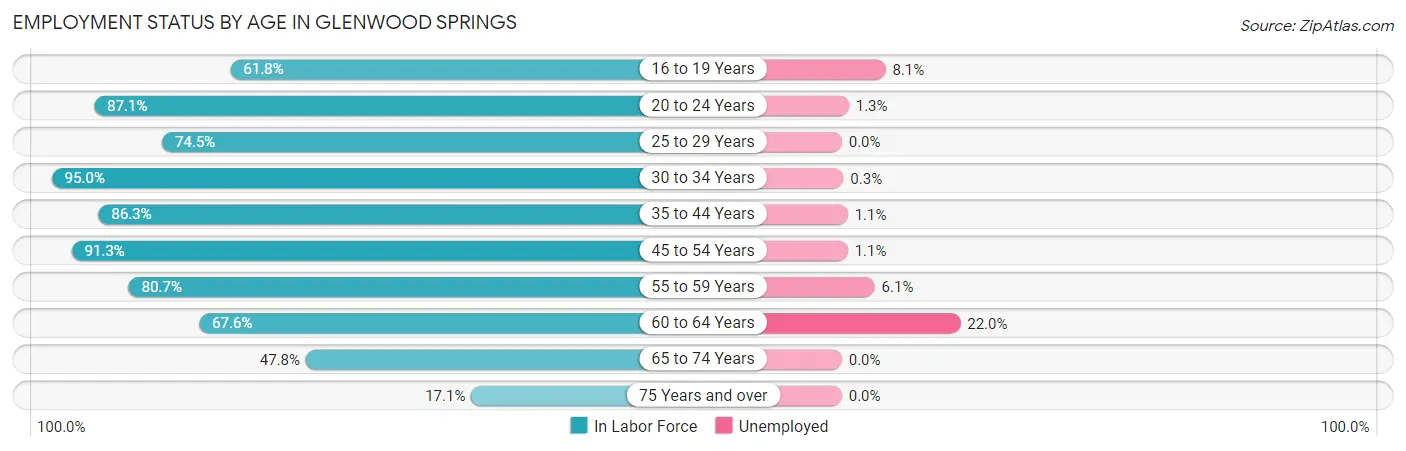
| Age Bracket | In Labor Force | Unemployed |
| 16 to 19 Years | 422 (61.8%) | 34 (8.1%) |
| 20 to 24 Years | 538 (87.1%) | 7 (1.3%) |
| 25 to 29 Years | 527 (74.5%) | 0 (0.0%) |
| 30 to 34 Years | 928 (95.0%) | 3 (0.3%) |
| 35 to 44 Years | 1,508 (86.3%) | 17 (1.1%) |
| 45 to 54 Years | 927 (91.3%) | 10 (1.1%) |
| 55 to 59 Years | 488 (80.7%) | 30 (6.1%) |
| 60 to 64 Years | 432 (67.6%) | 95 (22.0%) |
| 65 to 74 Years | 393 (47.8%) | 0 (0.0%) |
| 75 Years and over | 87 (17.1%) | 0 (0.0%) |
| Total | 6,250 (75.1%) | 194 (3.1%) |
Employment Status by Educational Attainment in Glenwood Springs
According to labor force statistics for Glenwood Springs, 84.5% of individuals (4,808) out of the total population between 25 and 64 years of age (5,690) are in the labor force, with 3.2% or 154 of them being unemployed. The group with the highest labor force participation rate are those with the educational attainment of bachelor's degree or higher, with 96.2% or 1,984 individuals in the labor force. Within the labor force, individuals with less than high school education have the highest percentage of unemployment, with 10.4% or 63 of them being unemployed.
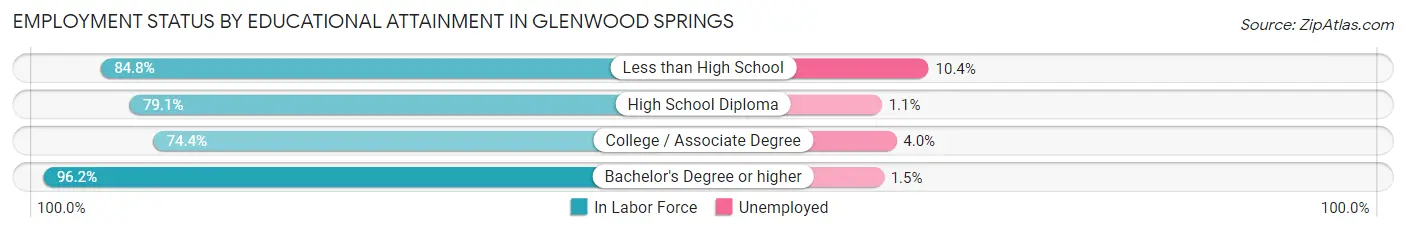
| Educational Attainment | In Labor Force | Unemployed |
| Less than High School | 606 (84.8%) | 74 (10.4%) |
| High School Diploma | 853 (79.1%) | 12 (1.1%) |
| College / Associate Degree | 1,365 (74.4%) | 73 (4.0%) |
| Bachelor's Degree or higher | 1,984 (96.2%) | 31 (1.5%) |
| Total | 4,808 (84.5%) | 182 (3.2%) |
Employment Occupations by Sex in Glenwood Springs
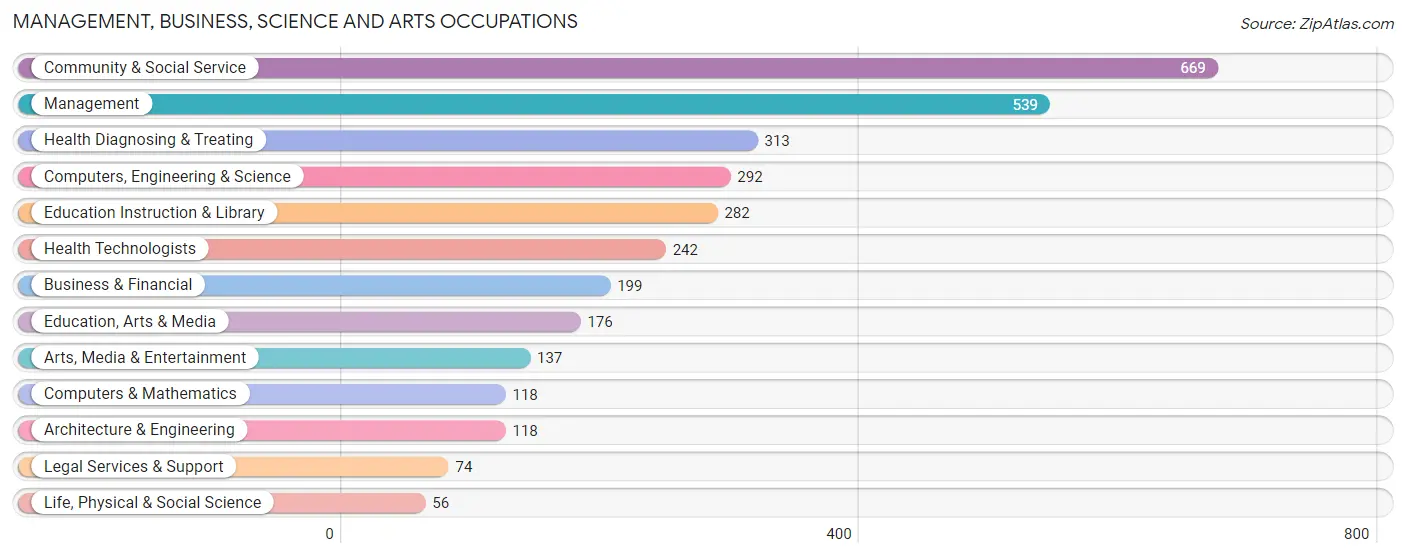
Management, Business, Science and Arts Occupations
The most common Management, Business, Science and Arts occupations in Glenwood Springs are Community & Social Service (669 | 11.1%), Management (539 | 8.9%), Health Diagnosing & Treating (313 | 5.2%), Computers, Engineering & Science (292 | 4.8%), and Education Instruction & Library (282 | 4.7%).
Management, Business, Science and Arts Occupations by Sex
Within the Management, Business, Science and Arts occupations in Glenwood Springs, the most male-oriented occupations are Arts, Media & Entertainment (88.3%), Computers & Mathematics (85.6%), and Legal Services & Support (85.1%), while the most female-oriented occupations are Health Technologists (75.6%), Life, Physical & Social Science (75.0%), and Health Diagnosing & Treating (74.4%).
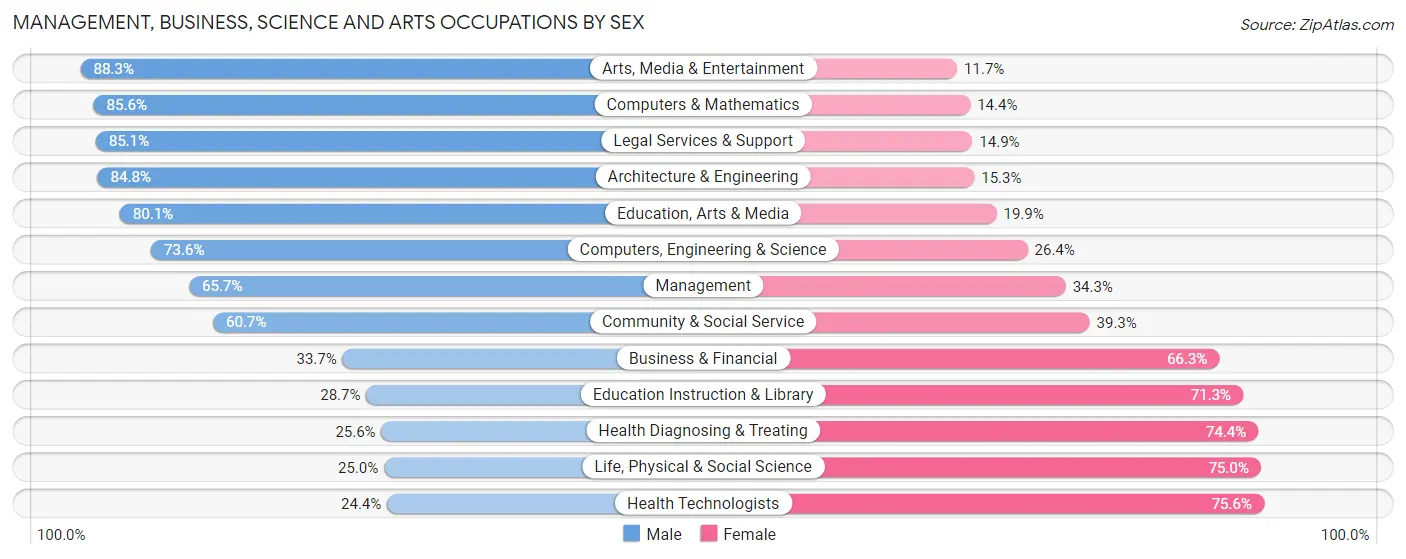
| Occupation | Male | Female |
| Management | 354 (65.7%) | 185 (34.3%) |
| Business & Financial | 67 (33.7%) | 132 (66.3%) |
| Computers, Engineering & Science | 215 (73.6%) | 77 (26.4%) |
| Computers & Mathematics | 101 (85.6%) | 17 (14.4%) |
| Architecture & Engineering | 100 (84.8%) | 18 (15.2%) |
| Life, Physical & Social Science | 14 (25.0%) | 42 (75.0%) |
| Community & Social Service | 406 (60.7%) | 263 (39.3%) |
| Education, Arts & Media | 141 (80.1%) | 35 (19.9%) |
| Legal Services & Support | 63 (85.1%) | 11 (14.9%) |
| Education Instruction & Library | 81 (28.7%) | 201 (71.3%) |
| Arts, Media & Entertainment | 121 (88.3%) | 16 (11.7%) |
| Health Diagnosing & Treating | 80 (25.6%) | 233 (74.4%) |
| Health Technologists | 59 (24.4%) | 183 (75.6%) |
| Total (Category) | 1,122 (55.8%) | 890 (44.2%) |
| Total (Overall) | 3,309 (54.7%) | 2,744 (45.3%) |
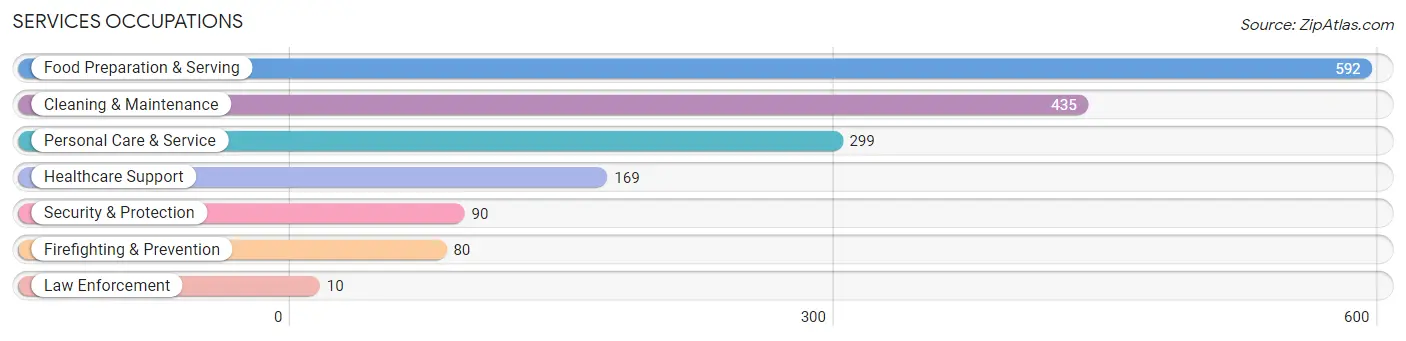
Services Occupations
The most common Services occupations in Glenwood Springs are Food Preparation & Serving (592 | 9.8%), Cleaning & Maintenance (435 | 7.2%), Personal Care & Service (299 | 4.9%), Healthcare Support (169 | 2.8%), and Security & Protection (90 | 1.5%).
Services Occupations by Sex
Within the Services occupations in Glenwood Springs, the most male-oriented occupations are Security & Protection (100.0%), Firefighting & Prevention (100.0%), and Law Enforcement (100.0%), while the most female-oriented occupations are Healthcare Support (89.9%), Cleaning & Maintenance (63.2%), and Personal Care & Service (56.9%).
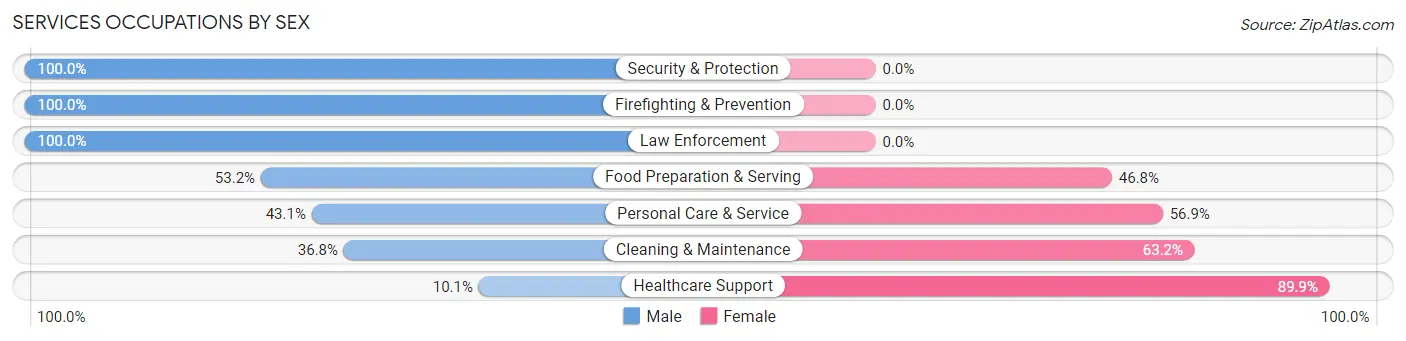
| Occupation | Male | Female |
| Healthcare Support | 17 (10.1%) | 152 (89.9%) |
| Security & Protection | 90 (100.0%) | 0 (0.0%) |
| Firefighting & Prevention | 80 (100.0%) | 0 (0.0%) |
| Law Enforcement | 10 (100.0%) | 0 (0.0%) |
| Food Preparation & Serving | 315 (53.2%) | 277 (46.8%) |
| Cleaning & Maintenance | 160 (36.8%) | 275 (63.2%) |
| Personal Care & Service | 129 (43.1%) | 170 (56.9%) |
| Total (Category) | 711 (44.9%) | 874 (55.1%) |
| Total (Overall) | 3,309 (54.7%) | 2,744 (45.3%) |
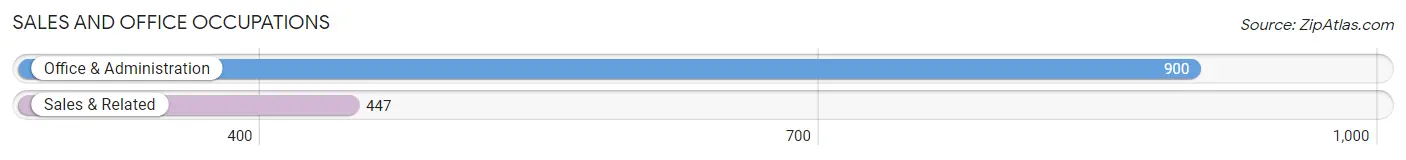
Sales and Office Occupations
The most common Sales and Office occupations in Glenwood Springs are Office & Administration (900 | 14.9%), and Sales & Related (447 | 7.4%).
Sales and Office Occupations by Sex
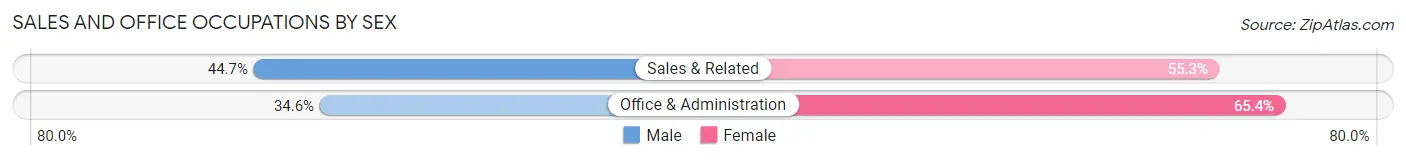
| Occupation | Male | Female |
| Sales & Related | 200 (44.7%) | 247 (55.3%) |
| Office & Administration | 311 (34.6%) | 589 (65.4%) |
| Total (Category) | 511 (37.9%) | 836 (62.1%) |
| Total (Overall) | 3,309 (54.7%) | 2,744 (45.3%) |
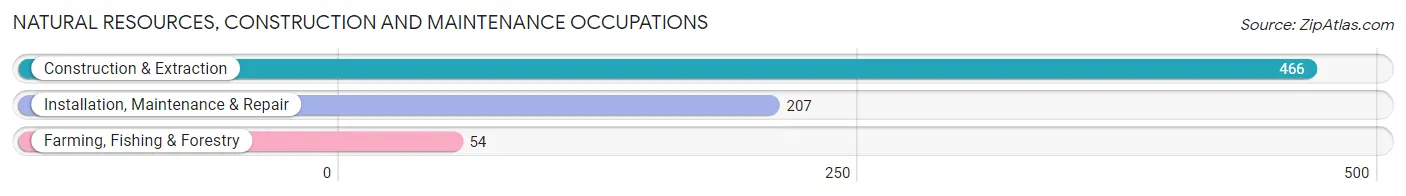
Natural Resources, Construction and Maintenance Occupations
The most common Natural Resources, Construction and Maintenance occupations in Glenwood Springs are Construction & Extraction (466 | 7.7%), Installation, Maintenance & Repair (207 | 3.4%), and Farming, Fishing & Forestry (54 | 0.9%).
Natural Resources, Construction and Maintenance Occupations by Sex
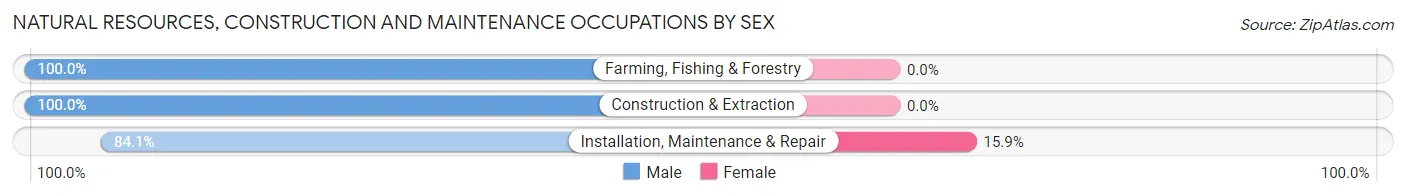
| Occupation | Male | Female |
| Farming, Fishing & Forestry | 54 (100.0%) | 0 (0.0%) |
| Construction & Extraction | 466 (100.0%) | 0 (0.0%) |
| Installation, Maintenance & Repair | 174 (84.1%) | 33 (15.9%) |
| Total (Category) | 694 (95.5%) | 33 (4.5%) |
| Total (Overall) | 3,309 (54.7%) | 2,744 (45.3%) |
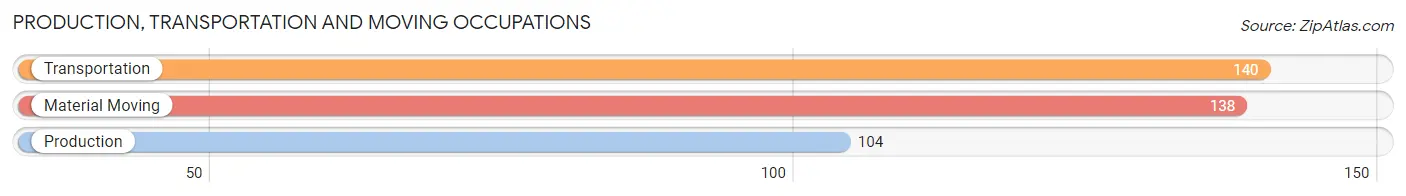
Production, Transportation and Moving Occupations
The most common Production, Transportation and Moving occupations in Glenwood Springs are Transportation (140 | 2.3%), Material Moving (138 | 2.3%), and Production (104 | 1.7%).
Production, Transportation and Moving Occupations by Sex
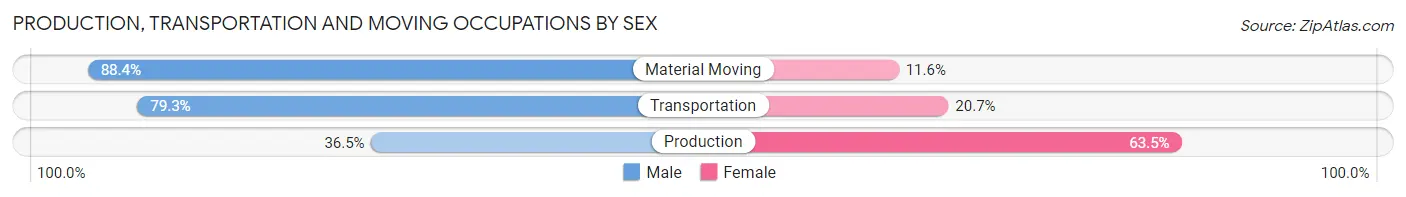
| Occupation | Male | Female |
| Production | 38 (36.5%) | 66 (63.5%) |
| Transportation | 111 (79.3%) | 29 (20.7%) |
| Material Moving | 122 (88.4%) | 16 (11.6%) |
| Total (Category) | 271 (70.9%) | 111 (29.1%) |
| Total (Overall) | 3,309 (54.7%) | 2,744 (45.3%) |
Employment Industries by Sex in Glenwood Springs
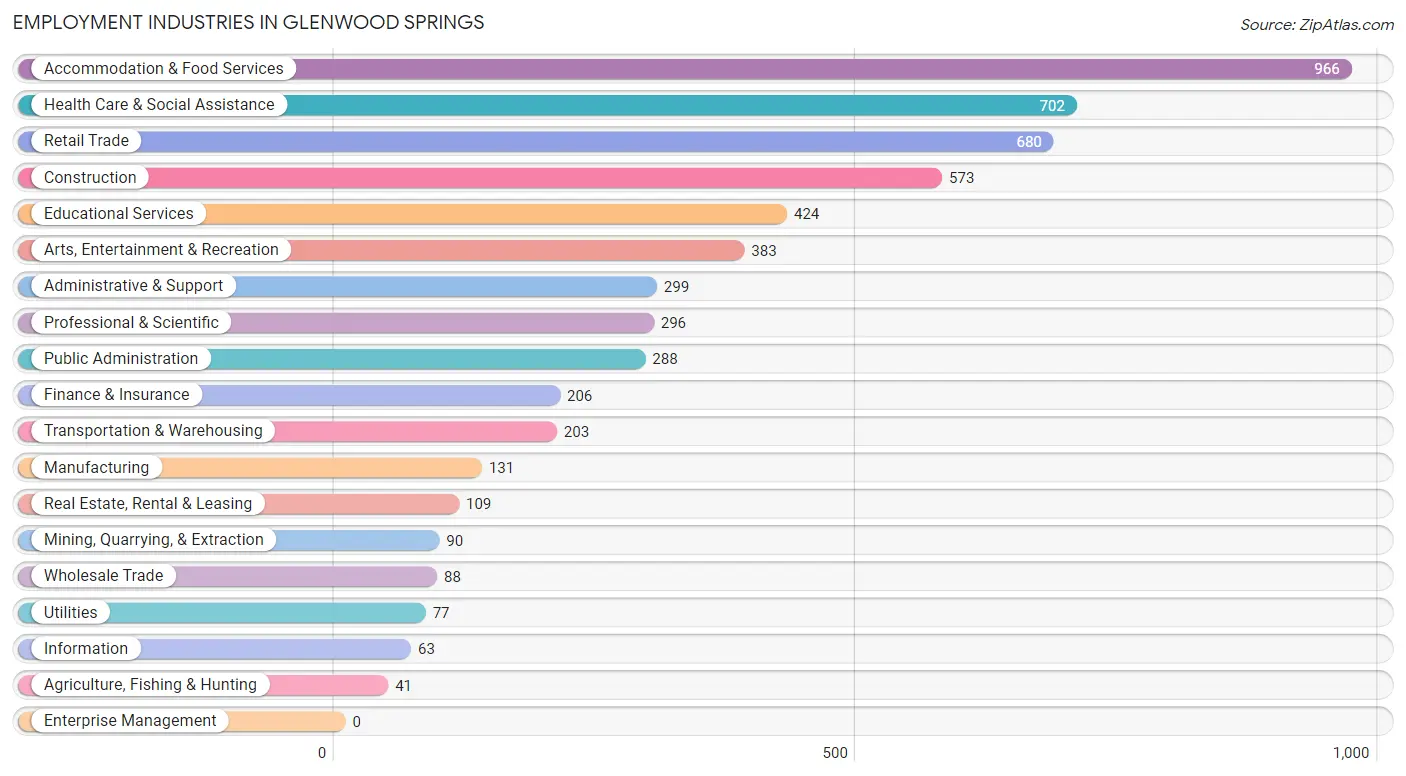
Employment Industries in Glenwood Springs
The major employment industries in Glenwood Springs include Accommodation & Food Services (966 | 16.0%), Health Care & Social Assistance (702 | 11.6%), Retail Trade (680 | 11.2%), Construction (573 | 9.5%), and Educational Services (424 | 7.0%).
Employment Industries by Sex in Glenwood Springs
The Glenwood Springs industries that see more men than women are Mining, Quarrying, & Extraction (100.0%), Construction (95.5%), and Transportation & Warehousing (85.7%), whereas the industries that tend to have a higher number of women are Health Care & Social Assistance (73.7%), Real Estate, Rental & Leasing (65.1%), and Finance & Insurance (61.2%).
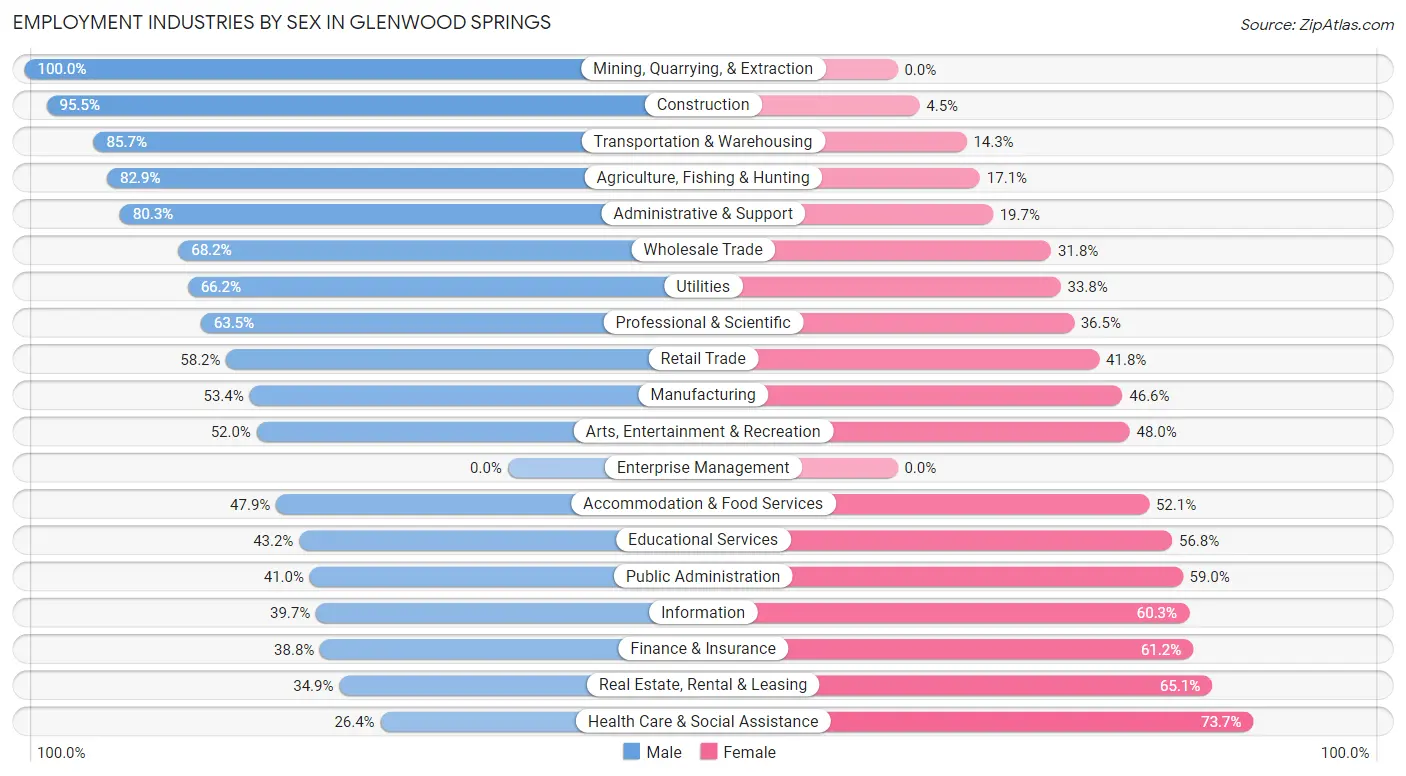
| Industry | Male | Female |
| Agriculture, Fishing & Hunting | 34 (82.9%) | 7 (17.1%) |
| Mining, Quarrying, & Extraction | 90 (100.0%) | 0 (0.0%) |
| Construction | 547 (95.5%) | 26 (4.5%) |
| Manufacturing | 70 (53.4%) | 61 (46.6%) |
| Wholesale Trade | 60 (68.2%) | 28 (31.8%) |
| Retail Trade | 396 (58.2%) | 284 (41.8%) |
| Transportation & Warehousing | 174 (85.7%) | 29 (14.3%) |
| Utilities | 51 (66.2%) | 26 (33.8%) |
| Information | 25 (39.7%) | 38 (60.3%) |
| Finance & Insurance | 80 (38.8%) | 126 (61.2%) |
| Real Estate, Rental & Leasing | 38 (34.9%) | 71 (65.1%) |
| Professional & Scientific | 188 (63.5%) | 108 (36.5%) |
| Enterprise Management | 0 (0.0%) | 0 (0.0%) |
| Administrative & Support | 240 (80.3%) | 59 (19.7%) |
| Educational Services | 183 (43.2%) | 241 (56.8%) |
| Health Care & Social Assistance | 185 (26.4%) | 517 (73.7%) |
| Arts, Entertainment & Recreation | 199 (52.0%) | 184 (48.0%) |
| Accommodation & Food Services | 463 (47.9%) | 503 (52.1%) |
| Public Administration | 118 (41.0%) | 170 (59.0%) |
| Total | 3,309 (54.7%) | 2,744 (45.3%) |
Education in Glenwood Springs
School Enrollment in Glenwood Springs
The most common levels of schooling among the 2,368 students in Glenwood Springs are high school (610 | 25.8%), middle school (506 | 21.4%), and elementary school (443 | 18.7%).
| School Level | # Students | % Students |
| Nursery / Preschool | 131 | 5.5% |
| Kindergarten | 120 | 5.1% |
| Elementary School | 443 | 18.7% |
| Middle School | 506 | 21.4% |
| High School | 610 | 25.8% |
| College / Undergraduate | 395 | 16.7% |
| Graduate / Professional | 163 | 6.9% |
| Total | 2,368 | 100.0% |
School Enrollment by Age by Funding Source in Glenwood Springs
Out of a total of 2,368 students who are enrolled in schools in Glenwood Springs, 372 (15.7%) attend a private institution, while the remaining 1,996 (84.3%) are enrolled in public schools. The age group of 20 to 24 year olds has the highest likelihood of being enrolled in private schools, with 70 (45.8% in the age bracket) enrolled. Conversely, the age group of 18 to 19 year olds has the lowest likelihood of being enrolled in a private school, with 134 (100.0% in the age bracket) attending a public institution.
| Age Bracket | Public School | Private School |
| 3 to 4 Year Olds | 70 (84.3%) | 13 (15.7%) |
| 5 to 9 Year Old | 561 (94.6%) | 32 (5.4%) |
| 10 to 14 Year Olds | 323 (59.6%) | 219 (40.4%) |
| 15 to 17 Year Olds | 472 (97.3%) | 13 (2.7%) |
| 18 to 19 Year Olds | 134 (100.0%) | 0 (0.0%) |
| 20 to 24 Year Olds | 83 (54.2%) | 70 (45.8%) |
| 25 to 34 Year Olds | 274 (94.5%) | 16 (5.5%) |
| 35 Years and over | 80 (90.9%) | 8 (9.1%) |
| Total | 1,996 (84.3%) | 372 (15.7%) |
Educational Attainment by Field of Study in Glenwood Springs
Social sciences (401 | 13.3%), business (346 | 11.4%), science & technology (337 | 11.1%), education (329 | 10.9%), and psychology (254 | 8.4%) are the most common fields of study among 3,025 individuals in Glenwood Springs who have obtained a bachelor's degree or higher.
| Field of Study | # Graduates | % Graduates |
| Computers & Mathematics | 72 | 2.4% |
| Bio, Nature & Agricultural | 248 | 8.2% |
| Physical & Health Sciences | 73 | 2.4% |
| Psychology | 254 | 8.4% |
| Social Sciences | 401 | 13.3% |
| Engineering | 208 | 6.9% |
| Multidisciplinary Studies | 0 | 0.0% |
| Science & Technology | 337 | 11.1% |
| Business | 346 | 11.4% |
| Education | 329 | 10.9% |
| Literature & Languages | 160 | 5.3% |
| Liberal Arts & History | 182 | 6.0% |
| Visual & Performing Arts | 129 | 4.3% |
| Communications | 83 | 2.7% |
| Arts & Humanities | 203 | 6.7% |
| Total | 3,025 | 100.0% |
Transportation & Commute in Glenwood Springs
Vehicle Availability by Sex in Glenwood Springs
The most prevalent vehicle ownership categories in Glenwood Springs are males with 2 vehicles (1,375, accounting for 42.7%) and females with 2 vehicles (1,006, making up 51.5%).
| Vehicles Available | Male | Female |
| No Vehicle | 37 (1.1%) | 131 (4.9%) |
| 1 Vehicle | 506 (15.7%) | 523 (19.6%) |
| 2 Vehicles | 1,375 (42.7%) | 1,006 (37.7%) |
| 3 Vehicles | 720 (22.4%) | 575 (21.5%) |
| 4 Vehicles | 345 (10.7%) | 315 (11.8%) |
| 5 or more Vehicles | 237 (7.4%) | 119 (4.5%) |
| Total | 3,220 (100.0%) | 2,669 (100.0%) |
Commute Time in Glenwood Springs
The most frequently occuring commute durations in Glenwood Springs are 10 to 14 minutes (1,110 commuters, 20.4%), 60 to 89 minutes (716 commuters, 13.1%), and 5 to 9 minutes (701 commuters, 12.9%).
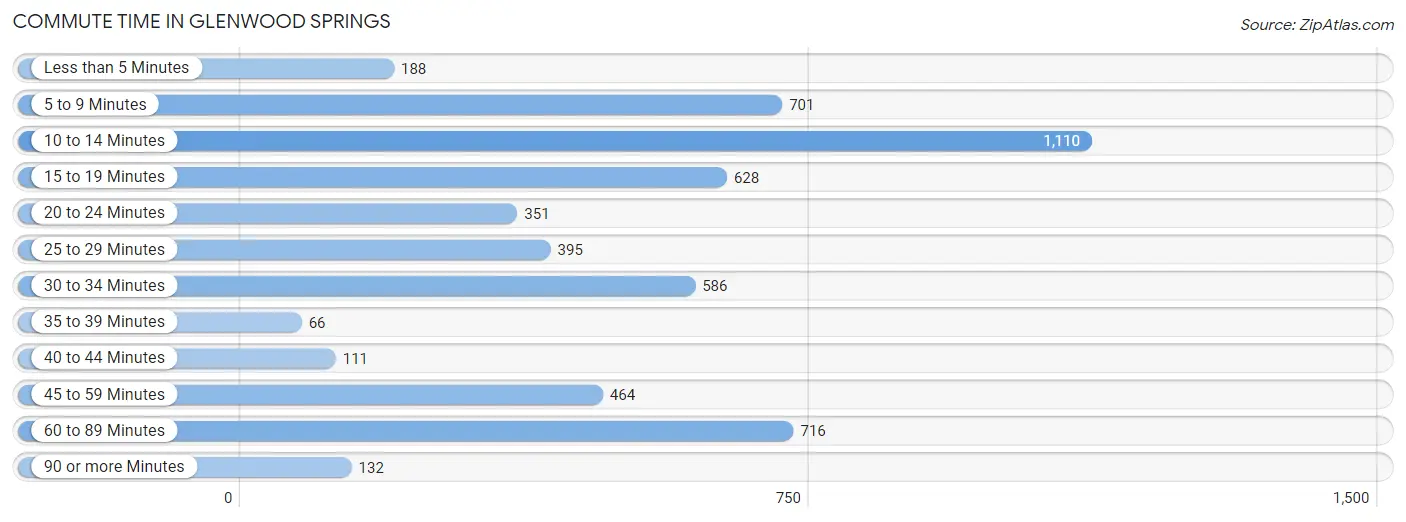
| Commute Time | # Commuters | % Commuters |
| Less than 5 Minutes | 188 | 3.5% |
| 5 to 9 Minutes | 701 | 12.9% |
| 10 to 14 Minutes | 1,110 | 20.4% |
| 15 to 19 Minutes | 628 | 11.5% |
| 20 to 24 Minutes | 351 | 6.4% |
| 25 to 29 Minutes | 395 | 7.2% |
| 30 to 34 Minutes | 586 | 10.8% |
| 35 to 39 Minutes | 66 | 1.2% |
| 40 to 44 Minutes | 111 | 2.0% |
| 45 to 59 Minutes | 464 | 8.5% |
| 60 to 89 Minutes | 716 | 13.1% |
| 90 or more Minutes | 132 | 2.4% |
Commute Time by Sex in Glenwood Springs
The most common commute times in Glenwood Springs are 10 to 14 minutes (481 commuters, 16.4%) for males and 10 to 14 minutes (629 commuters, 25.1%) for females.
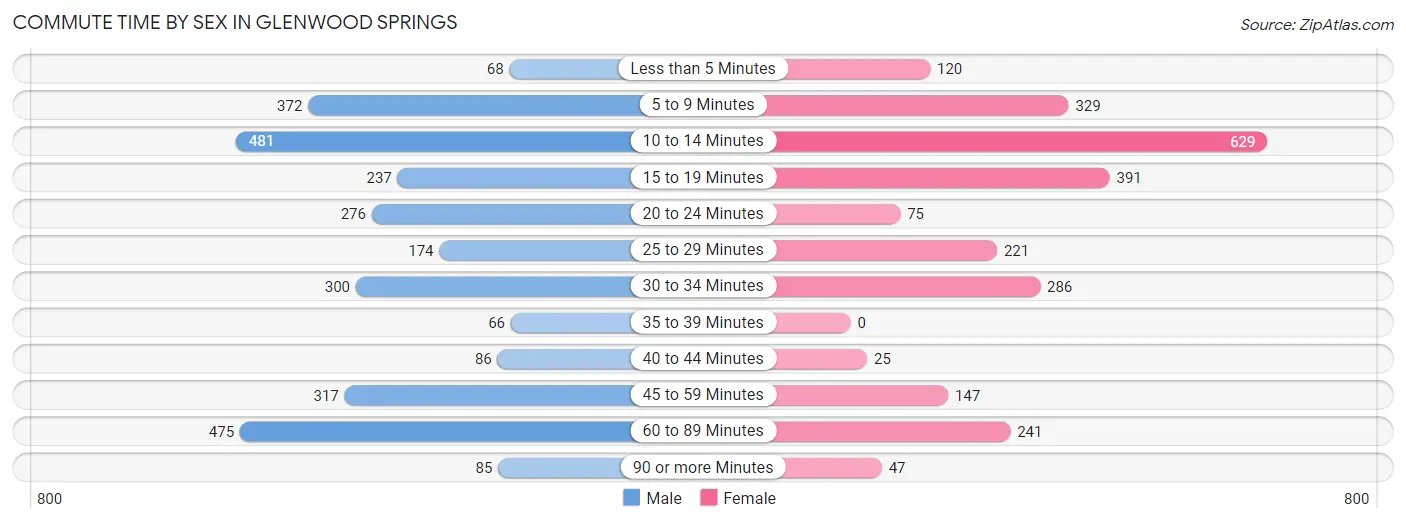
| Commute Time | Male | Female |
| Less than 5 Minutes | 68 (2.3%) | 120 (4.8%) |
| 5 to 9 Minutes | 372 (12.7%) | 329 (13.1%) |
| 10 to 14 Minutes | 481 (16.4%) | 629 (25.1%) |
| 15 to 19 Minutes | 237 (8.1%) | 391 (15.6%) |
| 20 to 24 Minutes | 276 (9.4%) | 75 (3.0%) |
| 25 to 29 Minutes | 174 (5.9%) | 221 (8.8%) |
| 30 to 34 Minutes | 300 (10.2%) | 286 (11.4%) |
| 35 to 39 Minutes | 66 (2.2%) | 0 (0.0%) |
| 40 to 44 Minutes | 86 (2.9%) | 25 (1.0%) |
| 45 to 59 Minutes | 317 (10.8%) | 147 (5.9%) |
| 60 to 89 Minutes | 475 (16.2%) | 241 (9.6%) |
| 90 or more Minutes | 85 (2.9%) | 47 (1.9%) |
Time of Departure to Work by Sex in Glenwood Springs
The most frequent times of departure to work in Glenwood Springs are 7:00 AM to 7:29 AM (566, 19.3%) for males and 7:30 AM to 7:59 AM (551, 21.9%) for females.
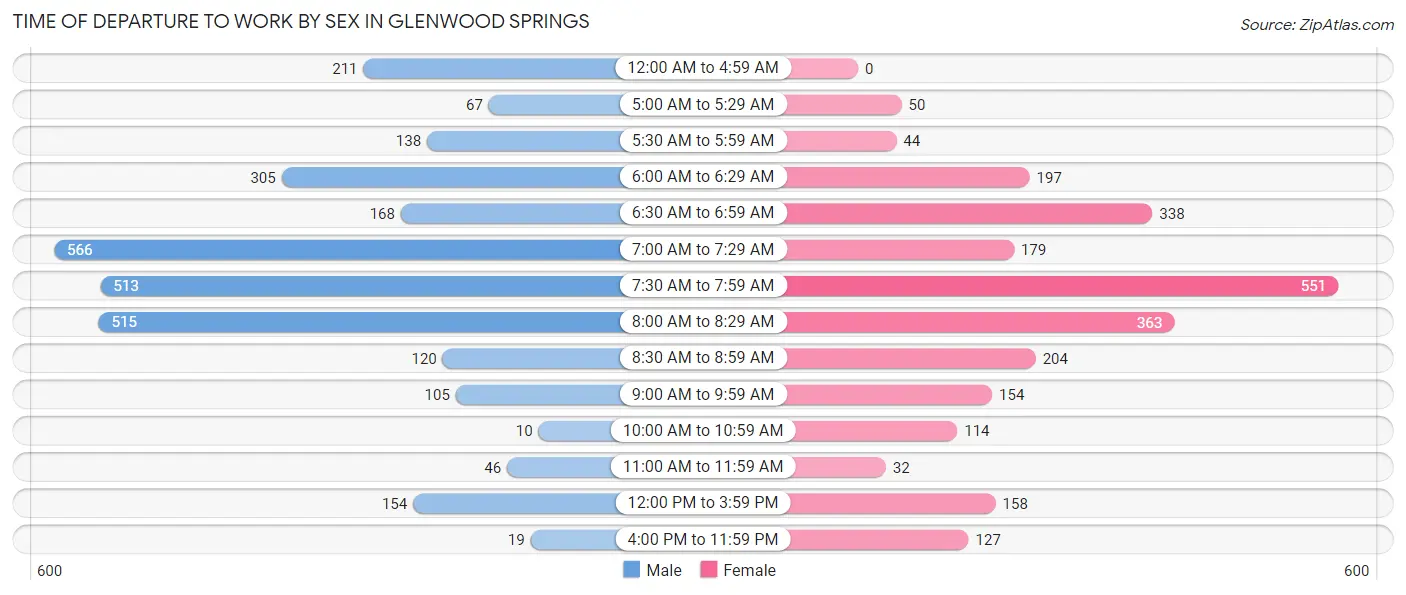
| Time of Departure | Male | Female |
| 12:00 AM to 4:59 AM | 211 (7.2%) | 0 (0.0%) |
| 5:00 AM to 5:29 AM | 67 (2.3%) | 50 (2.0%) |
| 5:30 AM to 5:59 AM | 138 (4.7%) | 44 (1.8%) |
| 6:00 AM to 6:29 AM | 305 (10.4%) | 197 (7.9%) |
| 6:30 AM to 6:59 AM | 168 (5.7%) | 338 (13.5%) |
| 7:00 AM to 7:29 AM | 566 (19.3%) | 179 (7.1%) |
| 7:30 AM to 7:59 AM | 513 (17.5%) | 551 (21.9%) |
| 8:00 AM to 8:29 AM | 515 (17.5%) | 363 (14.5%) |
| 8:30 AM to 8:59 AM | 120 (4.1%) | 204 (8.1%) |
| 9:00 AM to 9:59 AM | 105 (3.6%) | 154 (6.1%) |
| 10:00 AM to 10:59 AM | 10 (0.3%) | 114 (4.5%) |
| 11:00 AM to 11:59 AM | 46 (1.6%) | 32 (1.3%) |
| 12:00 PM to 3:59 PM | 154 (5.2%) | 158 (6.3%) |
| 4:00 PM to 11:59 PM | 19 (0.6%) | 127 (5.1%) |
| Total | 2,937 (100.0%) | 2,511 (100.0%) |
Housing Occupancy in Glenwood Springs
Occupancy by Ownership in Glenwood Springs
Of the total 3,901 dwellings in Glenwood Springs, owner-occupied units account for 2,022 (51.8%), while renter-occupied units make up 1,879 (48.2%).
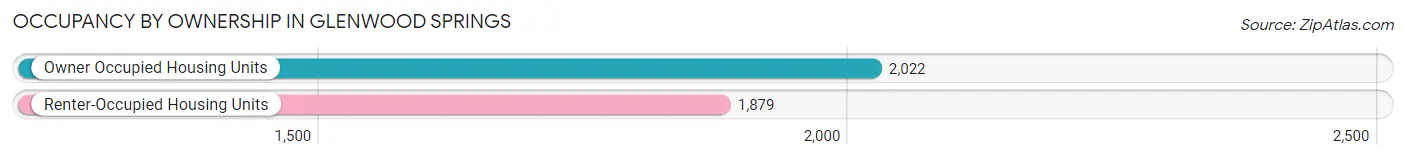
| Occupancy | # Housing Units | % Housing Units |
| Owner Occupied Housing Units | 2,022 | 51.8% |
| Renter-Occupied Housing Units | 1,879 | 48.2% |
| Total Occupied Housing Units | 3,901 | 100.0% |
Occupancy by Household Size in Glenwood Springs
| Household Size | # Housing Units | % Housing Units |
| 1-Person Household | 1,451 | 37.2% |
| 2-Person Household | 1,169 | 30.0% |
| 3-Person Household | 680 | 17.4% |
| 4+ Person Household | 601 | 15.4% |
| Total Housing Units | 3,901 | 100.0% |
Occupancy by Ownership by Household Size in Glenwood Springs
| Household Size | Owner-occupied | Renter-occupied |
| 1-Person Household | 491 (33.8%) | 960 (66.2%) |
| 2-Person Household | 753 (64.4%) | 416 (35.6%) |
| 3-Person Household | 406 (59.7%) | 274 (40.3%) |
| 4+ Person Household | 372 (61.9%) | 229 (38.1%) |
| Total Housing Units | 2,022 (51.8%) | 1,879 (48.2%) |
Occupancy by Educational Attainment in Glenwood Springs
| Household Size | Owner-occupied | Renter-occupied |
| Less than High School | 125 (37.7%) | 207 (62.4%) |
| High School Diploma | 295 (40.1%) | 441 (59.9%) |
| College/Associate Degree | 578 (46.6%) | 663 (53.4%) |
| Bachelor's Degree or higher | 1,024 (64.3%) | 568 (35.7%) |
Occupancy by Age of Householder in Glenwood Springs
| Age Bracket | # Households | % Households |
| Under 35 Years | 776 | 19.9% |
| 35 to 44 Years | 962 | 24.7% |
| 45 to 54 Years | 624 | 16.0% |
| 55 to 64 Years | 707 | 18.1% |
| 65 to 74 Years | 543 | 13.9% |
| 75 to 84 Years | 162 | 4.2% |
| 85 Years and Over | 127 | 3.3% |
| Total | 3,901 | 100.0% |
Housing Finances in Glenwood Springs
Median Income by Occupancy in Glenwood Springs
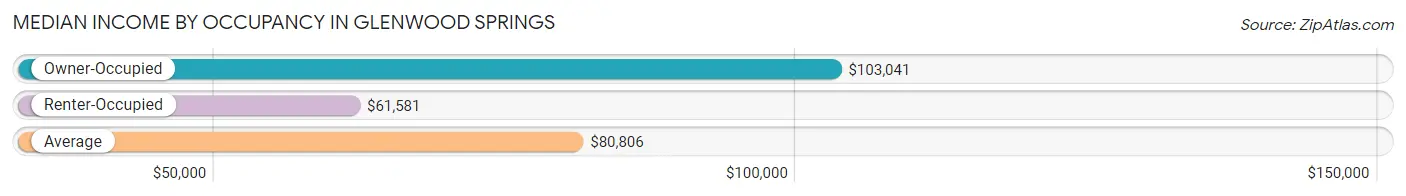
| Occupancy Type | # Households | Median Income |
| Owner-Occupied | 2,022 (51.8%) | $103,041 |
| Renter-Occupied | 1,879 (48.2%) | $61,581 |
| Average | 3,901 (100.0%) | $80,806 |
Occupancy by Householder Income Bracket in Glenwood Springs
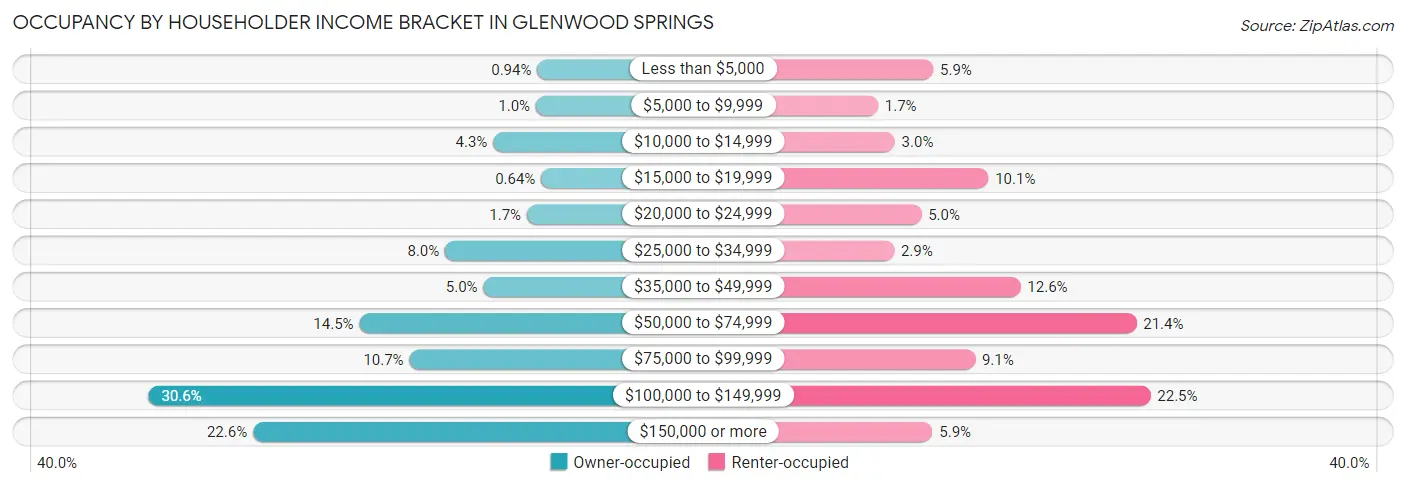
| Income Bracket | Owner-occupied | Renter-occupied |
| Less than $5,000 | 19 (0.9%) | 111 (5.9%) |
| $5,000 to $9,999 | 21 (1.0%) | 32 (1.7%) |
| $10,000 to $14,999 | 87 (4.3%) | 56 (3.0%) |
| $15,000 to $19,999 | 13 (0.6%) | 190 (10.1%) |
| $20,000 to $24,999 | 35 (1.7%) | 94 (5.0%) |
| $25,000 to $34,999 | 161 (8.0%) | 55 (2.9%) |
| $35,000 to $49,999 | 102 (5.0%) | 236 (12.6%) |
| $50,000 to $74,999 | 293 (14.5%) | 402 (21.4%) |
| $75,000 to $99,999 | 216 (10.7%) | 171 (9.1%) |
| $100,000 to $149,999 | 618 (30.6%) | 422 (22.5%) |
| $150,000 or more | 457 (22.6%) | 110 (5.9%) |
| Total | 2,022 (100.0%) | 1,879 (100.0%) |
Monthly Housing Cost Tiers in Glenwood Springs
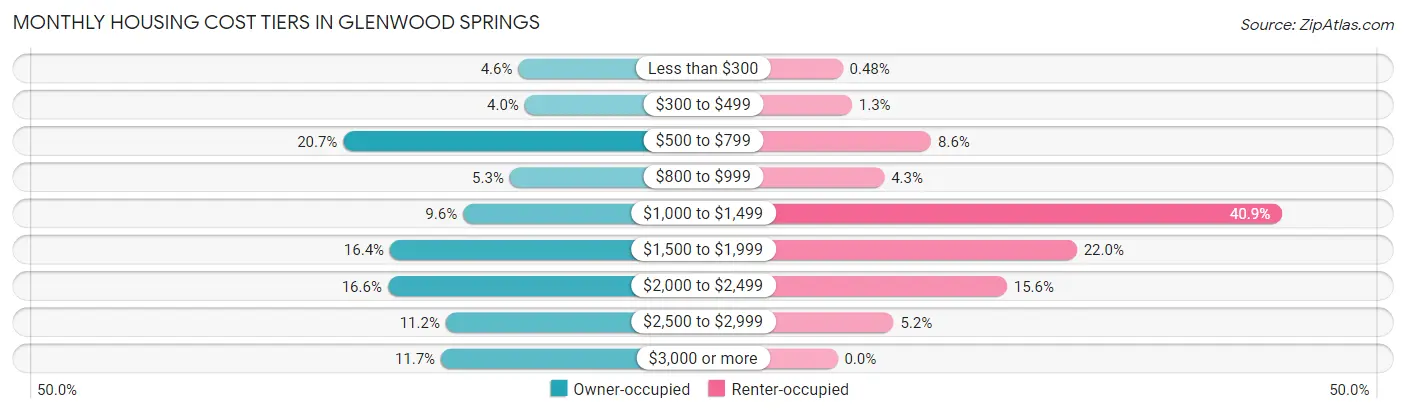
| Monthly Cost | Owner-occupied | Renter-occupied |
| Less than $300 | 92 (4.5%) | 9 (0.5%) |
| $300 to $499 | 80 (4.0%) | 25 (1.3%) |
| $500 to $799 | 418 (20.7%) | 162 (8.6%) |
| $800 to $999 | 108 (5.3%) | 81 (4.3%) |
| $1,000 to $1,499 | 195 (9.6%) | 769 (40.9%) |
| $1,500 to $1,999 | 331 (16.4%) | 414 (22.0%) |
| $2,000 to $2,499 | 335 (16.6%) | 293 (15.6%) |
| $2,500 to $2,999 | 227 (11.2%) | 97 (5.2%) |
| $3,000 or more | 236 (11.7%) | 0 (0.0%) |
| Total | 2,022 (100.0%) | 1,879 (100.0%) |
Physical Housing Characteristics in Glenwood Springs
Housing Structures in Glenwood Springs
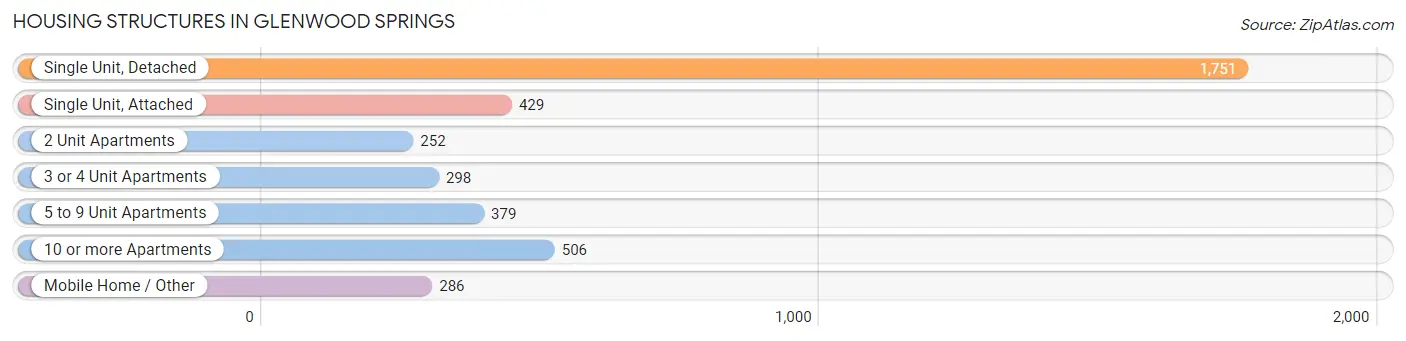
| Structure Type | # Housing Units | % Housing Units |
| Single Unit, Detached | 1,751 | 44.9% |
| Single Unit, Attached | 429 | 11.0% |
| 2 Unit Apartments | 252 | 6.5% |
| 3 or 4 Unit Apartments | 298 | 7.6% |
| 5 to 9 Unit Apartments | 379 | 9.7% |
| 10 or more Apartments | 506 | 13.0% |
| Mobile Home / Other | 286 | 7.3% |
| Total | 3,901 | 100.0% |
Housing Structures by Occupancy in Glenwood Springs
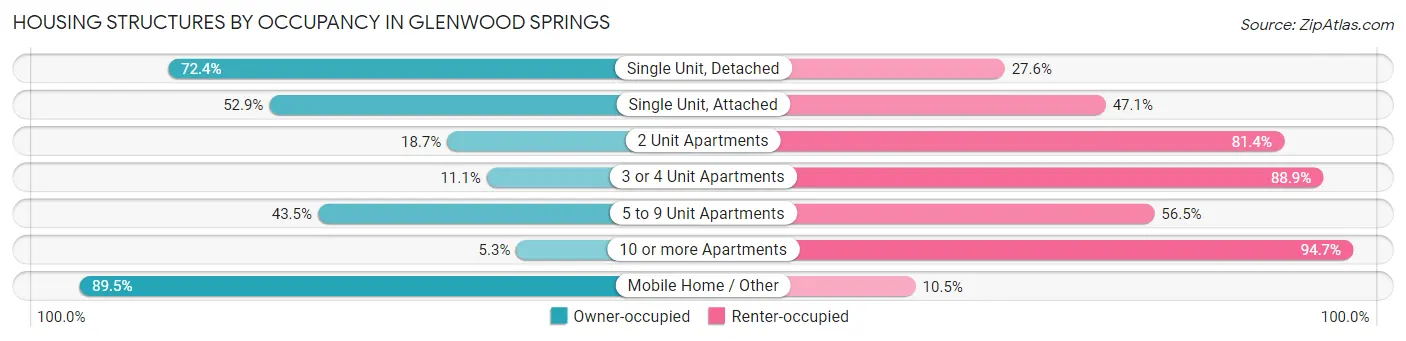
| Structure Type | Owner-occupied | Renter-occupied |
| Single Unit, Detached | 1,267 (72.4%) | 484 (27.6%) |
| Single Unit, Attached | 227 (52.9%) | 202 (47.1%) |
| 2 Unit Apartments | 47 (18.6%) | 205 (81.4%) |
| 3 or 4 Unit Apartments | 33 (11.1%) | 265 (88.9%) |
| 5 to 9 Unit Apartments | 165 (43.5%) | 214 (56.5%) |
| 10 or more Apartments | 27 (5.3%) | 479 (94.7%) |
| Mobile Home / Other | 256 (89.5%) | 30 (10.5%) |
| Total | 2,022 (51.8%) | 1,879 (48.2%) |
Housing Structures by Number of Rooms in Glenwood Springs
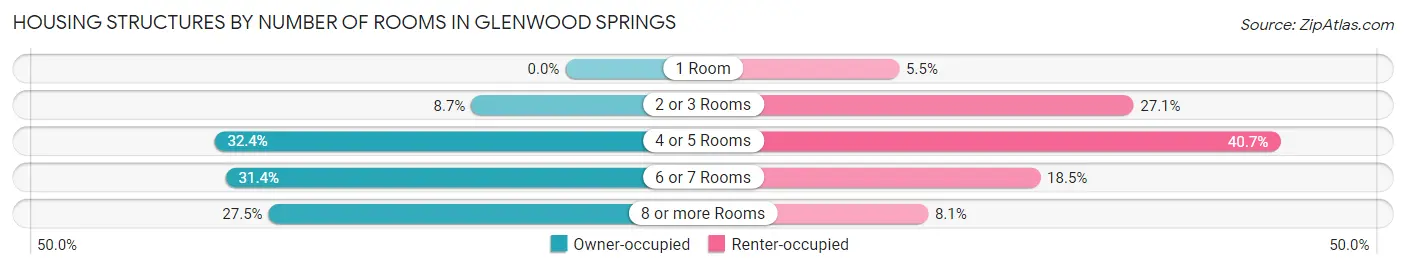
| Number of Rooms | Owner-occupied | Renter-occupied |
| 1 Room | 0 (0.0%) | 103 (5.5%) |
| 2 or 3 Rooms | 176 (8.7%) | 510 (27.1%) |
| 4 or 5 Rooms | 656 (32.4%) | 765 (40.7%) |
| 6 or 7 Rooms | 635 (31.4%) | 348 (18.5%) |
| 8 or more Rooms | 555 (27.5%) | 153 (8.1%) |
| Total | 2,022 (100.0%) | 1,879 (100.0%) |
Housing Structure by Heating Type in Glenwood Springs
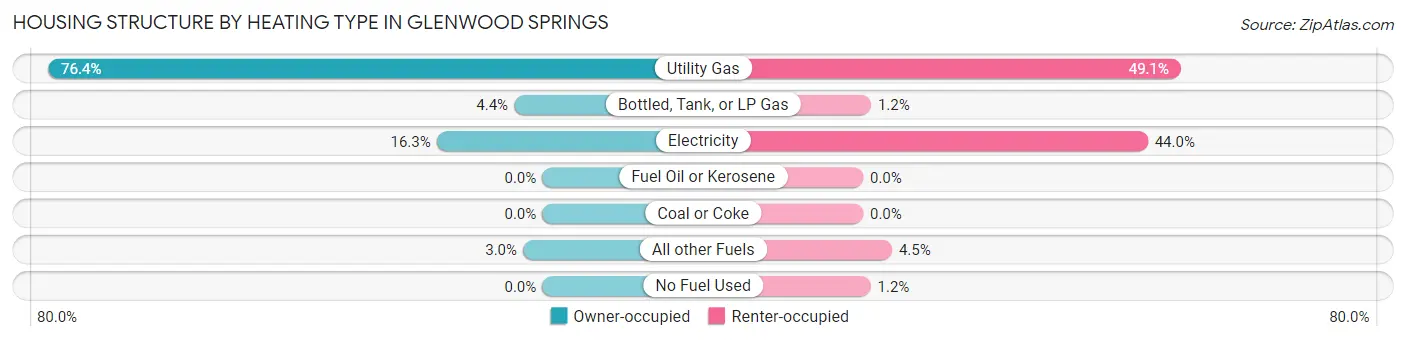
| Heating Type | Owner-occupied | Renter-occupied |
| Utility Gas | 1,544 (76.4%) | 923 (49.1%) |
| Bottled, Tank, or LP Gas | 88 (4.3%) | 23 (1.2%) |
| Electricity | 330 (16.3%) | 827 (44.0%) |
| Fuel Oil or Kerosene | 0 (0.0%) | 0 (0.0%) |
| Coal or Coke | 0 (0.0%) | 0 (0.0%) |
| All other Fuels | 60 (3.0%) | 84 (4.5%) |
| No Fuel Used | 0 (0.0%) | 22 (1.2%) |
| Total | 2,022 (100.0%) | 1,879 (100.0%) |
Household Vehicle Usage in Glenwood Springs
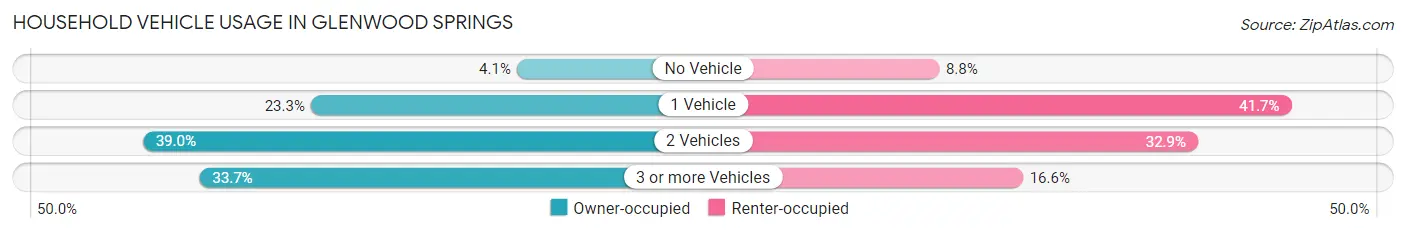
| Vehicles per Household | Owner-occupied | Renter-occupied |
| No Vehicle | 82 (4.1%) | 165 (8.8%) |
| 1 Vehicle | 471 (23.3%) | 783 (41.7%) |
| 2 Vehicles | 788 (39.0%) | 619 (32.9%) |
| 3 or more Vehicles | 681 (33.7%) | 312 (16.6%) |
| Total | 2,022 (100.0%) | 1,879 (100.0%) |
Real Estate & Mortgages in Glenwood Springs
Real Estate and Mortgage Overview in Glenwood Springs
| Characteristic | Without Mortgage | With Mortgage |
| Housing Units | 707 | 1,315 |
| Median Property Value | $473,300 | $550,300 |
| Median Household Income | $79,531 | $348 |
| Monthly Housing Costs | $615 | $236 |
| Real Estate Taxes | $2,104 | $56 |
Property Value by Mortgage Status in Glenwood Springs
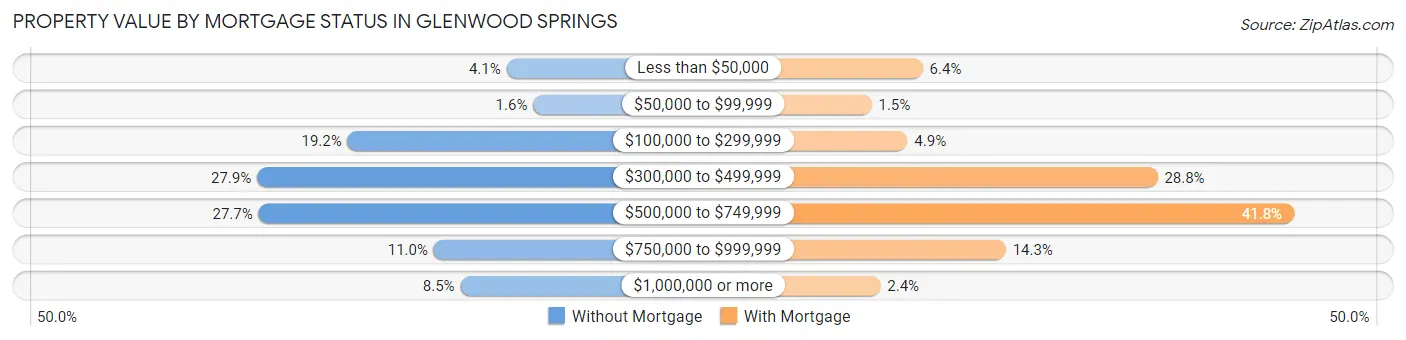
| Property Value | Without Mortgage | With Mortgage |
| Less than $50,000 | 29 (4.1%) | 84 (6.4%) |
| $50,000 to $99,999 | 11 (1.6%) | 20 (1.5%) |
| $100,000 to $299,999 | 136 (19.2%) | 65 (4.9%) |
| $300,000 to $499,999 | 197 (27.9%) | 378 (28.7%) |
| $500,000 to $749,999 | 196 (27.7%) | 549 (41.7%) |
| $750,000 to $999,999 | 78 (11.0%) | 188 (14.3%) |
| $1,000,000 or more | 60 (8.5%) | 31 (2.4%) |
| Total | 707 (100.0%) | 1,315 (100.0%) |
Household Income by Mortgage Status in Glenwood Springs
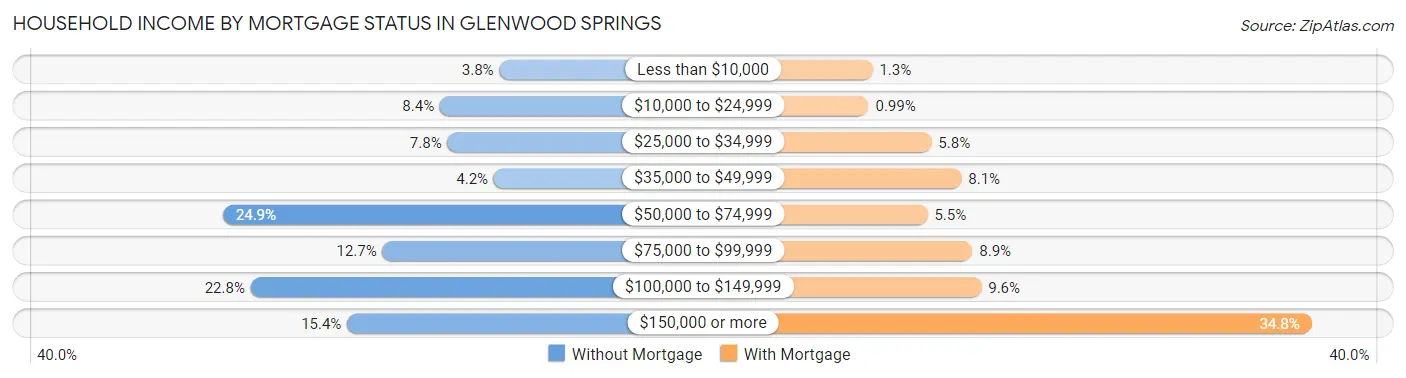
| Household Income | Without Mortgage | With Mortgage |
| Less than $10,000 | 27 (3.8%) | 17 (1.3%) |
| $10,000 to $24,999 | 59 (8.4%) | 13 (1.0%) |
| $25,000 to $34,999 | 55 (7.8%) | 76 (5.8%) |
| $35,000 to $49,999 | 30 (4.2%) | 106 (8.1%) |
| $50,000 to $74,999 | 176 (24.9%) | 72 (5.5%) |
| $75,000 to $99,999 | 90 (12.7%) | 117 (8.9%) |
| $100,000 to $149,999 | 161 (22.8%) | 126 (9.6%) |
| $150,000 or more | 109 (15.4%) | 457 (34.7%) |
| Total | 707 (100.0%) | 1,315 (100.0%) |
Property Value to Household Income Ratio in Glenwood Springs
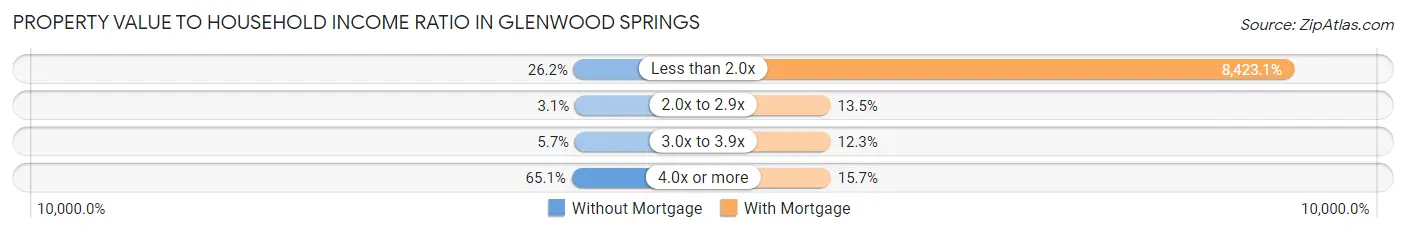
| Value-to-Income Ratio | Without Mortgage | With Mortgage |
| Less than 2.0x | 185 (26.2%) | 110,764 (8,423.1%) |
| 2.0x to 2.9x | 22 (3.1%) | 177 (13.5%) |
| 3.0x to 3.9x | 40 (5.7%) | 162 (12.3%) |
| 4.0x or more | 460 (65.1%) | 206 (15.7%) |
| Total | 707 (100.0%) | 1,315 (100.0%) |
Real Estate Taxes by Mortgage Status in Glenwood Springs
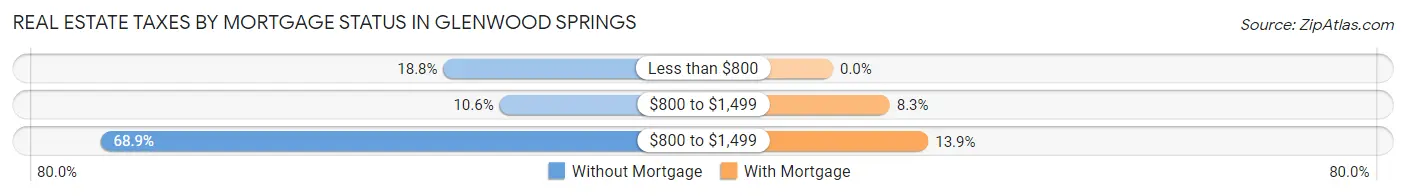
| Property Taxes | Without Mortgage | With Mortgage |
| Less than $800 | 133 (18.8%) | 0 (0.0%) |
| $800 to $1,499 | 75 (10.6%) | 109 (8.3%) |
| $800 to $1,499 | 487 (68.9%) | 183 (13.9%) |
| Total | 707 (100.0%) | 1,315 (100.0%) |
Health & Disability in Glenwood Springs
Health Insurance Coverage by Age in Glenwood Springs
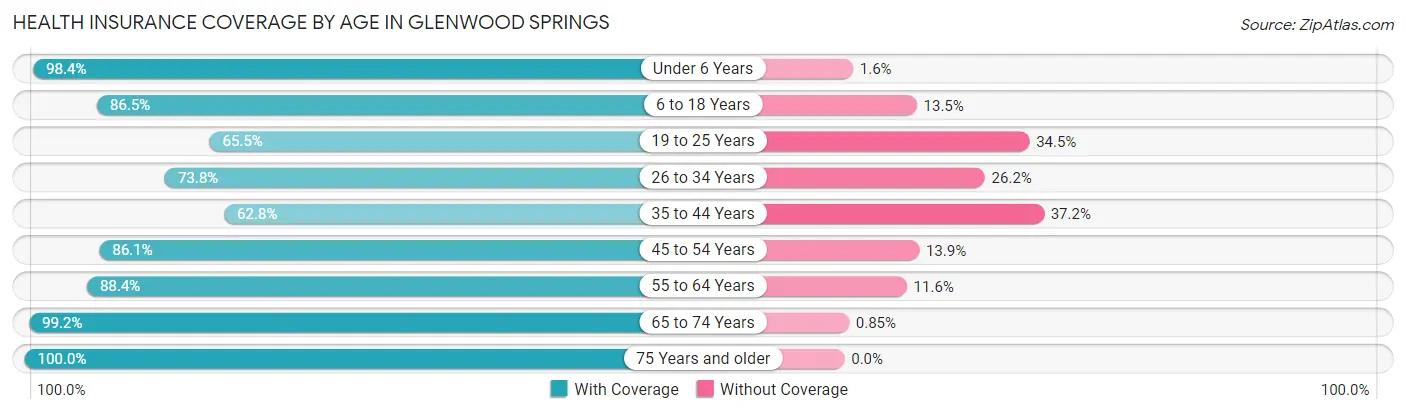
| Age Bracket | With Coverage | Without Coverage |
| Under 6 Years | 554 (98.4%) | 9 (1.6%) |
| 6 to 18 Years | 1,591 (86.5%) | 248 (13.5%) |
| 19 to 25 Years | 496 (65.5%) | 261 (34.5%) |
| 26 to 34 Years | 1,139 (73.8%) | 404 (26.2%) |
| 35 to 44 Years | 1,086 (62.8%) | 643 (37.2%) |
| 45 to 54 Years | 859 (86.1%) | 139 (13.9%) |
| 55 to 64 Years | 1,087 (88.4%) | 143 (11.6%) |
| 65 to 74 Years | 815 (99.2%) | 7 (0.9%) |
| 75 Years and older | 482 (100.0%) | 0 (0.0%) |
| Total | 8,109 (81.4%) | 1,854 (18.6%) |
Health Insurance Coverage by Citizenship Status in Glenwood Springs
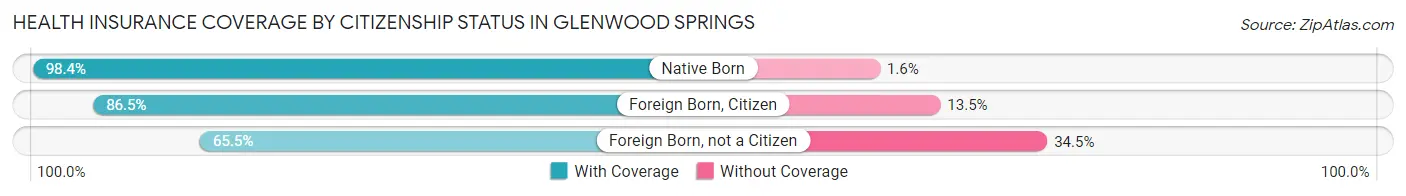
| Citizenship Status | With Coverage | Without Coverage |
| Native Born | 554 (98.4%) | 9 (1.6%) |
| Foreign Born, Citizen | 1,591 (86.5%) | 248 (13.5%) |
| Foreign Born, not a Citizen | 496 (65.5%) | 261 (34.5%) |
Health Insurance Coverage by Household Income in Glenwood Springs
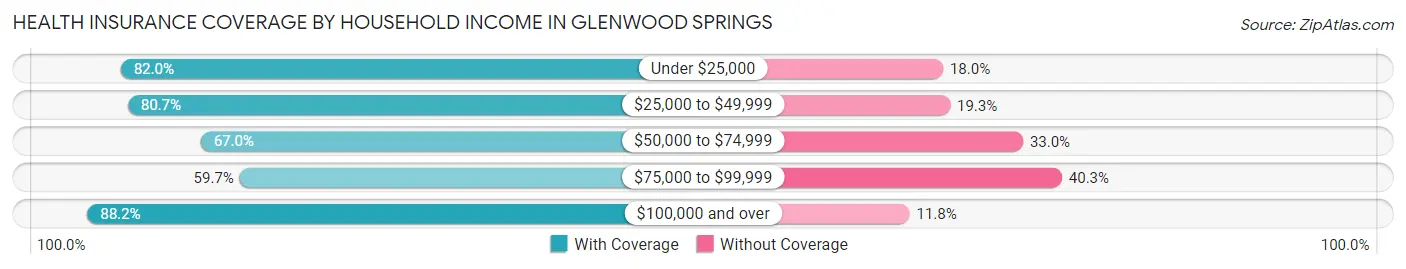
| Household Income | With Coverage | Without Coverage |
| Under $25,000 | 846 (82.0%) | 186 (18.0%) |
| $25,000 to $49,999 | 730 (80.7%) | 175 (19.3%) |
| $50,000 to $74,999 | 950 (67.0%) | 468 (33.0%) |
| $75,000 to $99,999 | 532 (59.7%) | 359 (40.3%) |
| $100,000 and over | 4,996 (88.2%) | 666 (11.8%) |
Public vs Private Health Insurance Coverage by Age in Glenwood Springs
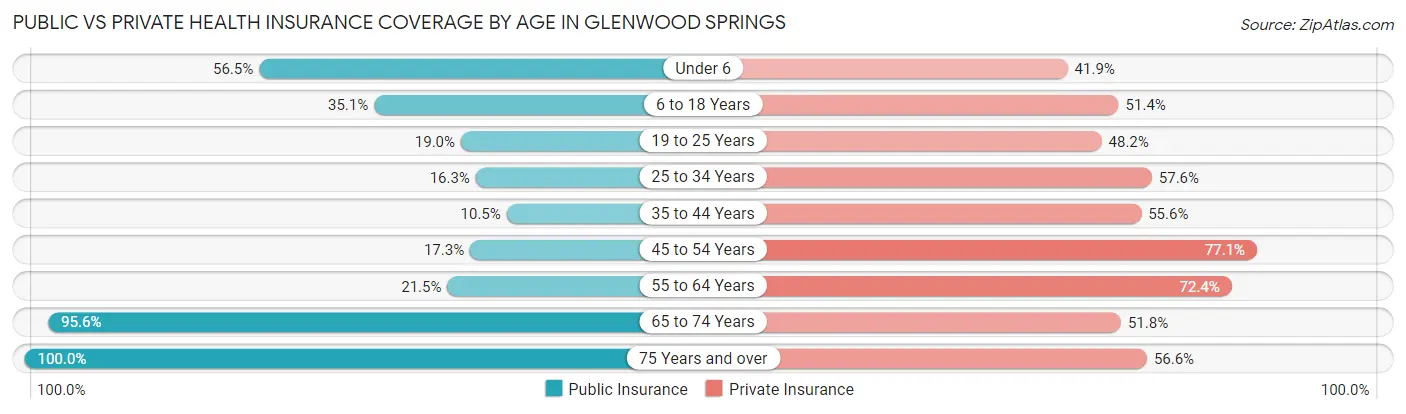
| Age Bracket | Public Insurance | Private Insurance |
| Under 6 | 318 (56.5%) | 236 (41.9%) |
| 6 to 18 Years | 646 (35.1%) | 945 (51.4%) |
| 19 to 25 Years | 144 (19.0%) | 365 (48.2%) |
| 25 to 34 Years | 251 (16.3%) | 888 (57.6%) |
| 35 to 44 Years | 182 (10.5%) | 961 (55.6%) |
| 45 to 54 Years | 173 (17.3%) | 769 (77.0%) |
| 55 to 64 Years | 265 (21.5%) | 890 (72.4%) |
| 65 to 74 Years | 786 (95.6%) | 426 (51.8%) |
| 75 Years and over | 482 (100.0%) | 273 (56.6%) |
| Total | 3,247 (32.6%) | 5,753 (57.7%) |
Disability Status by Sex by Age in Glenwood Springs
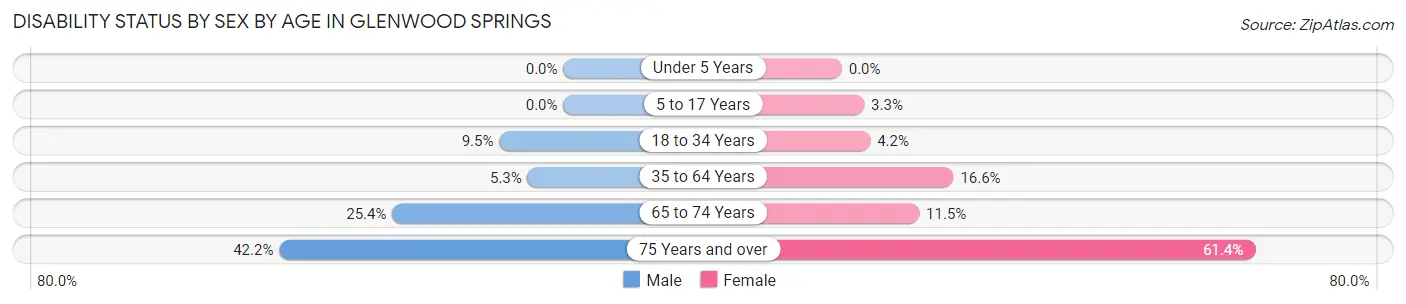
| Age Bracket | Male | Female |
| Under 5 Years | 0 (0.0%) | 0 (0.0%) |
| 5 to 17 Years | 0 (0.0%) | 31 (3.3%) |
| 18 to 34 Years | 122 (9.5%) | 52 (4.2%) |
| 35 to 64 Years | 114 (5.3%) | 300 (16.6%) |
| 65 to 74 Years | 96 (25.4%) | 51 (11.5%) |
| 75 Years and over | 81 (42.2%) | 178 (61.4%) |
Disability Class by Sex by Age in Glenwood Springs
Disability Class: Hearing Difficulty
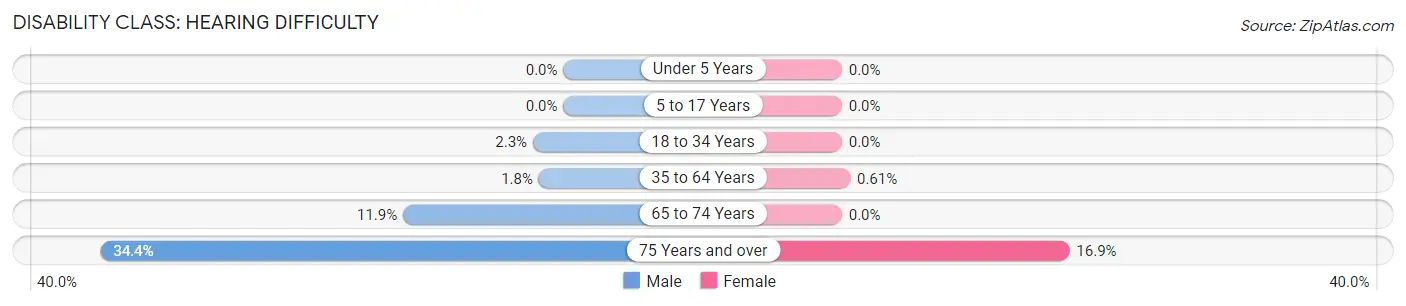
| Age Bracket | Male | Female |
| Under 5 Years | 0 (0.0%) | 0 (0.0%) |
| 5 to 17 Years | 0 (0.0%) | 0 (0.0%) |
| 18 to 34 Years | 29 (2.3%) | 0 (0.0%) |
| 35 to 64 Years | 39 (1.8%) | 11 (0.6%) |
| 65 to 74 Years | 45 (11.9%) | 0 (0.0%) |
| 75 Years and over | 66 (34.4%) | 49 (16.9%) |
Disability Class: Vision Difficulty
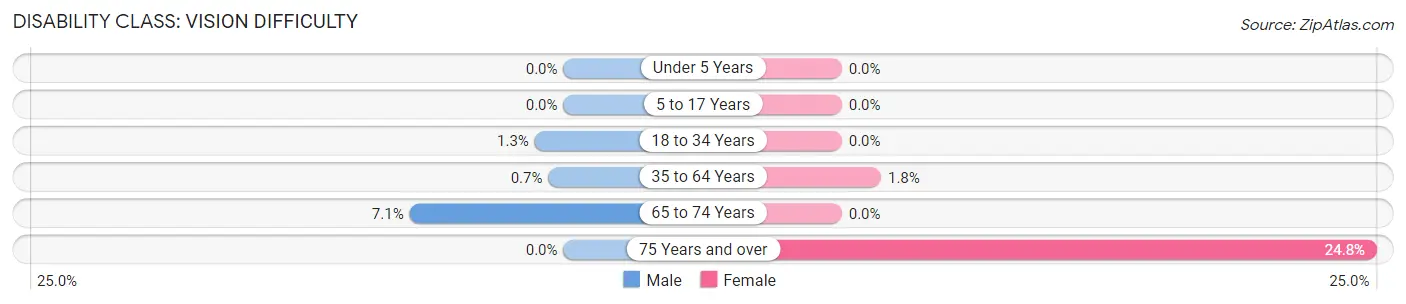
| Age Bracket | Male | Female |
| Under 5 Years | 0 (0.0%) | 0 (0.0%) |
| 5 to 17 Years | 0 (0.0%) | 0 (0.0%) |
| 18 to 34 Years | 17 (1.3%) | 0 (0.0%) |
| 35 to 64 Years | 15 (0.7%) | 33 (1.8%) |
| 65 to 74 Years | 27 (7.1%) | 0 (0.0%) |
| 75 Years and over | 0 (0.0%) | 72 (24.8%) |
Disability Class: Cognitive Difficulty
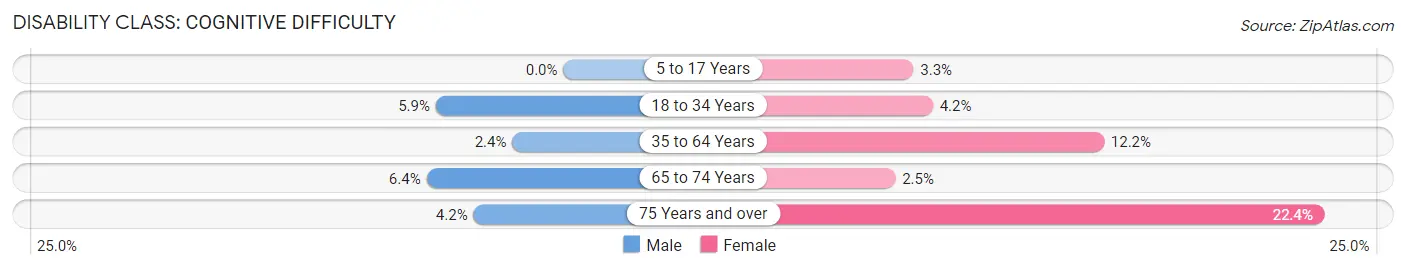
| Age Bracket | Male | Female |
| 5 to 17 Years | 0 (0.0%) | 31 (3.3%) |
| 18 to 34 Years | 76 (5.9%) | 52 (4.2%) |
| 35 to 64 Years | 51 (2.4%) | 220 (12.2%) |
| 65 to 74 Years | 24 (6.4%) | 11 (2.5%) |
| 75 Years and over | 8 (4.2%) | 65 (22.4%) |
Disability Class: Ambulatory Difficulty
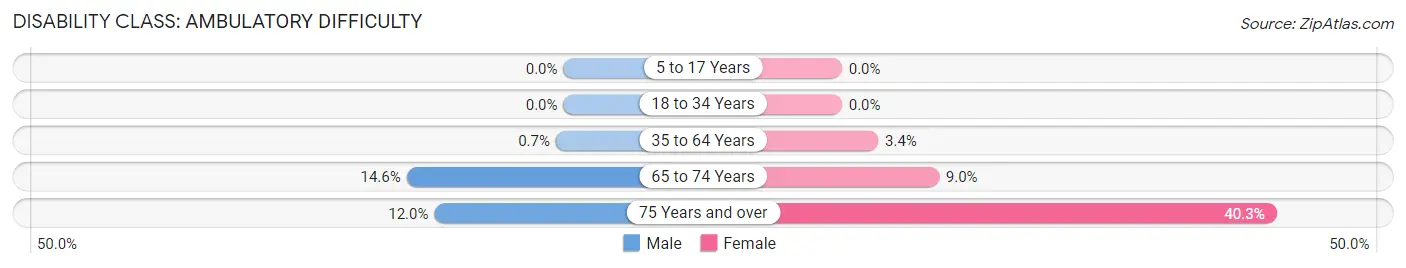
| Age Bracket | Male | Female |
| 5 to 17 Years | 0 (0.0%) | 0 (0.0%) |
| 18 to 34 Years | 0 (0.0%) | 0 (0.0%) |
| 35 to 64 Years | 15 (0.7%) | 61 (3.4%) |
| 65 to 74 Years | 55 (14.5%) | 40 (9.0%) |
| 75 Years and over | 23 (12.0%) | 117 (40.3%) |
Disability Class: Self-Care Difficulty
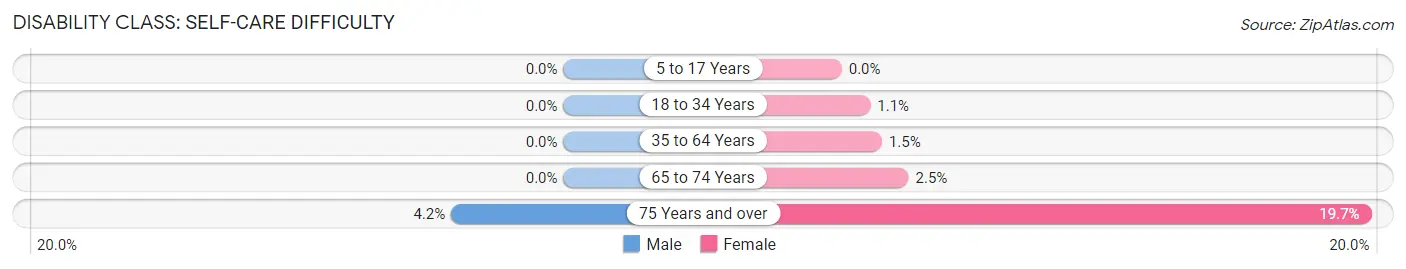
| Age Bracket | Male | Female |
| 5 to 17 Years | 0 (0.0%) | 0 (0.0%) |
| 18 to 34 Years | 0 (0.0%) | 13 (1.1%) |
| 35 to 64 Years | 0 (0.0%) | 27 (1.5%) |
| 65 to 74 Years | 0 (0.0%) | 11 (2.5%) |
| 75 Years and over | 8 (4.2%) | 57 (19.7%) |
Technology Access in Glenwood Springs
Computing Device Access in Glenwood Springs
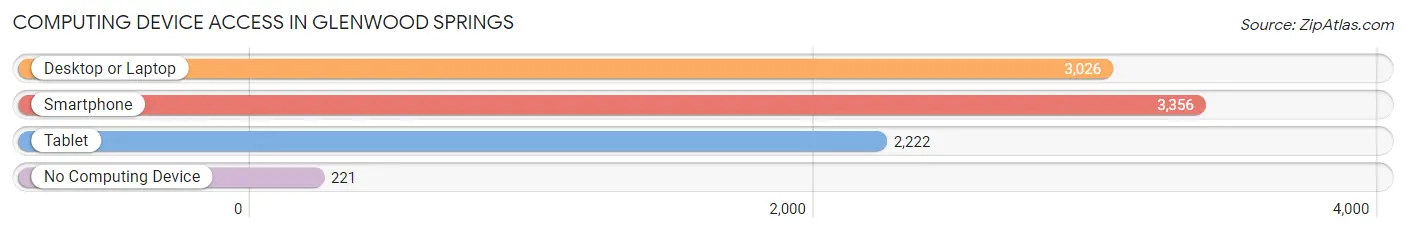
| Device Type | # Households | % Households |
| Desktop or Laptop | 3,026 | 77.6% |
| Smartphone | 3,356 | 86.0% |
| Tablet | 2,222 | 57.0% |
| No Computing Device | 221 | 5.7% |
| Total | 3,901 | 100.0% |
Internet Access in Glenwood Springs
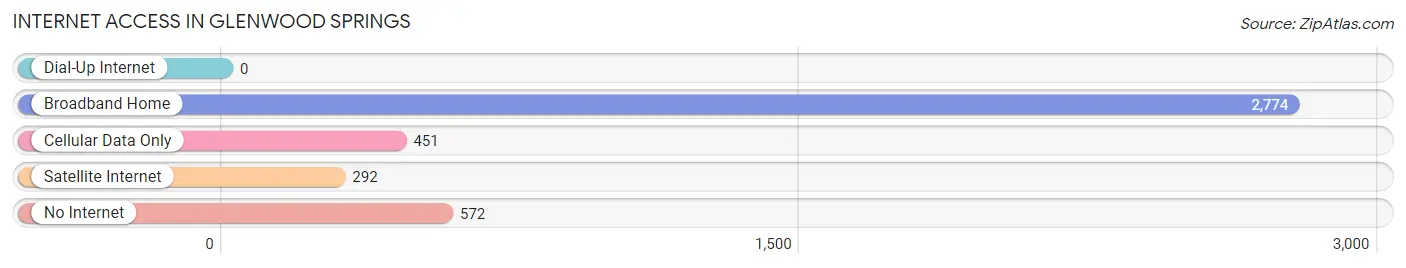
| Internet Type | # Households | % Households |
| Dial-Up Internet | 0 | 0.0% |
| Broadband Home | 2,774 | 71.1% |
| Cellular Data Only | 451 | 11.6% |
| Satellite Internet | 292 | 7.5% |
| No Internet | 572 | 14.7% |
| Total | 3,901 | 100.0% |
Glenwood Springs Summary
Glenwood Springs is a city located in Garfield County, Colorado, United States. It is the county seat and the most populous city in the county. The city is located in the Roaring Fork Valley, along the Colorado River, approximately midway between Aspen and Vail. It is known for its hot springs, the world's largest mineral hot springs pool, and for being the location of the Glenwood Caverns Adventure Park.
History
The area around Glenwood Springs was first inhabited by the Ute Indians, who used the hot springs for healing and spiritual ceremonies. The first recorded exploration of the area was by Major John Wesley Powell in 1869. The area was later settled by miners and ranchers in the late 1800s.
In 1883, the Denver and Rio Grande Railroad arrived in the area, and the town of Glenwood Springs was founded. The town was named after the nearby hot springs, which were discovered by a prospector named Isaac Cooper in 1883. The hot springs were developed into a resort, and the town quickly grew in popularity.
In the early 1900s, Glenwood Springs became a popular destination for tourists, and the town's economy flourished. The town was also home to a number of famous people, including Buffalo Bill Cody, Doc Holliday, and Butch Cassidy.
Geography
Glenwood Springs is located in the Roaring Fork Valley, along the Colorado River. The city is situated at an elevation of 5,735 feet (1,749 m). The city is surrounded by mountains, including the Flat Tops, the Grand Hogback, and the Roaring Fork Mountains.
The city has a total area of 8.2 square miles (21.2 km2), of which 8.1 square miles (21.0 km2) is land and 0.1 square miles (0.2 km2) is water.
Economy
The economy of Glenwood Springs is largely based on tourism. The city is home to a number of attractions, including the Glenwood Hot Springs Pool, the Glenwood Caverns Adventure Park, and the Iron Mountain Hot Springs. The city is also home to a number of restaurants, shops, and other businesses.
The city is also home to a number of industries, including oil and gas, agriculture, and manufacturing. The city is home to a number of companies, including the Rocky Mountain Chocolate Factory, the Glenwood Springs Brewing Company, and the Glenwood Springs Post Independent newspaper.
Demographics
As of the 2010 census, the population of Glenwood Springs was 9,614. The racial makeup of the city was 91.3% White, 0.7% African American, 0.7% Native American, 0.9% Asian, 0.1% Pacific Islander, 4.2% from other races, and 2.1% from two or more races. Hispanic or Latino of any race were 10.3% of the population.
The median income for a household in the city was $50,945, and the median income for a family was $60,945. The per capita income for the city was $27,945. About 8.3% of families and 11.2% of the population were below the poverty line, including 15.2% of those under age 18 and 6.2% of those age 65 or over.
Common Questions
What is Per Capita Income in Glenwood Springs?
Per Capita income in Glenwood Springs is $38,954.
What is the Median Family Income in Glenwood Springs?
Median Family Income in Glenwood Springs is $99,245.
What is the Median Household income in Glenwood Springs?
Median Household Income in Glenwood Springs is $80,806.
What is Income or Wage Gap in Glenwood Springs?
Income or Wage Gap in Glenwood Springs is 24.0%.
Women in Glenwood Springs earn 76.0 cents for every dollar earned by a man.
What is Family Income Deficit in Glenwood Springs?
Family Income Deficit in Glenwood Springs is $6,772.
Families that are below poverty line in Glenwood Springs earn $6,772 less on average than the poverty threshold level.
What is Inequality or Gini Index in Glenwood Springs?
Inequality or Gini Index in Glenwood Springs is 0.41.
What is the Total Population of Glenwood Springs?
Total Population of Glenwood Springs is 10,100.
What is the Total Male Population of Glenwood Springs?
Total Male Population of Glenwood Springs is 5,096.
What is the Total Female Population of Glenwood Springs?
Total Female Population of Glenwood Springs is 5,004.
What is the Ratio of Males per 100 Females in Glenwood Springs?
There are 101.84 Males per 100 Females in Glenwood Springs.
What is the Ratio of Females per 100 Males in Glenwood Springs?
There are 98.19 Females per 100 Males in Glenwood Springs.
What is the Median Population Age in Glenwood Springs?
Median Population Age in Glenwood Springs is 36.7 Years.
What is the Average Family Size in Glenwood Springs
Average Family Size in Glenwood Springs is 3.4 People.
What is the Average Household Size in Glenwood Springs
Average Household Size in Glenwood Springs is 2.5 People.
How Large is the Labor Force in Glenwood Springs?
There are 6,250 People in the Labor Forcein in Glenwood Springs.
What is the Percentage of People in the Labor Force in Glenwood Springs?
75.1% of People are in the Labor Force in Glenwood Springs.
What is the Unemployment Rate in Glenwood Springs?
Unemployment Rate in Glenwood Springs is 3.1%.