Lafayette, CO Map & Demographics
Lafayette Map
Lafayette Overview
$59,338
PER CAPITA INCOME
$131,329
AVG FAMILY INCOME
$105,819
AVG HOUSEHOLD INCOME
30.8%
WAGE / INCOME GAP [ % ]
69.2¢/ $1
WAGE / INCOME GAP [ $ ]
0.44
INEQUALITY / GINI INDEX
30,295
TOTAL POPULATION
14,949
MALE POPULATION
15,346
FEMALE POPULATION
97.41
MALES / 100 FEMALES
102.66
FEMALES / 100 MALES
38.7
MEDIAN AGE
2.9
AVG FAMILY SIZE
2.4
AVG HOUSEHOLD SIZE
18,058
LABOR FORCE [ PEOPLE ]
75.6%
PERCENT IN LABOR FORCE
3.7%
UNEMPLOYMENT RATE
Lafayette Zip Codes
Lafayette Area Codes
Income in Lafayette
Income Overview in Lafayette
Per Capita Income in Lafayette is $59,338, while median incomes of families and households are $131,329 and $105,819 respectively.
| Characteristic | Number | Measure |
| Per Capita Income | 30,295 | $59,338 |
| Median Family Income | 7,805 | $131,329 |
| Mean Family Income | 7,805 | $167,605 |
| Median Household Income | 12,707 | $105,819 |
| Mean Household Income | 12,707 | $141,229 |
| Income Deficit | 7,805 | $0 |
| Wage / Income Gap (%) | 30,295 | 30.81% |
| Wage / Income Gap ($) | 30,295 | 69.19¢ per $1 |
| Gini / Inequality Index | 30,295 | 0.44 |
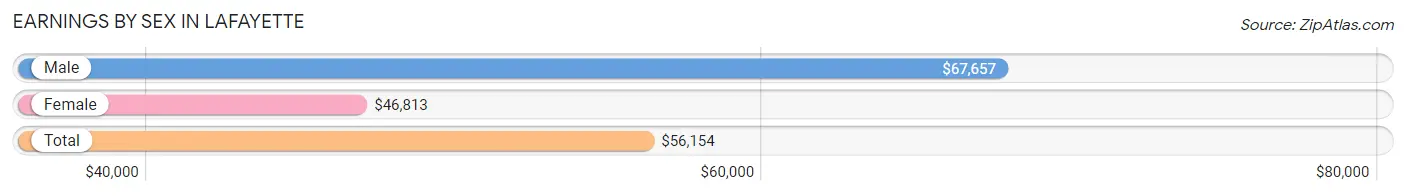
Earnings by Sex in Lafayette
Average Earnings in Lafayette are $56,154, $67,657 for men and $46,813 for women, a difference of 30.8%.
| Sex | Number | Average Earnings |
| Male | 9,802 (52.8%) | $67,657 |
| Female | 8,747 (47.2%) | $46,813 |
| Total | 18,549 (100.0%) | $56,154 |
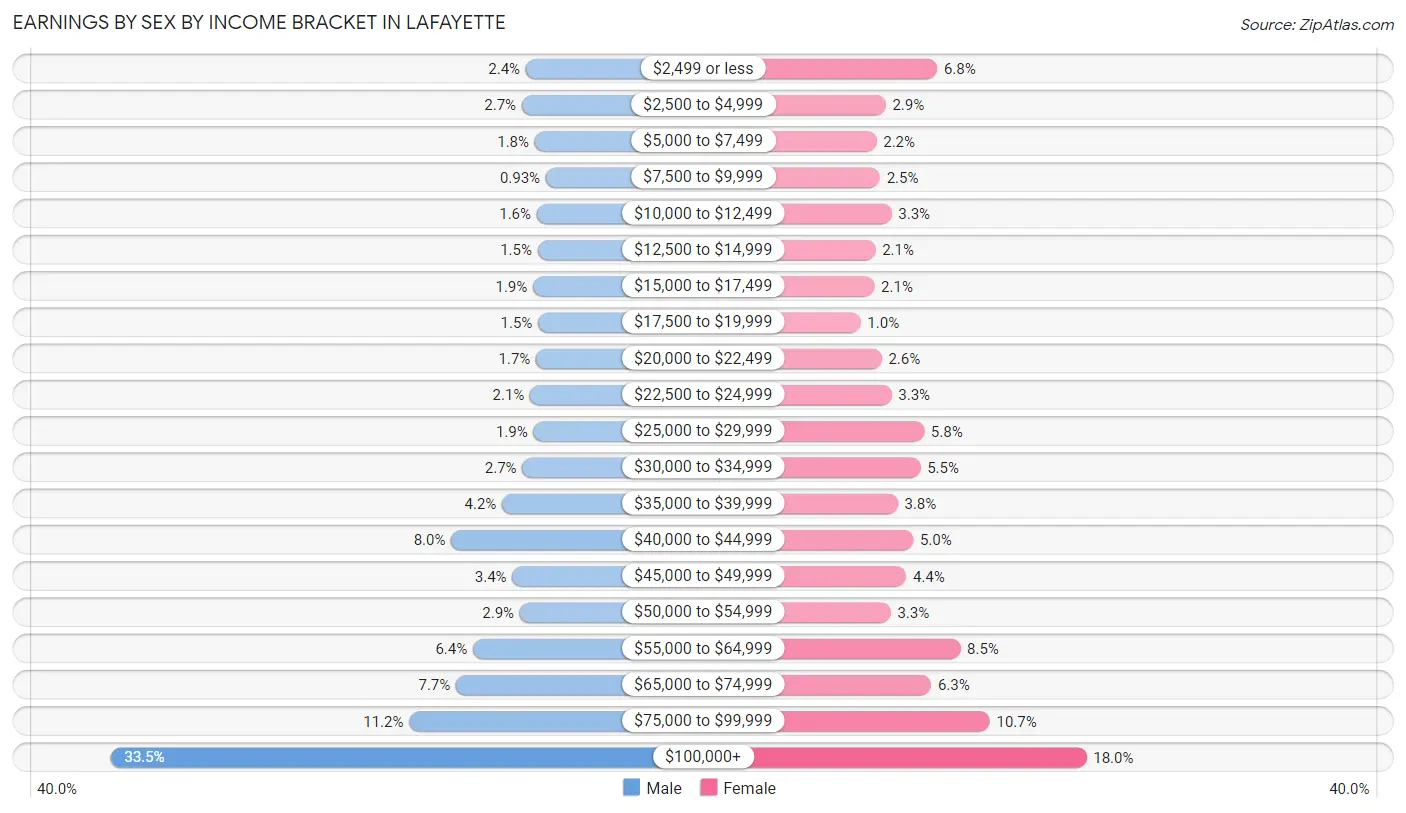
Earnings by Sex by Income Bracket in Lafayette
The most common earnings brackets in Lafayette are $100,000+ for men (3,284 | 33.5%) and $100,000+ for women (1,570 | 17.9%).
| Income | Male | Female |
| $2,499 or less | 238 (2.4%) | 591 (6.8%) |
| $2,500 to $4,999 | 268 (2.7%) | 254 (2.9%) |
| $5,000 to $7,499 | 173 (1.8%) | 193 (2.2%) |
| $7,500 to $9,999 | 91 (0.9%) | 216 (2.5%) |
| $10,000 to $12,499 | 158 (1.6%) | 292 (3.3%) |
| $12,500 to $14,999 | 151 (1.5%) | 186 (2.1%) |
| $15,000 to $17,499 | 185 (1.9%) | 179 (2.1%) |
| $17,500 to $19,999 | 148 (1.5%) | 89 (1.0%) |
| $20,000 to $22,499 | 163 (1.7%) | 227 (2.6%) |
| $22,500 to $24,999 | 207 (2.1%) | 292 (3.3%) |
| $25,000 to $29,999 | 182 (1.9%) | 506 (5.8%) |
| $30,000 to $34,999 | 264 (2.7%) | 481 (5.5%) |
| $35,000 to $39,999 | 413 (4.2%) | 332 (3.8%) |
| $40,000 to $44,999 | 786 (8.0%) | 434 (5.0%) |
| $45,000 to $49,999 | 337 (3.4%) | 388 (4.4%) |
| $50,000 to $54,999 | 282 (2.9%) | 286 (3.3%) |
| $55,000 to $64,999 | 626 (6.4%) | 743 (8.5%) |
| $65,000 to $74,999 | 751 (7.7%) | 552 (6.3%) |
| $75,000 to $99,999 | 1,095 (11.2%) | 936 (10.7%) |
| $100,000+ | 3,284 (33.5%) | 1,570 (17.9%) |
| Total | 9,802 (100.0%) | 8,747 (100.0%) |
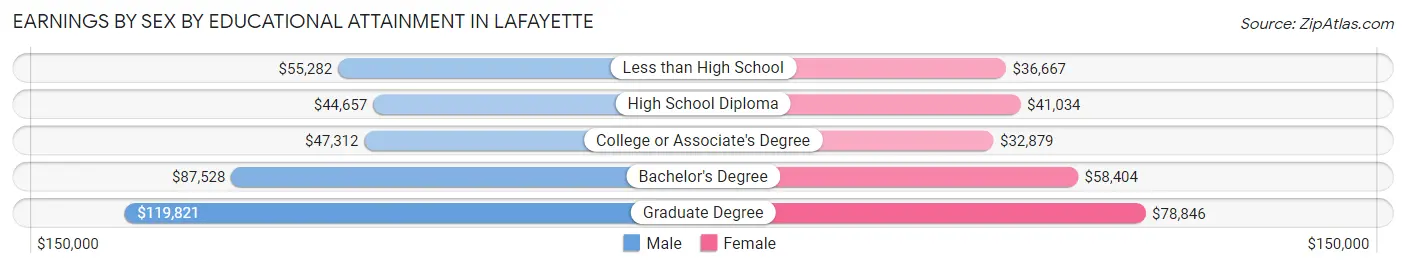
Earnings by Sex by Educational Attainment in Lafayette
Average earnings in Lafayette are $72,935 for men and $53,757 for women, a difference of 26.3%. Men with an educational attainment of graduate degree enjoy the highest average annual earnings of $119,821, while those with high school diploma education earn the least with $44,657. Women with an educational attainment of graduate degree earn the most with the average annual earnings of $78,846, while those with college or associate's degree education have the smallest earnings of $32,879.
| Educational Attainment | Male Income | Female Income |
| Less than High School | $55,282 | $36,667 |
| High School Diploma | $44,657 | $41,034 |
| College or Associate's Degree | $47,312 | $32,879 |
| Bachelor's Degree | $87,528 | $58,404 |
| Graduate Degree | $119,821 | $78,846 |
| Total | $72,935 | $53,757 |
Family Income in Lafayette
Family Income Brackets in Lafayette
According to the Lafayette family income data, there are 2,193 families falling into the $200,000+ income range, which is the most common income bracket and makes up 28.1% of all families. Conversely, the $10,000 to $14,999 income bracket is the least frequent group with only 31 families (0.4%) belonging to this category.
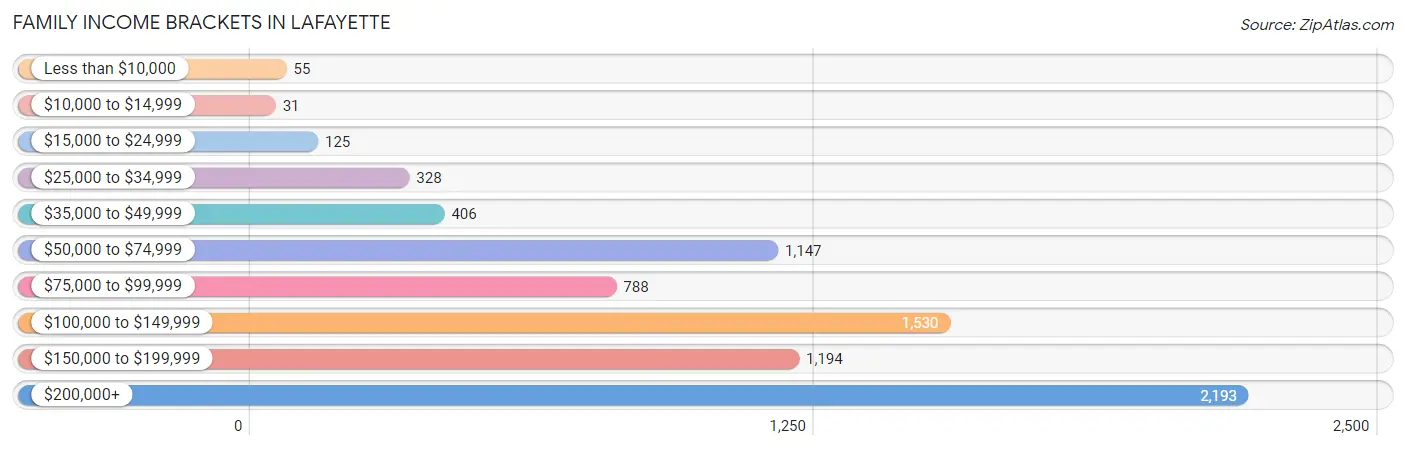
| Income Bracket | # Families | % Families |
| Less than $10,000 | 55 | 0.7% |
| $10,000 to $14,999 | 31 | 0.4% |
| $15,000 to $24,999 | 125 | 1.6% |
| $25,000 to $34,999 | 328 | 4.2% |
| $35,000 to $49,999 | 406 | 5.2% |
| $50,000 to $74,999 | 1,147 | 14.7% |
| $75,000 to $99,999 | 788 | 10.1% |
| $100,000 to $149,999 | 1,530 | 19.6% |
| $150,000 to $199,999 | 1,194 | 15.3% |
| $200,000+ | 2,193 | 28.1% |
Family Income by Famaliy Size in Lafayette
4-person families (1,568 | 20.1%) account for the highest median family income in Lafayette with $182,083 per family, while 2-person families (3,869 | 49.6%) have the highest median income of $57,888 per family member.
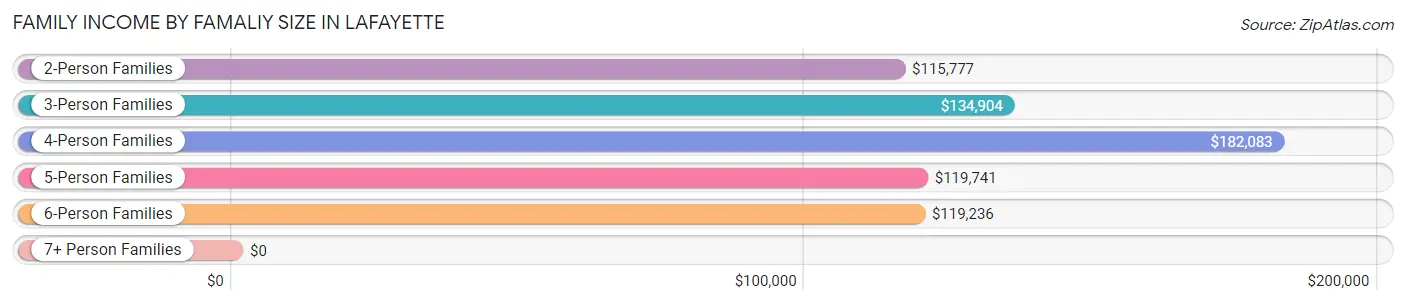
| Income Bracket | # Families | Median Income |
| 2-Person Families | 3,869 (49.6%) | $115,777 |
| 3-Person Families | 1,827 (23.4%) | $134,904 |
| 4-Person Families | 1,568 (20.1%) | $182,083 |
| 5-Person Families | 412 (5.3%) | $119,741 |
| 6-Person Families | 103 (1.3%) | $119,236 |
| 7+ Person Families | 26 (0.3%) | $0 |
| Total | 7,805 (100.0%) | $131,329 |
Family Income by Number of Earners in Lafayette
The median family income in Lafayette is $131,329, with families comprising 2 earners (3,993) having the highest median family income of $172,930, while families with 1 earner (2,599) have the lowest median family income of $85,054, accounting for 51.2% and 33.3% of families, respectively.
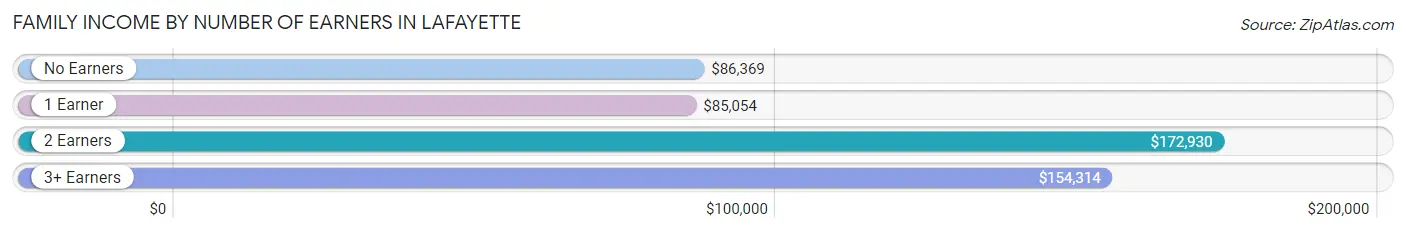
| Number of Earners | # Families | Median Income |
| No Earners | 609 (7.8%) | $86,369 |
| 1 Earner | 2,599 (33.3%) | $85,054 |
| 2 Earners | 3,993 (51.2%) | $172,930 |
| 3+ Earners | 604 (7.7%) | $154,314 |
| Total | 7,805 (100.0%) | $131,329 |
Household Income in Lafayette
Household Income Brackets in Lafayette
With 2,656 households falling in the category, the $200,000+ income range is the most frequent in Lafayette, accounting for 20.9% of all households. In contrast, only 165 households (1.3%) fall into the $10,000 to $14,999 income bracket, making it the least populous group.
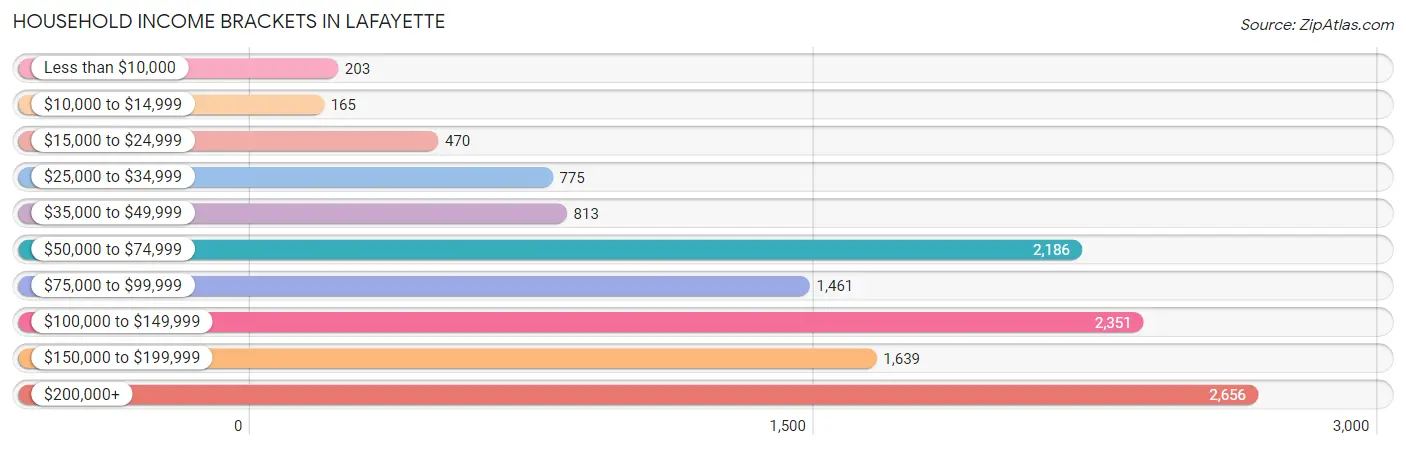
| Income Bracket | # Households | % Households |
| Less than $10,000 | 203 | 1.6% |
| $10,000 to $14,999 | 165 | 1.3% |
| $15,000 to $24,999 | 470 | 3.7% |
| $25,000 to $34,999 | 775 | 6.1% |
| $35,000 to $49,999 | 813 | 6.4% |
| $50,000 to $74,999 | 2,186 | 17.2% |
| $75,000 to $99,999 | 1,461 | 11.5% |
| $100,000 to $149,999 | 2,351 | 18.5% |
| $150,000 to $199,999 | 1,639 | 12.9% |
| $200,000+ | 2,656 | 20.9% |
Household Income by Householder Age in Lafayette
The median household income in Lafayette is $105,819, with the highest median household income of $125,061 found in the 45 to 64 years age bracket for the primary householder. A total of 4,850 households (38.2%) fall into this category. Meanwhile, the 15 to 24 years age bracket for the primary householder has the lowest median household income of $68,409, with 342 households (2.7%) in this group.
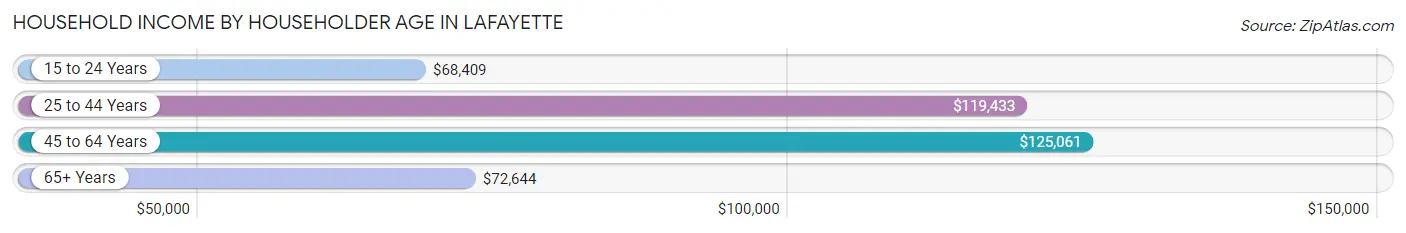
| Income Bracket | # Households | Median Income |
| 15 to 24 Years | 342 (2.7%) | $68,409 |
| 25 to 44 Years | 4,346 (34.2%) | $119,433 |
| 45 to 64 Years | 4,850 (38.2%) | $125,061 |
| 65+ Years | 3,169 (24.9%) | $72,644 |
| Total | 12,707 (100.0%) | $105,819 |
Poverty in Lafayette
Income Below Poverty by Sex and Age in Lafayette
With 6.0% poverty level for males and 5.0% for females among the residents of Lafayette, 15 year old males and 25 to 34 year old females are the most vulnerable to poverty, with 58 males (22.7%) and 211 females (10.5%) in their respective age groups living below the poverty level.
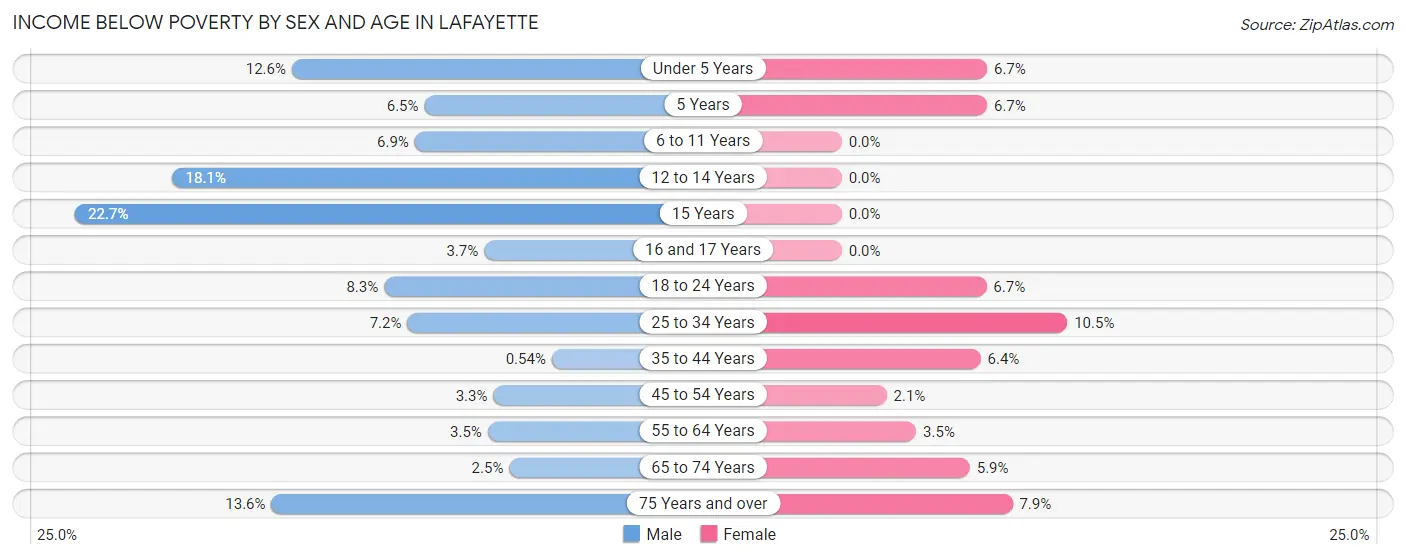
| Age Bracket | Male | Female |
| Under 5 Years | 125 (12.6%) | 45 (6.7%) |
| 5 Years | 8 (6.5%) | 12 (6.7%) |
| 6 to 11 Years | 70 (6.9%) | 0 (0.0%) |
| 12 to 14 Years | 128 (18.1%) | 0 (0.0%) |
| 15 Years | 58 (22.7%) | 0 (0.0%) |
| 16 and 17 Years | 11 (3.7%) | 0 (0.0%) |
| 18 to 24 Years | 77 (8.3%) | 81 (6.7%) |
| 25 to 34 Years | 168 (7.2%) | 211 (10.5%) |
| 35 to 44 Years | 13 (0.5%) | 138 (6.4%) |
| 45 to 54 Years | 65 (3.3%) | 48 (2.1%) |
| 55 to 64 Years | 65 (3.5%) | 63 (3.5%) |
| 65 to 74 Years | 36 (2.5%) | 92 (5.9%) |
| 75 Years and over | 74 (13.6%) | 67 (7.9%) |
| Total | 898 (6.0%) | 757 (5.0%) |
Income Above Poverty by Sex and Age in Lafayette
According to the poverty statistics in Lafayette, males aged 35 to 44 years and females aged 6 to 11 years are the age groups that are most secure financially, with 99.5% of males and 100.0% of females in these age groups living above the poverty line.

| Age Bracket | Male | Female |
| Under 5 Years | 867 (87.4%) | 623 (93.3%) |
| 5 Years | 116 (93.5%) | 166 (93.3%) |
| 6 to 11 Years | 945 (93.1%) | 1,381 (100.0%) |
| 12 to 14 Years | 578 (81.9%) | 757 (100.0%) |
| 15 Years | 198 (77.3%) | 275 (100.0%) |
| 16 and 17 Years | 288 (96.3%) | 144 (100.0%) |
| 18 to 24 Years | 848 (91.7%) | 1,127 (93.3%) |
| 25 to 34 Years | 2,151 (92.8%) | 1,807 (89.5%) |
| 35 to 44 Years | 2,409 (99.5%) | 2,006 (93.6%) |
| 45 to 54 Years | 1,938 (96.8%) | 2,257 (97.9%) |
| 55 to 64 Years | 1,788 (96.5%) | 1,763 (96.6%) |
| 65 to 74 Years | 1,401 (97.5%) | 1,457 (94.1%) |
| 75 Years and over | 472 (86.5%) | 779 (92.1%) |
| Total | 13,999 (94.0%) | 14,542 (95.1%) |
Income Below Poverty Among Married-Couple Families in Lafayette
The poverty statistics for married-couple families in Lafayette show that 1.0% or 60 of the total 5,913 families live below the poverty line. Families with 3 or 4 children have the highest poverty rate of 2.6%, comprising of 8 families. On the other hand, families with 5 or more children have the lowest poverty rate of 0.0%, which includes 0 families.
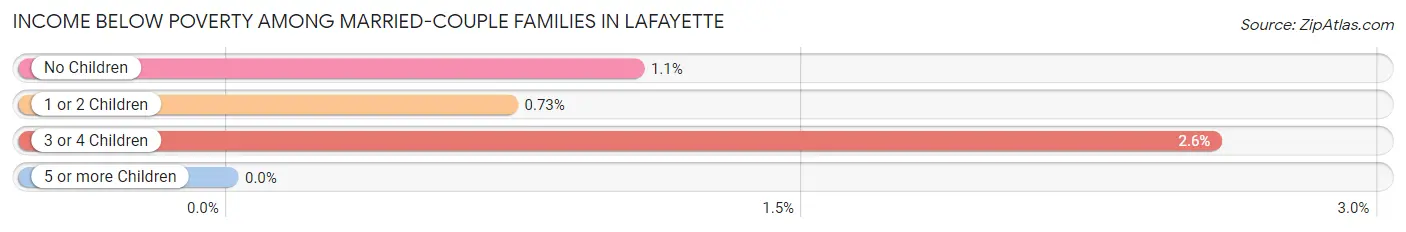
| Children | Above Poverty | Below Poverty |
| No Children | 3,369 (98.9%) | 36 (1.1%) |
| 1 or 2 Children | 2,170 (99.3%) | 16 (0.7%) |
| 3 or 4 Children | 303 (97.4%) | 8 (2.6%) |
| 5 or more Children | 11 (100.0%) | 0 (0.0%) |
| Total | 5,853 (99.0%) | 60 (1.0%) |
Income Below Poverty Among Single-Parent Households in Lafayette
According to the poverty data in Lafayette, 2.7% or 23 single-father households and 12.7% or 133 single-mother households are living below the poverty line. Among single-father households, those with 1 or 2 children have the highest poverty rate, with 23 households (6.3%) experiencing poverty. Likewise, among single-mother households, those with 3 or 4 children have the highest poverty rate, with 39 households (39.0%) falling below the poverty line.
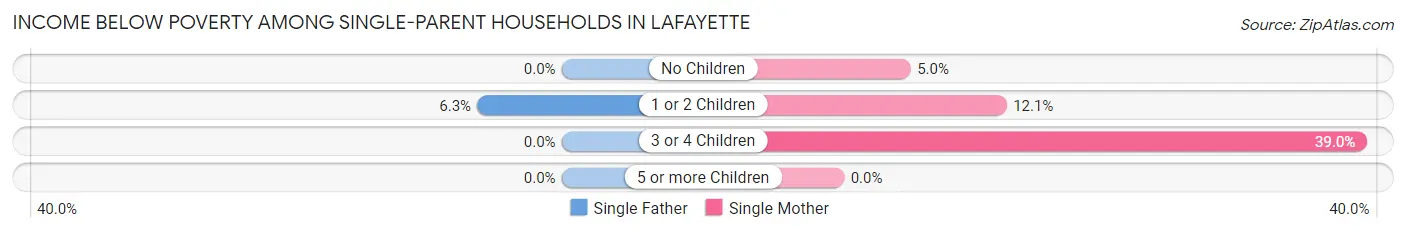
| Children | Single Father | Single Mother |
| No Children | 0 (0.0%) | 13 (5.0%) |
| 1 or 2 Children | 23 (6.3%) | 81 (12.1%) |
| 3 or 4 Children | 0 (0.0%) | 39 (39.0%) |
| 5 or more Children | 0 (0.0%) | 0 (0.0%) |
| Total | 23 (2.7%) | 133 (12.7%) |
Income Below Poverty Among Married-Couple vs Single-Parent Households in Lafayette
The poverty data for Lafayette shows that 60 of the married-couple family households (1.0%) and 156 of the single-parent households (8.3%) are living below the poverty level. Within the married-couple family households, those with 3 or 4 children have the highest poverty rate, with 8 households (2.6%) falling below the poverty line. Among the single-parent households, those with 3 or 4 children have the highest poverty rate, with 39 household (13.5%) living below poverty.
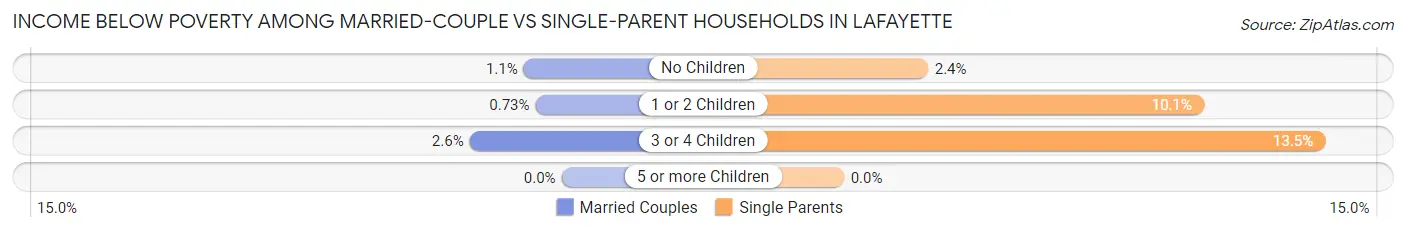
| Children | Married-Couple Families | Single-Parent Households |
| No Children | 36 (1.1%) | 13 (2.4%) |
| 1 or 2 Children | 16 (0.7%) | 104 (10.1%) |
| 3 or 4 Children | 8 (2.6%) | 39 (13.5%) |
| 5 or more Children | 0 (0.0%) | 0 (0.0%) |
| Total | 60 (1.0%) | 156 (8.3%) |
Race in Lafayette
The most populous races in Lafayette are White / Caucasian (24,585 | 81.1%), Hispanic or Latino (5,067 | 16.7%), and Two or more Races (3,169 | 10.5%).
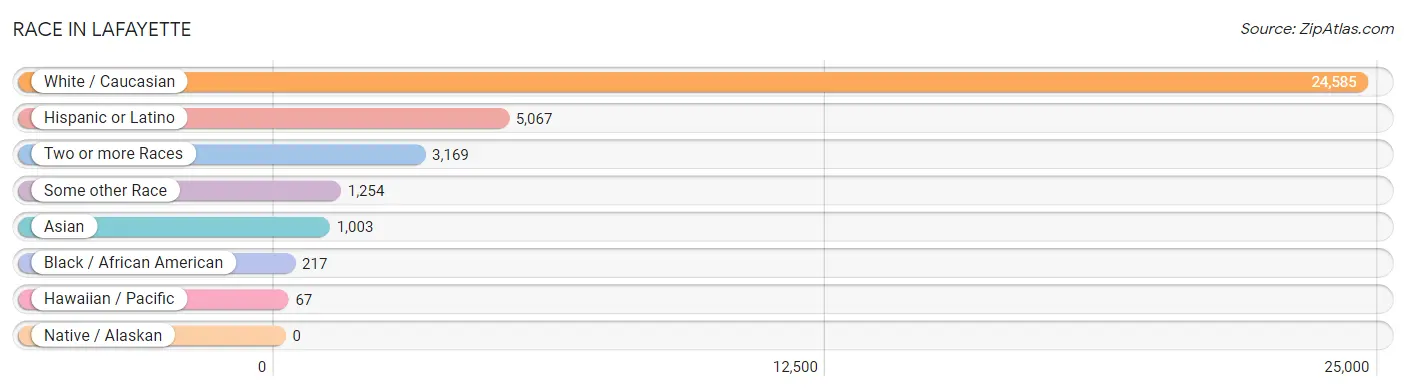
| Race | # Population | % Population |
| Asian | 1,003 | 3.3% |
| Black / African American | 217 | 0.7% |
| Hawaiian / Pacific | 67 | 0.2% |
| Hispanic or Latino | 5,067 | 16.7% |
| Native / Alaskan | 0 | 0.0% |
| White / Caucasian | 24,585 | 81.1% |
| Two or more Races | 3,169 | 10.5% |
| Some other Race | 1,254 | 4.1% |
| Total | 30,295 | 100.0% |
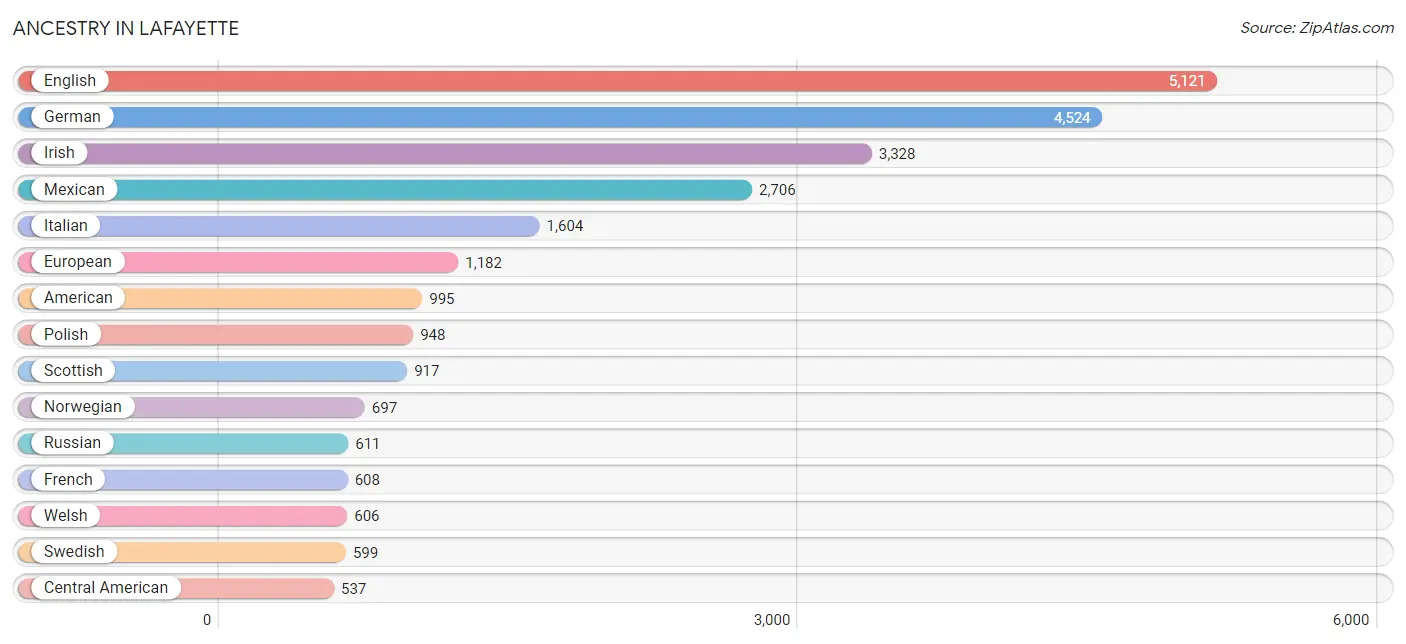
Ancestry in Lafayette
The most populous ancestries reported in Lafayette are English (5,121 | 16.9%), German (4,524 | 14.9%), Irish (3,328 | 11.0%), Mexican (2,706 | 8.9%), and Italian (1,604 | 5.3%), together accounting for 57.0% of all Lafayette residents.
| Ancestry | # Population | % Population |
| African | 9 | 0.0% |
| Albanian | 52 | 0.2% |
| American | 995 | 3.3% |
| Apache | 6 | 0.0% |
| Arab | 97 | 0.3% |
| Argentinean | 51 | 0.2% |
| Armenian | 196 | 0.6% |
| Australian | 72 | 0.2% |
| Austrian | 60 | 0.2% |
| Belgian | 26 | 0.1% |
| Bermudan | 11 | 0.0% |
| Bhutanese | 195 | 0.6% |
| British | 283 | 0.9% |
| Bulgarian | 17 | 0.1% |
| Burmese | 501 | 1.7% |
| Cajun | 12 | 0.0% |
| Canadian | 96 | 0.3% |
| Celtic | 23 | 0.1% |
| Central American | 537 | 1.8% |
| Cherokee | 219 | 0.7% |
| Cheyenne | 3 | 0.0% |
| Chilean | 58 | 0.2% |
| Choctaw | 12 | 0.0% |
| Colombian | 164 | 0.5% |
| Costa Rican | 32 | 0.1% |
| Croatian | 18 | 0.1% |
| Cuban | 98 | 0.3% |
| Czech | 180 | 0.6% |
| Czechoslovakian | 128 | 0.4% |
| Danish | 355 | 1.2% |
| Dominican | 42 | 0.1% |
| Dutch | 391 | 1.3% |
| Eastern European | 146 | 0.5% |
| Ecuadorian | 11 | 0.0% |
| English | 5,121 | 16.9% |
| Ethiopian | 29 | 0.1% |
| European | 1,182 | 3.9% |
| Filipino | 6 | 0.0% |
| Finnish | 154 | 0.5% |
| French | 608 | 2.0% |
| French Canadian | 125 | 0.4% |
| German | 4,524 | 14.9% |
| Greek | 55 | 0.2% |
| Guamanian / Chamorro | 9 | 0.0% |
| Honduran | 205 | 0.7% |
| Hungarian | 155 | 0.5% |
| Icelander | 21 | 0.1% |
| Indian (Asian) | 318 | 1.1% |
| Iranian | 32 | 0.1% |
| Irish | 3,328 | 11.0% |
| Israeli | 40 | 0.1% |
| Italian | 1,604 | 5.3% |
| Jamaican | 10 | 0.0% |
| Japanese | 81 | 0.3% |
| Korean | 334 | 1.1% |
| Lebanese | 83 | 0.3% |
| Lithuanian | 95 | 0.3% |
| Luxembourger | 16 | 0.1% |
| Maltese | 8 | 0.0% |
| Mexican | 2,706 | 8.9% |
| Mexican American Indian | 11 | 0.0% |
| Native Hawaiian | 88 | 0.3% |
| Northern European | 162 | 0.5% |
| Norwegian | 697 | 2.3% |
| Peruvian | 157 | 0.5% |
| Polish | 948 | 3.1% |
| Portuguese | 179 | 0.6% |
| Puerto Rican | 411 | 1.4% |
| Romanian | 54 | 0.2% |
| Russian | 611 | 2.0% |
| Salvadoran | 300 | 1.0% |
| Samoan | 39 | 0.1% |
| Scandinavian | 185 | 0.6% |
| Scotch-Irish | 463 | 1.5% |
| Scottish | 917 | 3.0% |
| Serbian | 18 | 0.1% |
| Slavic | 19 | 0.1% |
| Slovak | 18 | 0.1% |
| Slovene | 81 | 0.3% |
| South American | 505 | 1.7% |
| South American Indian | 10 | 0.0% |
| Spaniard | 131 | 0.4% |
| Spanish | 370 | 1.2% |
| Sri Lankan | 123 | 0.4% |
| Subsaharan African | 38 | 0.1% |
| Swedish | 599 | 2.0% |
| Swiss | 175 | 0.6% |
| Thai | 322 | 1.1% |
| Trinidadian and Tobagonian | 20 | 0.1% |
| Turkish | 24 | 0.1% |
| Ukrainian | 93 | 0.3% |
| Venezuelan | 64 | 0.2% |
| Welsh | 606 | 2.0% | View All 93 Rows |
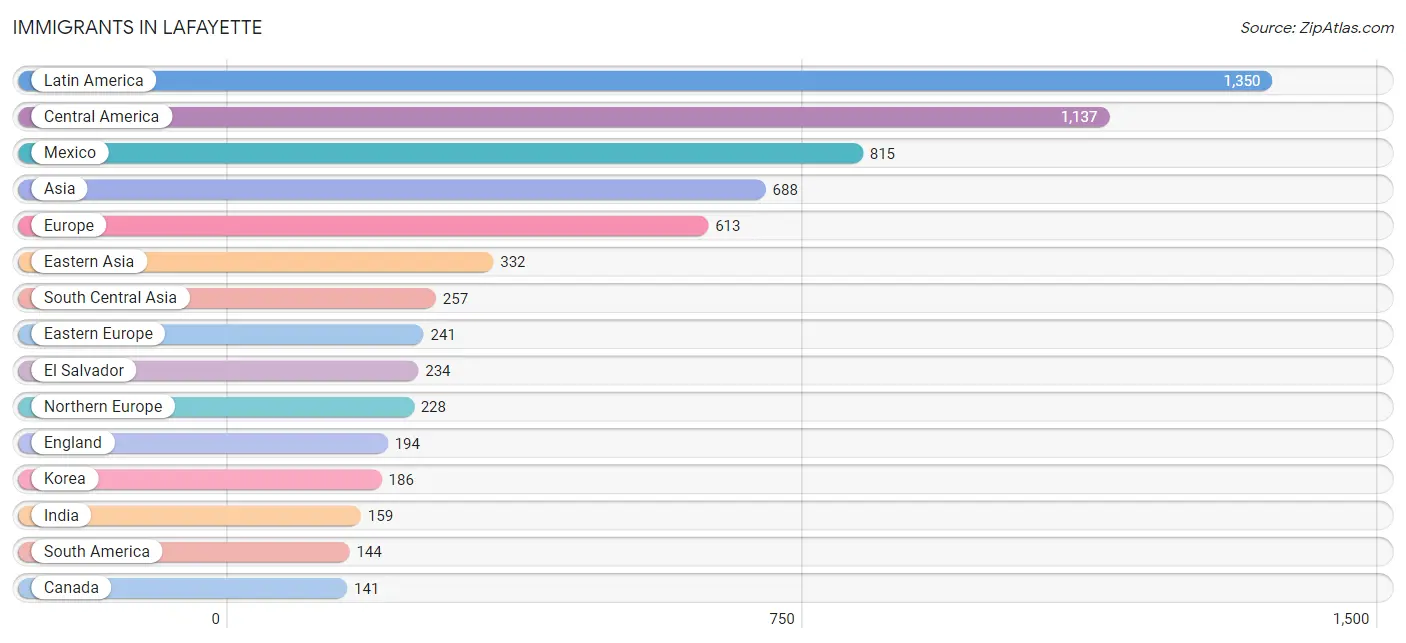
Immigrants in Lafayette
The most numerous immigrant groups reported in Lafayette came from Latin America (1,350 | 4.5%), Central America (1,137 | 3.7%), Mexico (815 | 2.7%), Asia (688 | 2.3%), and Europe (613 | 2.0%), together accounting for 15.2% of all Lafayette residents.
| Immigration Origin | # Population | % Population |
| Africa | 43 | 0.1% |
| Argentina | 18 | 0.1% |
| Asia | 688 | 2.3% |
| Australia | 28 | 0.1% |
| Belgium | 19 | 0.1% |
| Cambodia | 50 | 0.2% |
| Canada | 141 | 0.5% |
| Caribbean | 69 | 0.2% |
| Central America | 1,137 | 3.7% |
| Chile | 28 | 0.1% |
| China | 124 | 0.4% |
| Colombia | 61 | 0.2% |
| Croatia | 18 | 0.1% |
| Cuba | 21 | 0.1% |
| Dominica | 6 | 0.0% |
| Dominican Republic | 42 | 0.1% |
| Eastern Africa | 43 | 0.1% |
| Eastern Asia | 332 | 1.1% |
| Eastern Europe | 241 | 0.8% |
| El Salvador | 234 | 0.8% |
| England | 194 | 0.6% |
| Ethiopia | 29 | 0.1% |
| Europe | 613 | 2.0% |
| France | 47 | 0.2% |
| Germany | 42 | 0.1% |
| Honduras | 88 | 0.3% |
| India | 159 | 0.5% |
| Israel | 15 | 0.1% |
| Japan | 22 | 0.1% |
| Kenya | 14 | 0.1% |
| Korea | 186 | 0.6% |
| Latin America | 1,350 | 4.5% |
| Lebanon | 8 | 0.0% |
| Mexico | 815 | 2.7% |
| Nepal | 98 | 0.3% |
| Northern Europe | 228 | 0.7% |
| Oceania | 28 | 0.1% |
| Peru | 6 | 0.0% |
| Philippines | 5 | 0.0% |
| Poland | 11 | 0.0% |
| Romania | 7 | 0.0% |
| Russia | 119 | 0.4% |
| South America | 144 | 0.5% |
| South Central Asia | 257 | 0.9% |
| South Eastern Asia | 76 | 0.3% |
| Southern Europe | 36 | 0.1% |
| Spain | 36 | 0.1% |
| Taiwan | 19 | 0.1% |
| Uruguay | 29 | 0.1% |
| Venezuela | 2 | 0.0% |
| Vietnam | 21 | 0.1% |
| Western Asia | 23 | 0.1% |
| Western Europe | 108 | 0.4% | View All 53 Rows |
Sex and Age in Lafayette
Sex and Age in Lafayette
The most populous age groups in Lafayette are 35 to 39 Years (1,409 | 9.4%) for men and 10 to 14 Years (1,348 | 8.8%) for women.
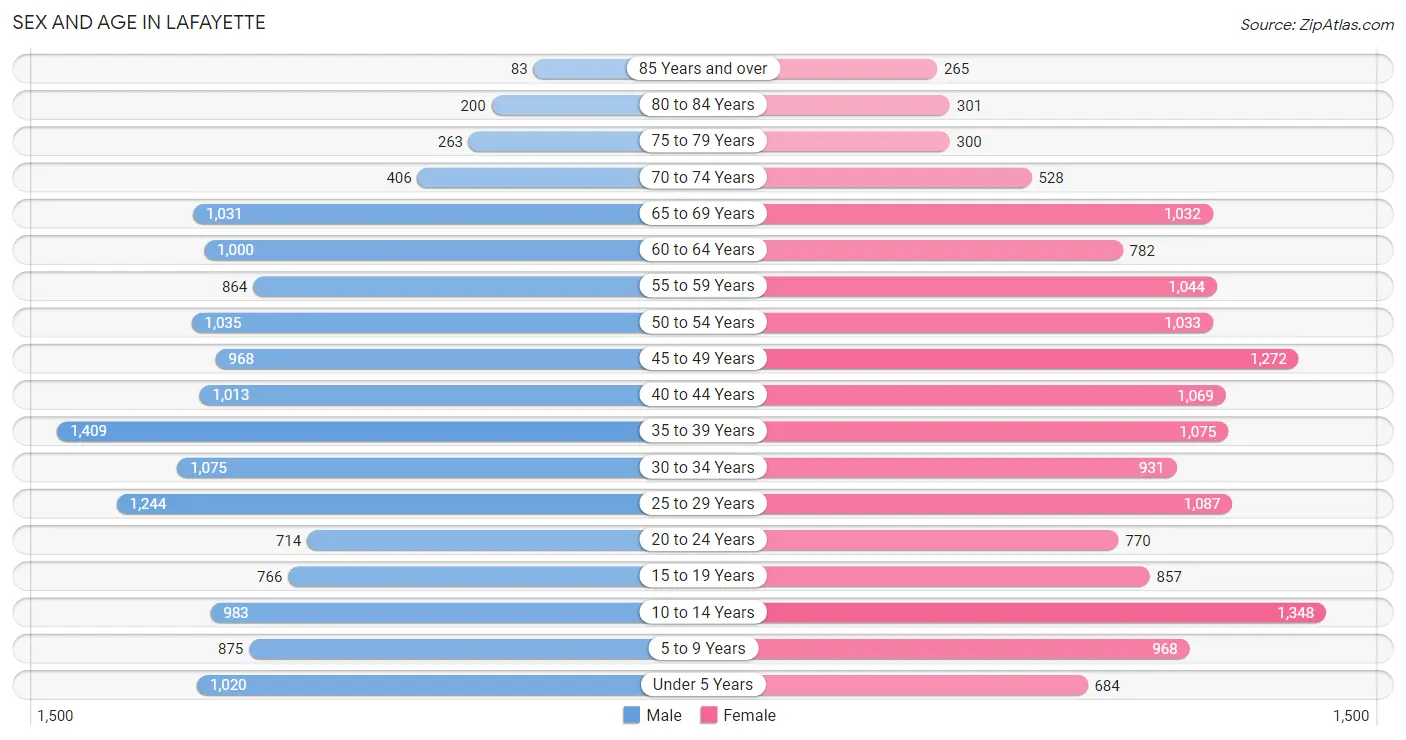
| Age Bracket | Male | Female |
| Under 5 Years | 1,020 (6.8%) | 684 (4.5%) |
| 5 to 9 Years | 875 (5.9%) | 968 (6.3%) |
| 10 to 14 Years | 983 (6.6%) | 1,348 (8.8%) |
| 15 to 19 Years | 766 (5.1%) | 857 (5.6%) |
| 20 to 24 Years | 714 (4.8%) | 770 (5.0%) |
| 25 to 29 Years | 1,244 (8.3%) | 1,087 (7.1%) |
| 30 to 34 Years | 1,075 (7.2%) | 931 (6.1%) |
| 35 to 39 Years | 1,409 (9.4%) | 1,075 (7.0%) |
| 40 to 44 Years | 1,013 (6.8%) | 1,069 (7.0%) |
| 45 to 49 Years | 968 (6.5%) | 1,272 (8.3%) |
| 50 to 54 Years | 1,035 (6.9%) | 1,033 (6.7%) |
| 55 to 59 Years | 864 (5.8%) | 1,044 (6.8%) |
| 60 to 64 Years | 1,000 (6.7%) | 782 (5.1%) |
| 65 to 69 Years | 1,031 (6.9%) | 1,032 (6.7%) |
| 70 to 74 Years | 406 (2.7%) | 528 (3.4%) |
| 75 to 79 Years | 263 (1.8%) | 300 (1.9%) |
| 80 to 84 Years | 200 (1.3%) | 301 (2.0%) |
| 85 Years and over | 83 (0.6%) | 265 (1.7%) |
| Total | 14,949 (100.0%) | 15,346 (100.0%) |
Families and Households in Lafayette
Median Family Size in Lafayette
The median family size in Lafayette is 2.90 persons per family, with single female/mother families (1,046 | 13.4%) accounting for the largest median family size of 3.26 persons per family. On the other hand, single male/father families (846 | 10.8%) represent the smallest median family size with 2.37 persons per family.
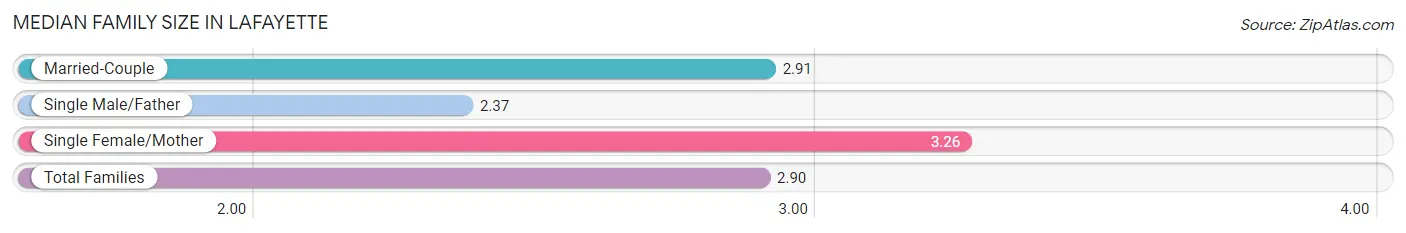
| Family Type | # Families | Family Size |
| Married-Couple | 5,913 (75.8%) | 2.91 |
| Single Male/Father | 846 (10.8%) | 2.37 |
| Single Female/Mother | 1,046 (13.4%) | 3.26 |
| Total Families | 7,805 (100.0%) | 2.90 |
Median Household Size in Lafayette
The median household size in Lafayette is 2.38 persons per household, with single female/mother households (1,046 | 8.2%) accounting for the largest median household size of 3.6 persons per household. non-family households (4,902 | 38.6%) represent the smallest median household size with 1.36 persons per household.
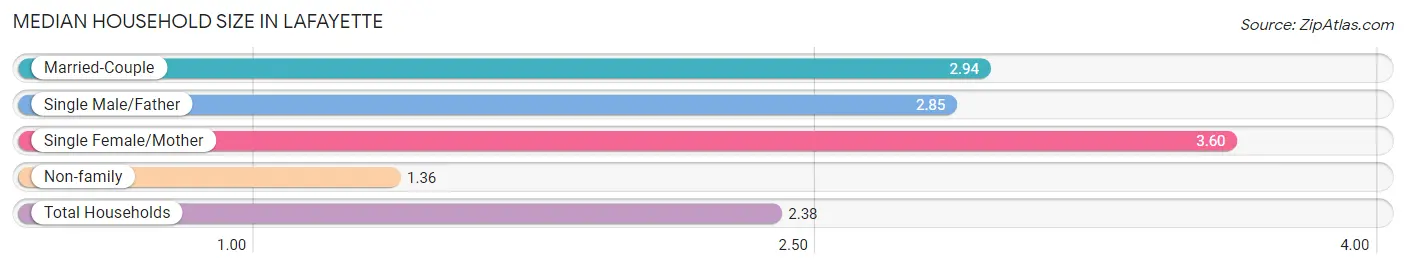
| Household Type | # Households | Household Size |
| Married-Couple | 5,913 (46.5%) | 2.94 |
| Single Male/Father | 846 (6.7%) | 2.85 |
| Single Female/Mother | 1,046 (8.2%) | 3.60 |
| Non-family | 4,902 (38.6%) | 1.36 |
| Total Households | 12,707 (100.0%) | 2.38 |
Household Size by Marriage Status in Lafayette
Out of a total of 12,707 households in Lafayette, 7,805 (61.4%) are family households, while 4,902 (38.6%) are nonfamily households. The most numerous type of family households are 2-person households, comprising 3,571, and the most common type of nonfamily households are 1-person households, comprising 3,553.
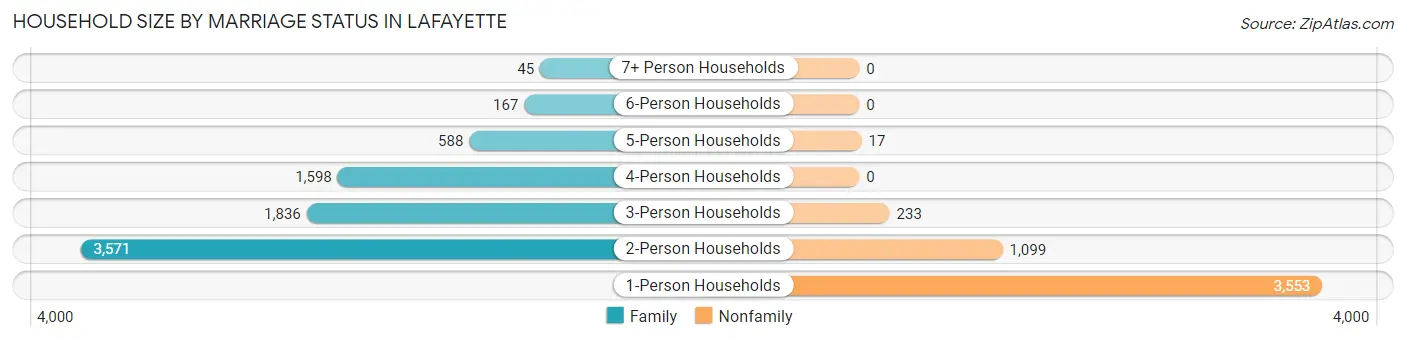
| Household Size | Family Households | Nonfamily Households |
| 1-Person Households | - | 3,553 (28.0%) |
| 2-Person Households | 3,571 (28.1%) | 1,099 (8.6%) |
| 3-Person Households | 1,836 (14.4%) | 233 (1.8%) |
| 4-Person Households | 1,598 (12.6%) | 0 (0.0%) |
| 5-Person Households | 588 (4.6%) | 17 (0.1%) |
| 6-Person Households | 167 (1.3%) | 0 (0.0%) |
| 7+ Person Households | 45 (0.4%) | 0 (0.0%) |
| Total | 7,805 (61.4%) | 4,902 (38.6%) |
Female Fertility in Lafayette
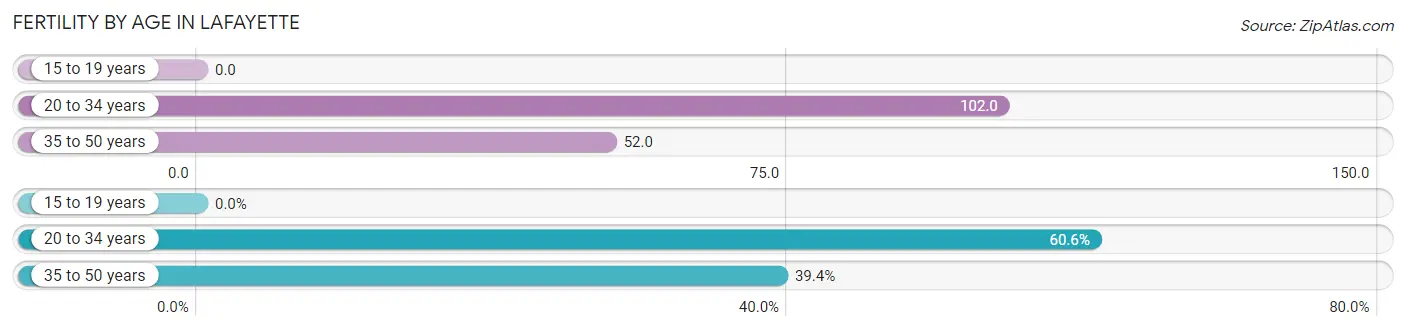
Fertility by Age in Lafayette
Average fertility rate in Lafayette is 65.0 births per 1,000 women. Women in the age bracket of 20 to 34 years have the highest fertility rate with 102.0 births per 1,000 women. Women in the age bracket of 20 to 34 years acount for 60.6% of all women with births.
| Age Bracket | Women with Births | Births / 1,000 Women |
| 15 to 19 years | 0 (0.0%) | 0.0 |
| 20 to 34 years | 285 (60.6%) | 102.0 |
| 35 to 50 years | 185 (39.4%) | 52.0 |
| Total | 470 (100.0%) | 65.0 |
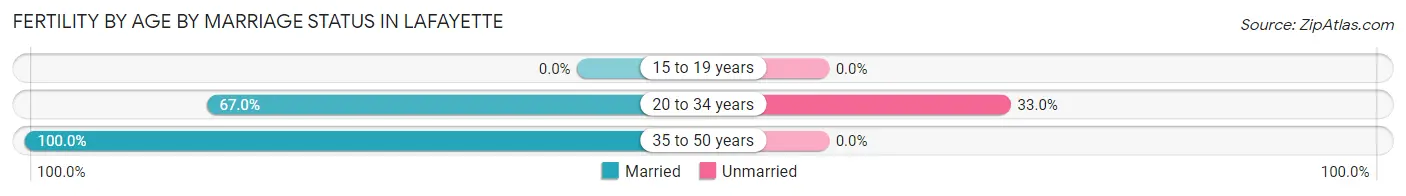
Fertility by Age by Marriage Status in Lafayette
80.0% of women with births (470) in Lafayette are married. The highest percentage of unmarried women with births falls into 20 to 34 years age bracket with 33.0% of them unmarried at the time of birth, while the lowest percentage of unmarried women with births belong to 35 to 50 years age bracket with 0.0% of them unmarried.
| Age Bracket | Married | Unmarried |
| 15 to 19 years | 0 (0.0%) | 0 (0.0%) |
| 20 to 34 years | 191 (67.0%) | 94 (33.0%) |
| 35 to 50 years | 185 (100.0%) | 0 (0.0%) |
| Total | 376 (80.0%) | 94 (20.0%) |
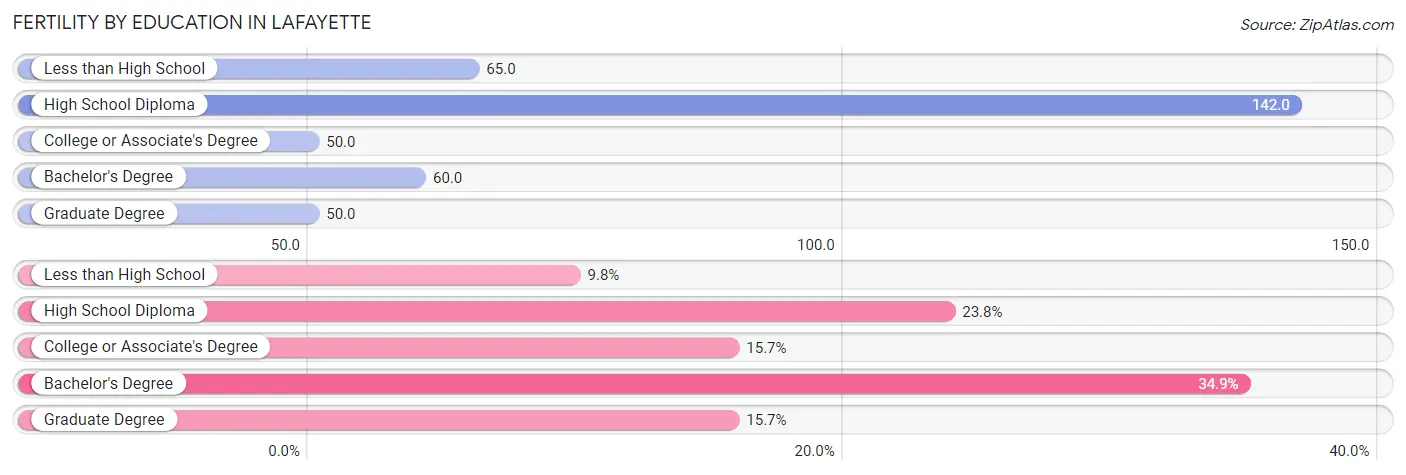
Fertility by Education in Lafayette
Average fertility rate in Lafayette is 65.0 births per 1,000 women. Women with the education attainment of high school diploma have the highest fertility rate of 142.0 births per 1,000 women, while women with the education attainment of college or associate's degree have the lowest fertility at 50.0 births per 1,000 women. Women with the education attainment of bachelor's degree represent 34.9% of all women with births.
| Educational Attainment | Women with Births | Births / 1,000 Women |
| Less than High School | 46 (9.8%) | 65.0 |
| High School Diploma | 112 (23.8%) | 142.0 |
| College or Associate's Degree | 74 (15.7%) | 50.0 |
| Bachelor's Degree | 164 (34.9%) | 60.0 |
| Graduate Degree | 74 (15.7%) | 50.0 |
| Total | 470 (100.0%) | 65.0 |
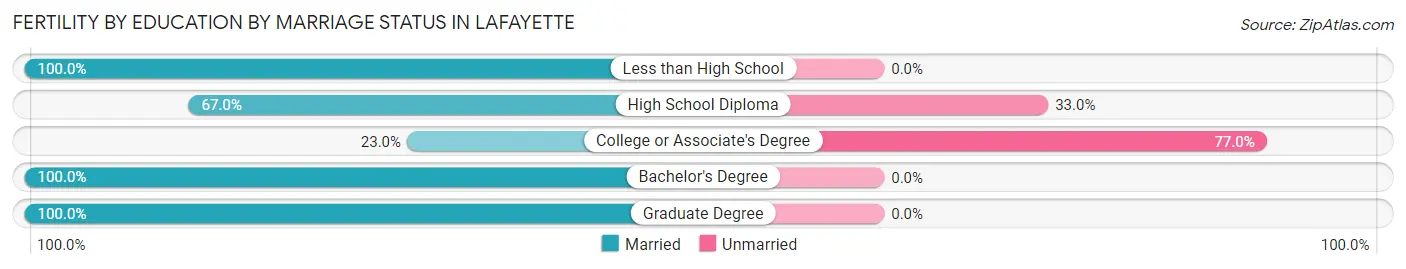
Fertility by Education by Marriage Status in Lafayette
20.0% of women with births in Lafayette are unmarried. Women with the educational attainment of less than high school are most likely to be married with 100.0% of them married at childbirth, while women with the educational attainment of college or associate's degree are least likely to be married with 77.0% of them unmarried at childbirth.
| Educational Attainment | Married | Unmarried |
| Less than High School | 46 (100.0%) | 0 (0.0%) |
| High School Diploma | 75 (67.0%) | 37 (33.0%) |
| College or Associate's Degree | 17 (23.0%) | 57 (77.0%) |
| Bachelor's Degree | 164 (100.0%) | 0 (0.0%) |
| Graduate Degree | 74 (100.0%) | 0 (0.0%) |
| Total | 376 (80.0%) | 94 (20.0%) |
Employment Characteristics in Lafayette
Employment by Class of Employer in Lafayette
Among the 17,123 employed individuals in Lafayette, private company employees (11,674 | 68.2%), not-for-profit organizations (1,441 | 8.4%), and local government employees (1,174 | 6.9%) make up the most common classes of employment.
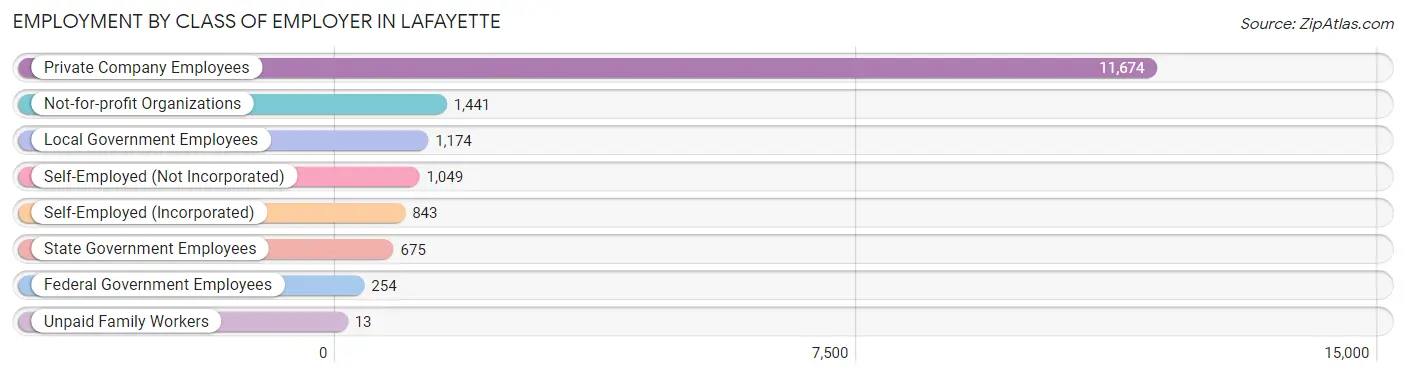
| Employer Class | # Employees | % Employees |
| Private Company Employees | 11,674 | 68.2% |
| Self-Employed (Incorporated) | 843 | 4.9% |
| Self-Employed (Not Incorporated) | 1,049 | 6.1% |
| Not-for-profit Organizations | 1,441 | 8.4% |
| Local Government Employees | 1,174 | 6.9% |
| State Government Employees | 675 | 3.9% |
| Federal Government Employees | 254 | 1.5% |
| Unpaid Family Workers | 13 | 0.1% |
| Total | 17,123 | 100.0% |
Employment Status by Age in Lafayette
According to the labor force statistics for Lafayette, out of the total population over 16 years of age (23,886), 75.6% or 18,058 individuals are in the labor force, with 3.7% or 668 of them unemployed. The age group with the highest labor force participation rate is 35 to 44 years, with 92.0% or 4,201 individuals in the labor force. Within the labor force, the 75 years and over age range has the highest percentage of unemployed individuals, with 10.5% or 15 of them being unemployed.
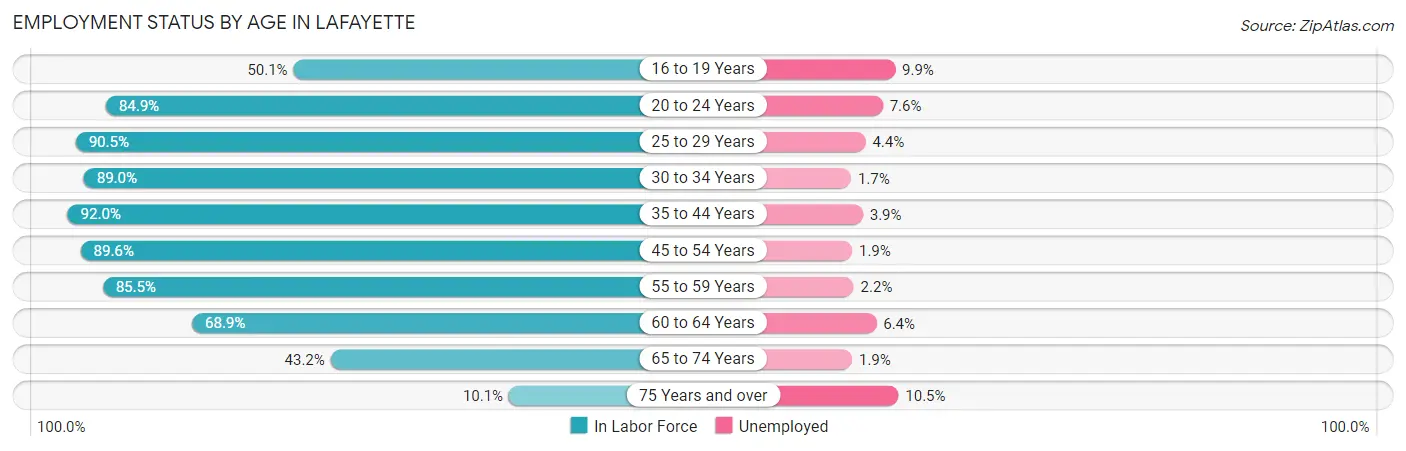
| Age Bracket | In Labor Force | Unemployed |
| 16 to 19 Years | 547 (50.1%) | 54 (9.9%) |
| 20 to 24 Years | 1,260 (84.9%) | 96 (7.6%) |
| 25 to 29 Years | 2,110 (90.5%) | 93 (4.4%) |
| 30 to 34 Years | 1,785 (89.0%) | 30 (1.7%) |
| 35 to 44 Years | 4,201 (92.0%) | 164 (3.9%) |
| 45 to 54 Years | 3,860 (89.6%) | 73 (1.9%) |
| 55 to 59 Years | 1,631 (85.5%) | 36 (2.2%) |
| 60 to 64 Years | 1,228 (68.9%) | 79 (6.4%) |
| 65 to 74 Years | 1,295 (43.2%) | 25 (1.9%) |
| 75 Years and over | 143 (10.1%) | 15 (10.5%) |
| Total | 18,058 (75.6%) | 668 (3.7%) |
Employment Status by Educational Attainment in Lafayette
According to labor force statistics for Lafayette, 87.7% of individuals (14,822) out of the total population between 25 and 64 years of age (16,901) are in the labor force, with 3.2% or 474 of them being unemployed. The group with the highest labor force participation rate are those with the educational attainment of bachelor's degree or higher, with 89.2% or 9,745 individuals in the labor force. Within the labor force, individuals with college / associate degree education have the highest percentage of unemployment, with 5.1% or 159 of them being unemployed.
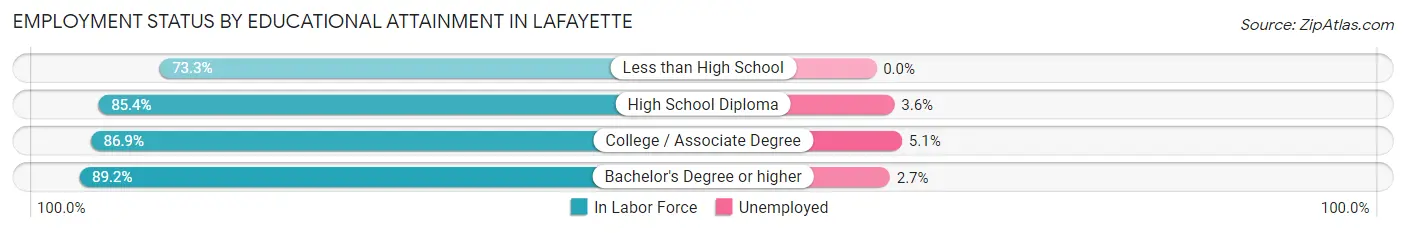
| Educational Attainment | In Labor Force | Unemployed |
| Less than High School | 530 (73.3%) | 0 (0.0%) |
| High School Diploma | 1,431 (85.4%) | 60 (3.6%) |
| College / Associate Degree | 3,108 (86.9%) | 182 (5.1%) |
| Bachelor's Degree or higher | 9,745 (89.2%) | 295 (2.7%) |
| Total | 14,822 (87.7%) | 541 (3.2%) |
Employment Occupations by Sex in Lafayette
Management, Business, Science and Arts Occupations
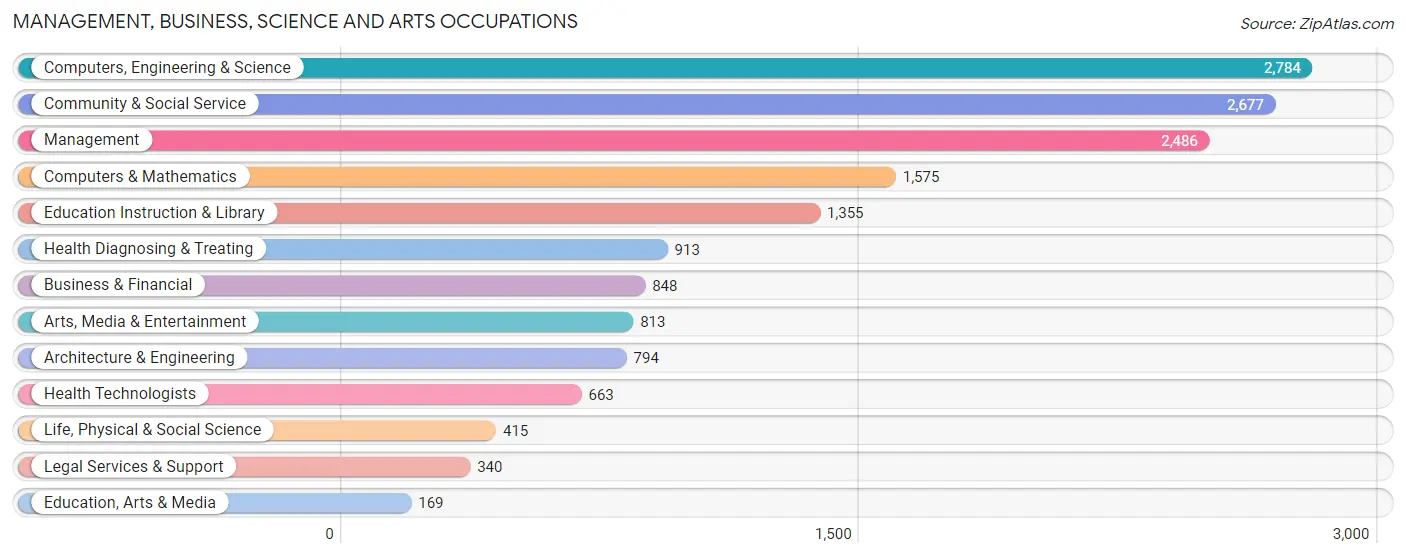
The most common Management, Business, Science and Arts occupations in Lafayette are Computers, Engineering & Science (2,784 | 16.0%), Community & Social Service (2,677 | 15.4%), Management (2,486 | 14.3%), Computers & Mathematics (1,575 | 9.1%), and Education Instruction & Library (1,355 | 7.8%).
Management, Business, Science and Arts Occupations by Sex
Within the Management, Business, Science and Arts occupations in Lafayette, the most male-oriented occupations are Architecture & Engineering (88.4%), Computers & Mathematics (78.5%), and Computers, Engineering & Science (76.5%), while the most female-oriented occupations are Education, Arts & Media (88.2%), Health Technologists (82.4%), and Health Diagnosing & Treating (68.3%).
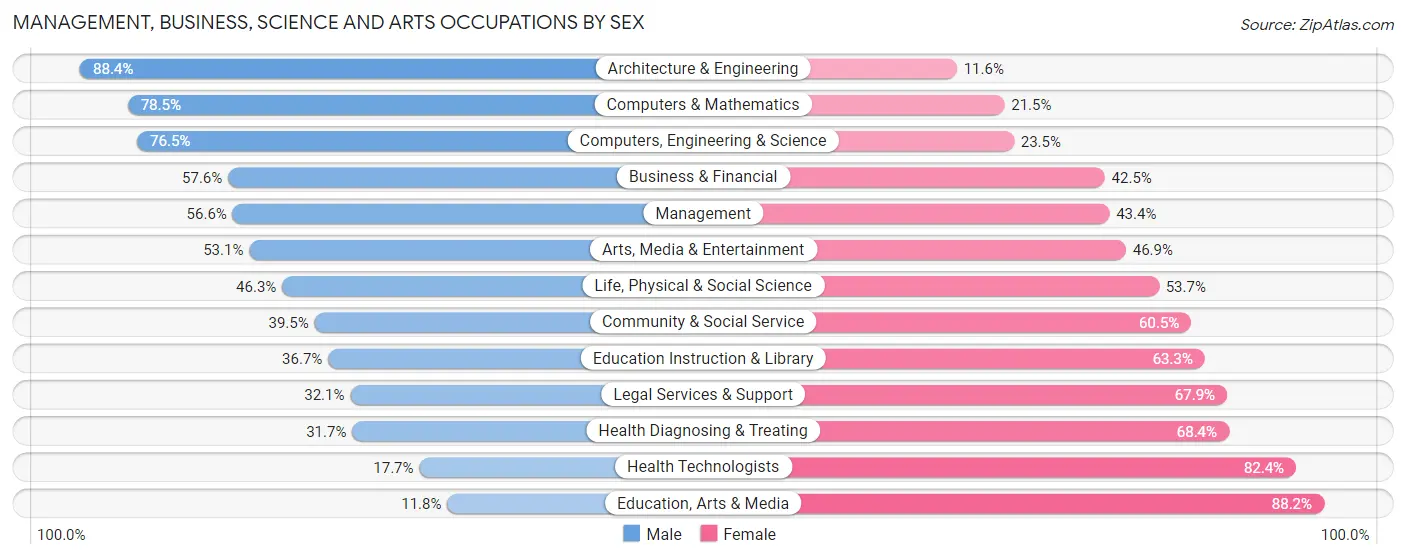
| Occupation | Male | Female |
| Management | 1,407 (56.6%) | 1,079 (43.4%) |
| Business & Financial | 488 (57.6%) | 360 (42.4%) |
| Computers, Engineering & Science | 2,130 (76.5%) | 654 (23.5%) |
| Computers & Mathematics | 1,236 (78.5%) | 339 (21.5%) |
| Architecture & Engineering | 702 (88.4%) | 92 (11.6%) |
| Life, Physical & Social Science | 192 (46.3%) | 223 (53.7%) |
| Community & Social Service | 1,058 (39.5%) | 1,619 (60.5%) |
| Education, Arts & Media | 20 (11.8%) | 149 (88.2%) |
| Legal Services & Support | 109 (32.1%) | 231 (67.9%) |
| Education Instruction & Library | 497 (36.7%) | 858 (63.3%) |
| Arts, Media & Entertainment | 432 (53.1%) | 381 (46.9%) |
| Health Diagnosing & Treating | 289 (31.7%) | 624 (68.3%) |
| Health Technologists | 117 (17.6%) | 546 (82.4%) |
| Total (Category) | 5,372 (55.3%) | 4,336 (44.7%) |
| Total (Overall) | 9,243 (53.1%) | 8,146 (46.9%) |
Services Occupations
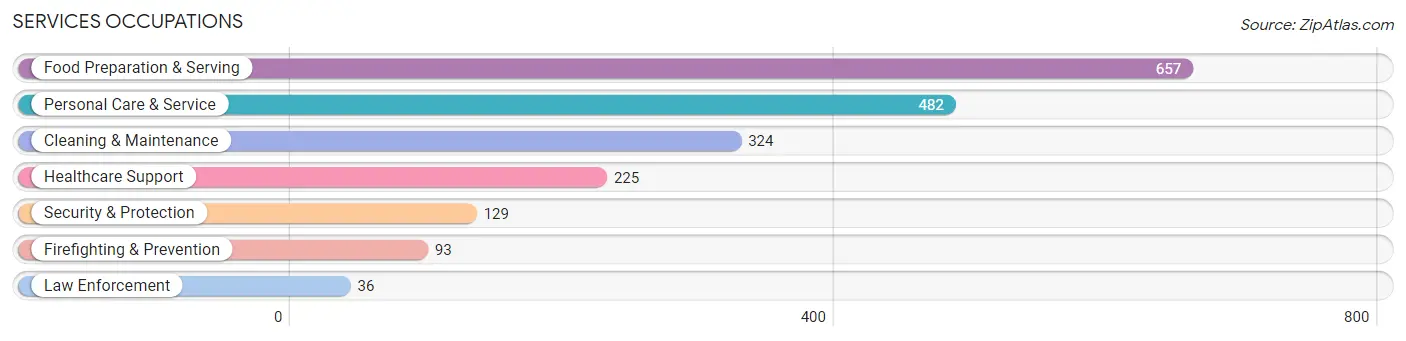
The most common Services occupations in Lafayette are Food Preparation & Serving (657 | 3.8%), Personal Care & Service (482 | 2.8%), Cleaning & Maintenance (324 | 1.9%), Healthcare Support (225 | 1.3%), and Security & Protection (129 | 0.7%).
Services Occupations by Sex
Within the Services occupations in Lafayette, the most male-oriented occupations are Firefighting & Prevention (100.0%), Security & Protection (77.5%), and Cleaning & Maintenance (51.2%), while the most female-oriented occupations are Healthcare Support (100.0%), Law Enforcement (80.6%), and Personal Care & Service (72.2%).
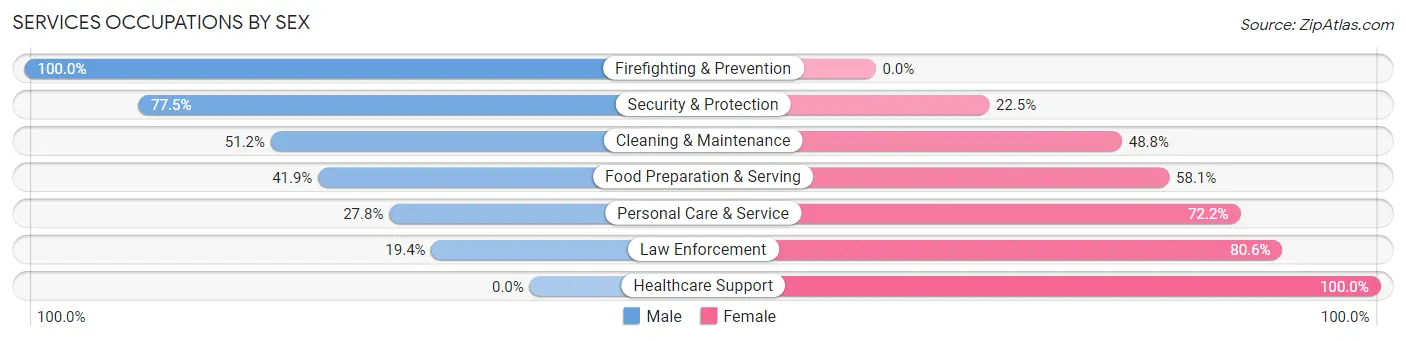
| Occupation | Male | Female |
| Healthcare Support | 0 (0.0%) | 225 (100.0%) |
| Security & Protection | 100 (77.5%) | 29 (22.5%) |
| Firefighting & Prevention | 93 (100.0%) | 0 (0.0%) |
| Law Enforcement | 7 (19.4%) | 29 (80.6%) |
| Food Preparation & Serving | 275 (41.9%) | 382 (58.1%) |
| Cleaning & Maintenance | 166 (51.2%) | 158 (48.8%) |
| Personal Care & Service | 134 (27.8%) | 348 (72.2%) |
| Total (Category) | 675 (37.1%) | 1,142 (62.8%) |
| Total (Overall) | 9,243 (53.1%) | 8,146 (46.9%) |
Sales and Office Occupations
The most common Sales and Office occupations in Lafayette are Sales & Related (1,736 | 10.0%), and Office & Administration (1,626 | 9.3%).

Sales and Office Occupations by Sex

| Occupation | Male | Female |
| Sales & Related | 945 (54.4%) | 791 (45.6%) |
| Office & Administration | 313 (19.3%) | 1,313 (80.7%) |
| Total (Category) | 1,258 (37.4%) | 2,104 (62.6%) |
| Total (Overall) | 9,243 (53.1%) | 8,146 (46.9%) |
Natural Resources, Construction and Maintenance Occupations
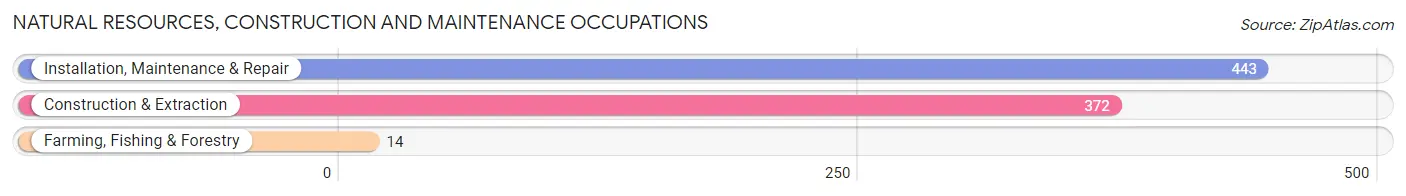
The most common Natural Resources, Construction and Maintenance occupations in Lafayette are Installation, Maintenance & Repair (443 | 2.5%), Construction & Extraction (372 | 2.1%), and Farming, Fishing & Forestry (14 | 0.1%).
Natural Resources, Construction and Maintenance Occupations by Sex
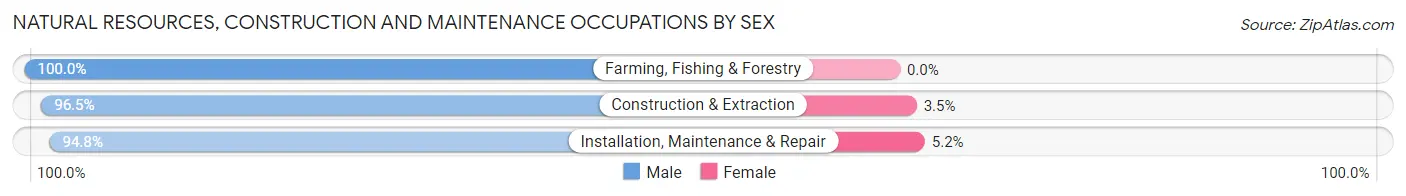
| Occupation | Male | Female |
| Farming, Fishing & Forestry | 14 (100.0%) | 0 (0.0%) |
| Construction & Extraction | 359 (96.5%) | 13 (3.5%) |
| Installation, Maintenance & Repair | 420 (94.8%) | 23 (5.2%) |
| Total (Category) | 793 (95.7%) | 36 (4.3%) |
| Total (Overall) | 9,243 (53.1%) | 8,146 (46.9%) |
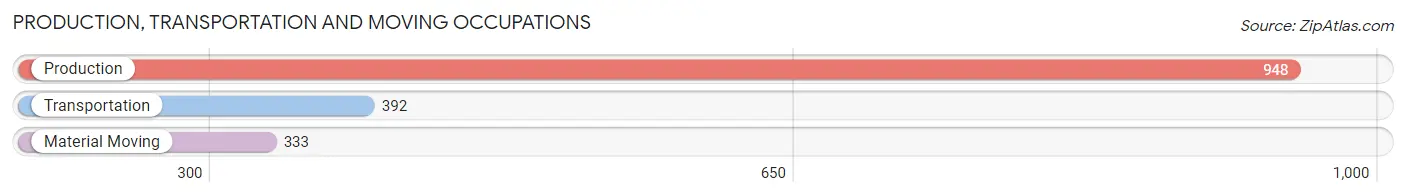
Production, Transportation and Moving Occupations
The most common Production, Transportation and Moving occupations in Lafayette are Production (948 | 5.4%), Transportation (392 | 2.2%), and Material Moving (333 | 1.9%).
Production, Transportation and Moving Occupations by Sex
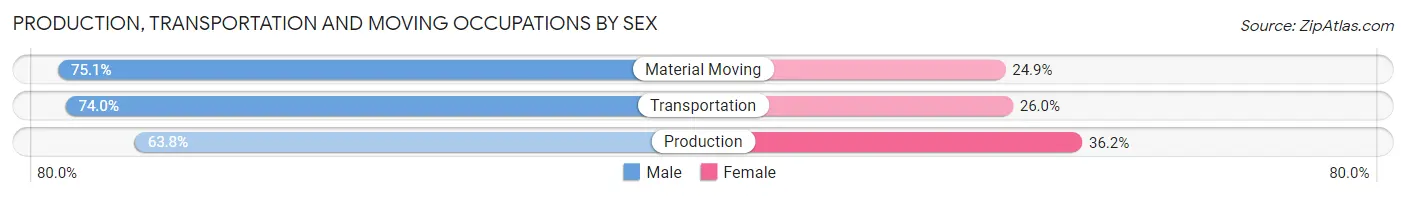
| Occupation | Male | Female |
| Production | 605 (63.8%) | 343 (36.2%) |
| Transportation | 290 (74.0%) | 102 (26.0%) |
| Material Moving | 250 (75.1%) | 83 (24.9%) |
| Total (Category) | 1,145 (68.4%) | 528 (31.6%) |
| Total (Overall) | 9,243 (53.1%) | 8,146 (46.9%) |
Employment Industries by Sex in Lafayette
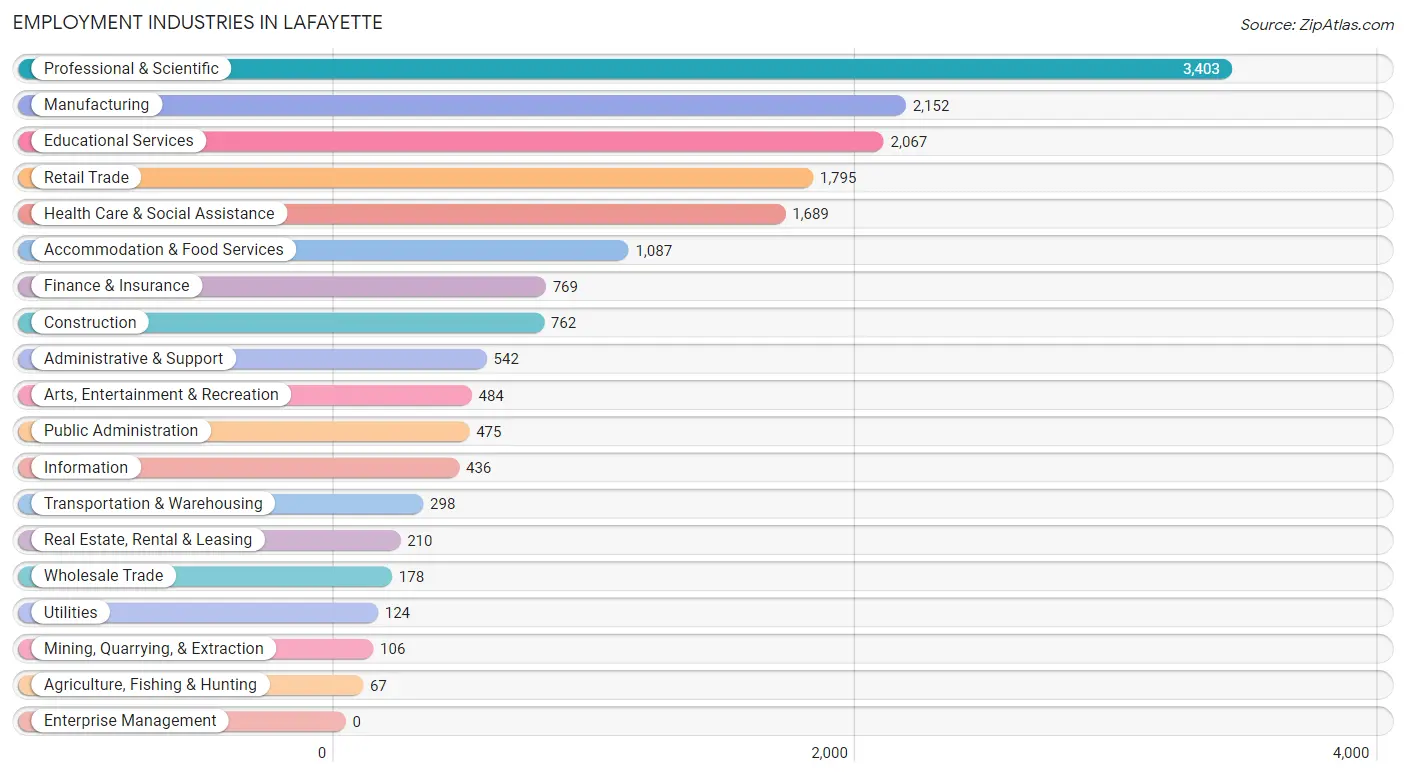
Employment Industries in Lafayette
The major employment industries in Lafayette include Professional & Scientific (3,403 | 19.6%), Manufacturing (2,152 | 12.4%), Educational Services (2,067 | 11.9%), Retail Trade (1,795 | 10.3%), and Health Care & Social Assistance (1,689 | 9.7%).
Employment Industries by Sex in Lafayette
The Lafayette industries that see more men than women are Agriculture, Fishing & Hunting (100.0%), Construction (81.5%), and Transportation & Warehousing (79.9%), whereas the industries that tend to have a higher number of women are Mining, Quarrying, & Extraction (81.1%), Health Care & Social Assistance (70.9%), and Accommodation & Food Services (61.7%).
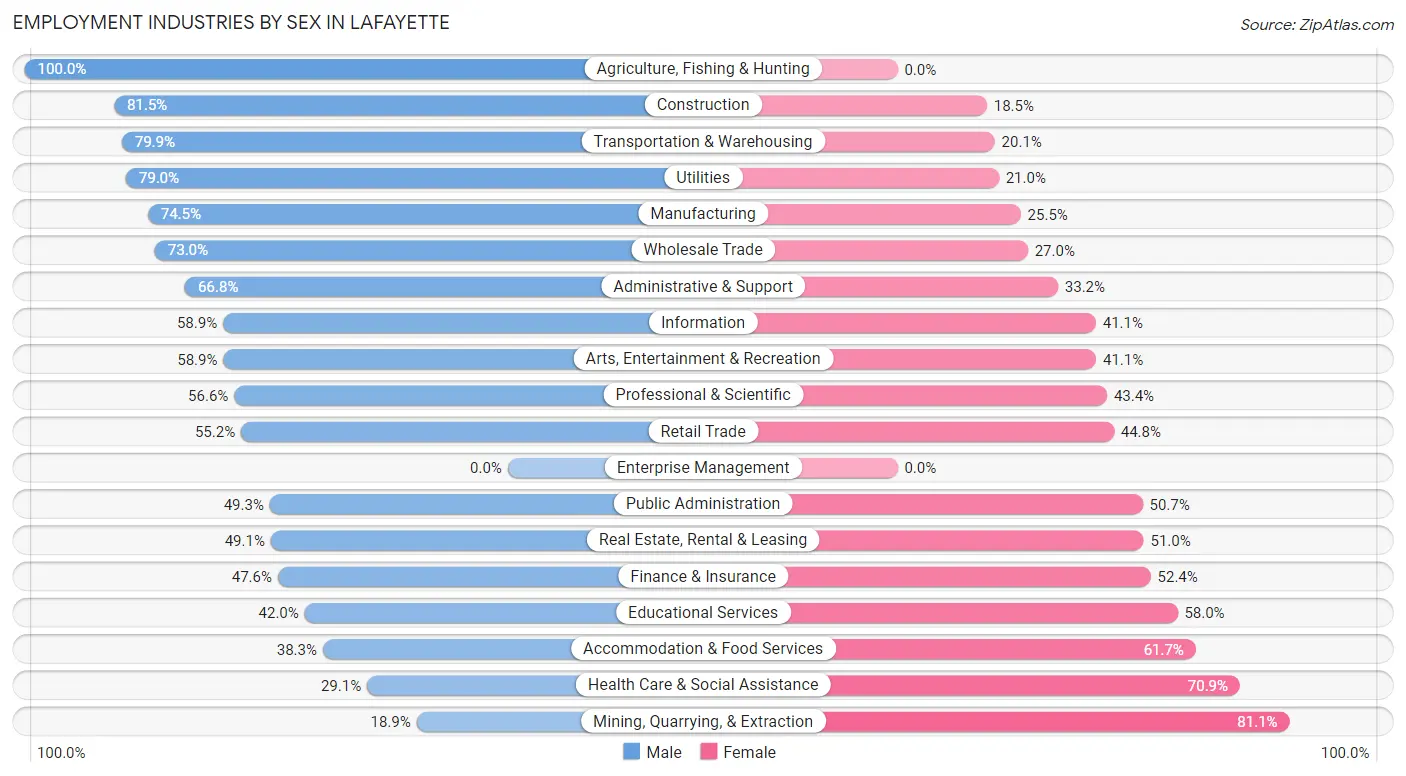
| Industry | Male | Female |
| Agriculture, Fishing & Hunting | 67 (100.0%) | 0 (0.0%) |
| Mining, Quarrying, & Extraction | 20 (18.9%) | 86 (81.1%) |
| Construction | 621 (81.5%) | 141 (18.5%) |
| Manufacturing | 1,603 (74.5%) | 549 (25.5%) |
| Wholesale Trade | 130 (73.0%) | 48 (27.0%) |
| Retail Trade | 991 (55.2%) | 804 (44.8%) |
| Transportation & Warehousing | 238 (79.9%) | 60 (20.1%) |
| Utilities | 98 (79.0%) | 26 (21.0%) |
| Information | 257 (58.9%) | 179 (41.1%) |
| Finance & Insurance | 366 (47.6%) | 403 (52.4%) |
| Real Estate, Rental & Leasing | 103 (49.0%) | 107 (50.9%) |
| Professional & Scientific | 1,927 (56.6%) | 1,476 (43.4%) |
| Enterprise Management | 0 (0.0%) | 0 (0.0%) |
| Administrative & Support | 362 (66.8%) | 180 (33.2%) |
| Educational Services | 869 (42.0%) | 1,198 (58.0%) |
| Health Care & Social Assistance | 492 (29.1%) | 1,197 (70.9%) |
| Arts, Entertainment & Recreation | 285 (58.9%) | 199 (41.1%) |
| Accommodation & Food Services | 416 (38.3%) | 671 (61.7%) |
| Public Administration | 234 (49.3%) | 241 (50.7%) |
| Total | 9,243 (53.1%) | 8,146 (46.9%) |
Education in Lafayette
School Enrollment in Lafayette
The most common levels of schooling among the 7,667 students in Lafayette are middle school (1,922 | 25.1%), elementary school (1,552 | 20.2%), and high school (1,457 | 19.0%).
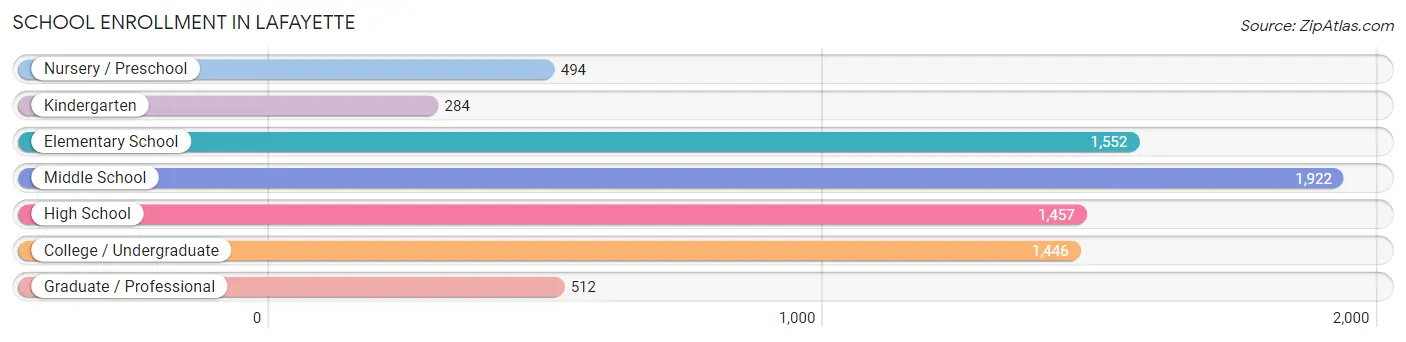
| School Level | # Students | % Students |
| Nursery / Preschool | 494 | 6.4% |
| Kindergarten | 284 | 3.7% |
| Elementary School | 1,552 | 20.2% |
| Middle School | 1,922 | 25.1% |
| High School | 1,457 | 19.0% |
| College / Undergraduate | 1,446 | 18.9% |
| Graduate / Professional | 512 | 6.7% |
| Total | 7,667 | 100.0% |
School Enrollment by Age by Funding Source in Lafayette
Out of a total of 7,667 students who are enrolled in schools in Lafayette, 935 (12.2%) attend a private institution, while the remaining 6,732 (87.8%) are enrolled in public schools. The age group of 3 to 4 year olds has the highest likelihood of being enrolled in private schools, with 273 (63.3% in the age bracket) enrolled. Conversely, the age group of 18 to 19 year olds has the lowest likelihood of being enrolled in a private school, with 598 (95.8% in the age bracket) attending a public institution.
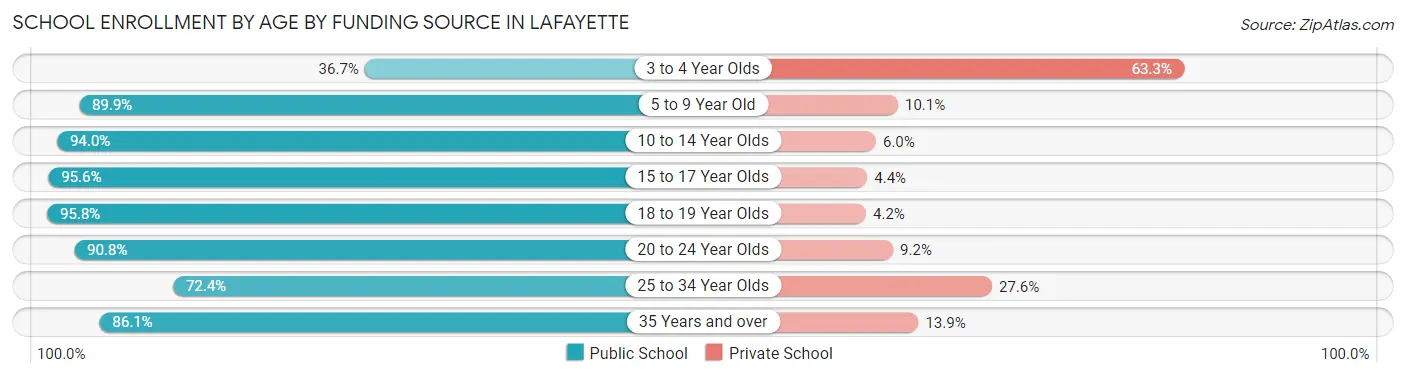
| Age Bracket | Public School | Private School |
| 3 to 4 Year Olds | 158 (36.7%) | 273 (63.3%) |
| 5 to 9 Year Old | 1,605 (89.9%) | 181 (10.1%) |
| 10 to 14 Year Olds | 2,134 (94.0%) | 137 (6.0%) |
| 15 to 17 Year Olds | 931 (95.6%) | 43 (4.4%) |
| 18 to 19 Year Olds | 598 (95.8%) | 26 (4.2%) |
| 20 to 24 Year Olds | 522 (90.8%) | 53 (9.2%) |
| 25 to 34 Year Olds | 432 (72.4%) | 165 (27.6%) |
| 35 Years and over | 352 (86.1%) | 57 (13.9%) |
| Total | 6,732 (87.8%) | 935 (12.2%) |
Educational Attainment by Field of Study in Lafayette
Business (2,051 | 13.7%), engineering (1,571 | 10.5%), social sciences (1,560 | 10.4%), bio, nature & agricultural (1,406 | 9.4%), and computers & mathematics (1,039 | 7.0%) are the most common fields of study among 14,942 individuals in Lafayette who have obtained a bachelor's degree or higher.
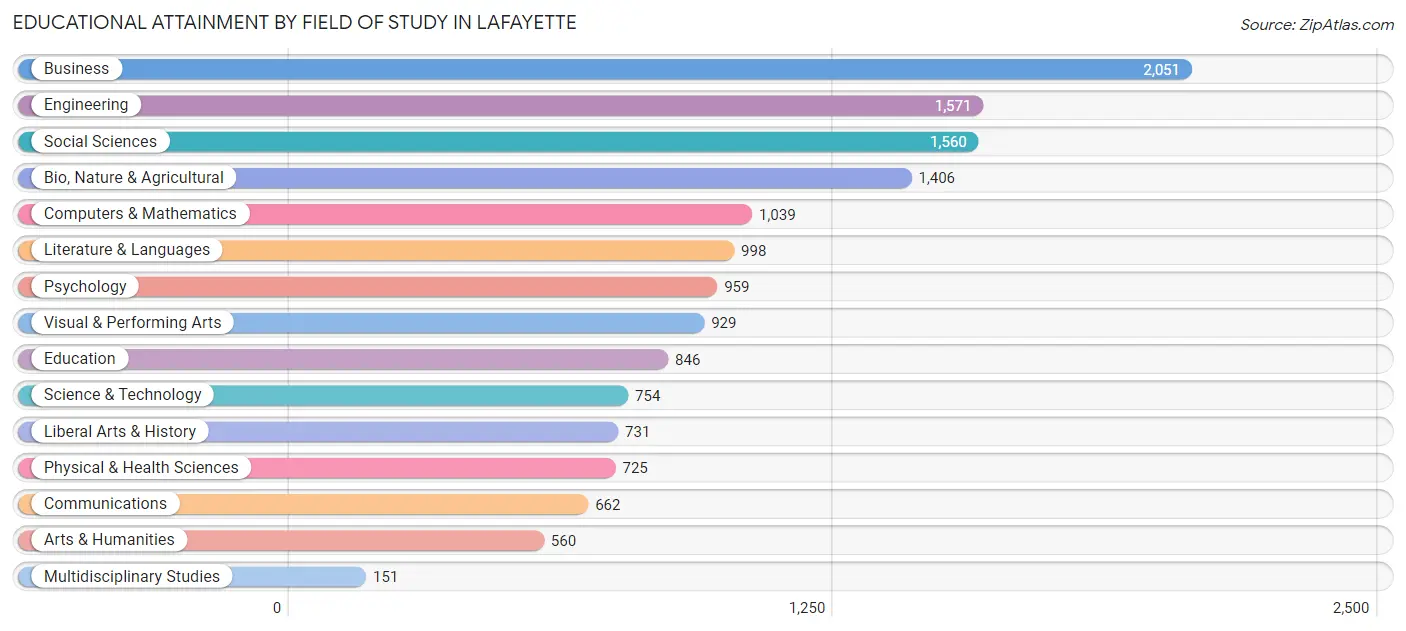
| Field of Study | # Graduates | % Graduates |
| Computers & Mathematics | 1,039 | 7.0% |
| Bio, Nature & Agricultural | 1,406 | 9.4% |
| Physical & Health Sciences | 725 | 4.9% |
| Psychology | 959 | 6.4% |
| Social Sciences | 1,560 | 10.4% |
| Engineering | 1,571 | 10.5% |
| Multidisciplinary Studies | 151 | 1.0% |
| Science & Technology | 754 | 5.1% |
| Business | 2,051 | 13.7% |
| Education | 846 | 5.7% |
| Literature & Languages | 998 | 6.7% |
| Liberal Arts & History | 731 | 4.9% |
| Visual & Performing Arts | 929 | 6.2% |
| Communications | 662 | 4.4% |
| Arts & Humanities | 560 | 3.7% |
| Total | 14,942 | 100.0% |
Transportation & Commute in Lafayette
Vehicle Availability by Sex in Lafayette
The most prevalent vehicle ownership categories in Lafayette are males with 2 vehicles (4,436, accounting for 48.5%) and females with 2 vehicles (4,163, making up 55.6%).
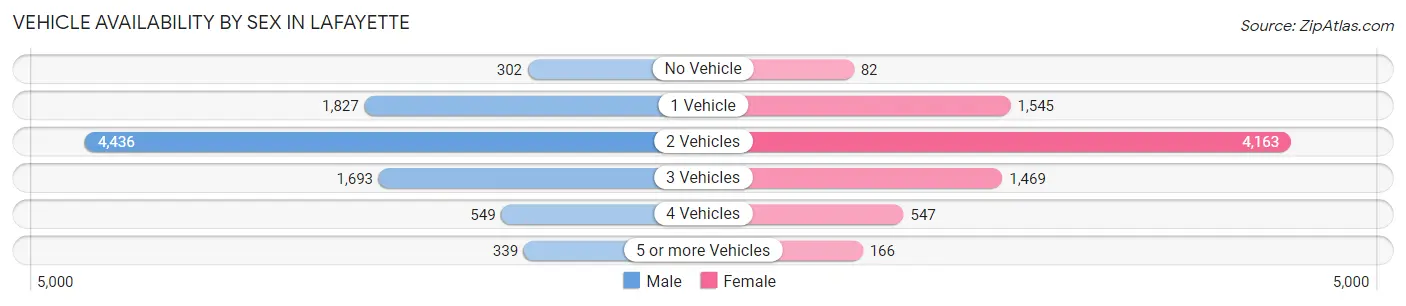
| Vehicles Available | Male | Female |
| No Vehicle | 302 (3.3%) | 82 (1.0%) |
| 1 Vehicle | 1,827 (20.0%) | 1,545 (19.4%) |
| 2 Vehicles | 4,436 (48.5%) | 4,163 (52.2%) |
| 3 Vehicles | 1,693 (18.5%) | 1,469 (18.4%) |
| 4 Vehicles | 549 (6.0%) | 547 (6.9%) |
| 5 or more Vehicles | 339 (3.7%) | 166 (2.1%) |
| Total | 9,146 (100.0%) | 7,972 (100.0%) |
Commute Time in Lafayette
The most frequently occuring commute durations in Lafayette are 20 to 24 minutes (2,636 commuters, 20.1%), 15 to 19 minutes (2,236 commuters, 17.1%), and 30 to 34 minutes (1,640 commuters, 12.5%).
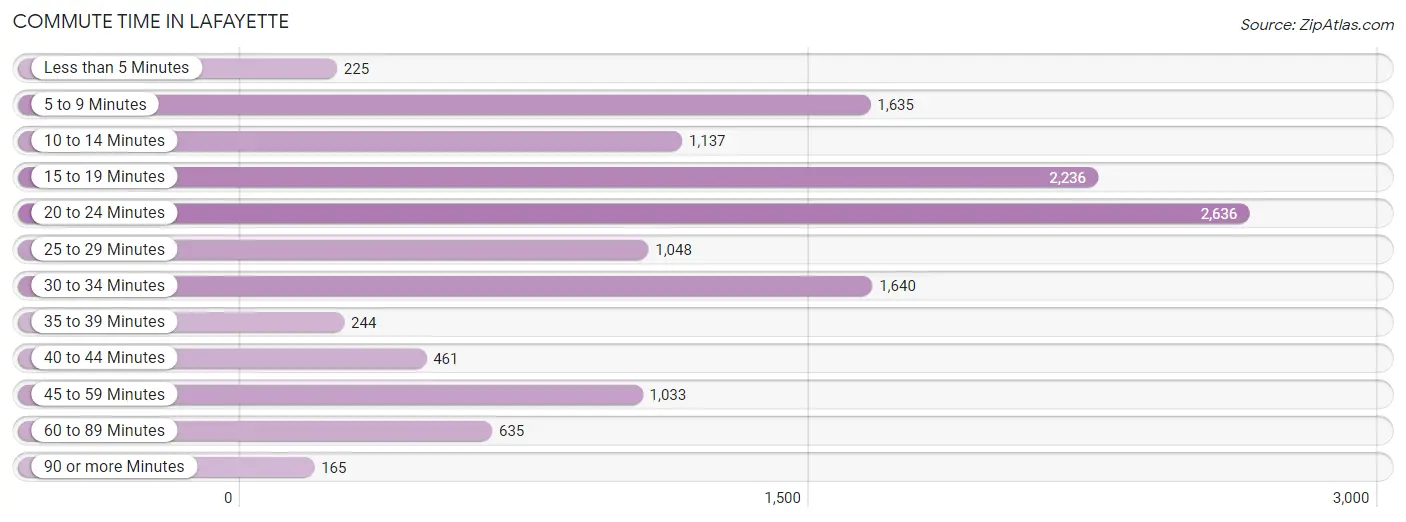
| Commute Time | # Commuters | % Commuters |
| Less than 5 Minutes | 225 | 1.7% |
| 5 to 9 Minutes | 1,635 | 12.5% |
| 10 to 14 Minutes | 1,137 | 8.7% |
| 15 to 19 Minutes | 2,236 | 17.1% |
| 20 to 24 Minutes | 2,636 | 20.1% |
| 25 to 29 Minutes | 1,048 | 8.0% |
| 30 to 34 Minutes | 1,640 | 12.5% |
| 35 to 39 Minutes | 244 | 1.9% |
| 40 to 44 Minutes | 461 | 3.5% |
| 45 to 59 Minutes | 1,033 | 7.9% |
| 60 to 89 Minutes | 635 | 4.9% |
| 90 or more Minutes | 165 | 1.3% |
Commute Time by Sex in Lafayette
The most common commute times in Lafayette are 20 to 24 minutes (1,520 commuters, 21.1%) for males and 20 to 24 minutes (1,116 commuters, 19.0%) for females.
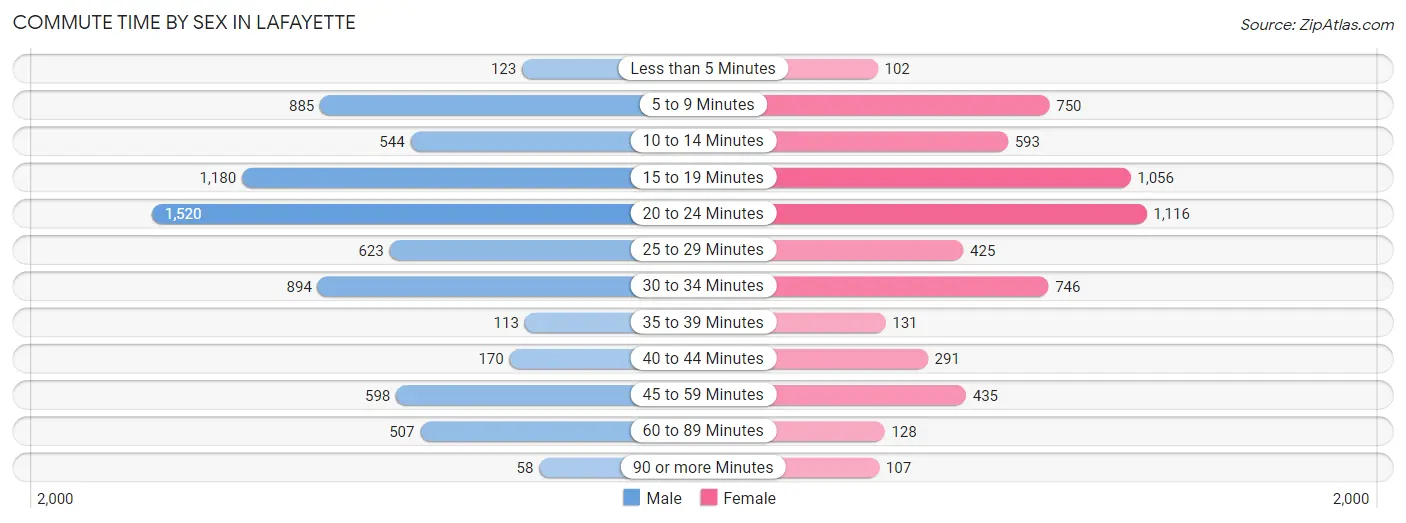
| Commute Time | Male | Female |
| Less than 5 Minutes | 123 (1.7%) | 102 (1.7%) |
| 5 to 9 Minutes | 885 (12.3%) | 750 (12.8%) |
| 10 to 14 Minutes | 544 (7.5%) | 593 (10.1%) |
| 15 to 19 Minutes | 1,180 (16.4%) | 1,056 (18.0%) |
| 20 to 24 Minutes | 1,520 (21.1%) | 1,116 (19.0%) |
| 25 to 29 Minutes | 623 (8.6%) | 425 (7.2%) |
| 30 to 34 Minutes | 894 (12.4%) | 746 (12.7%) |
| 35 to 39 Minutes | 113 (1.6%) | 131 (2.2%) |
| 40 to 44 Minutes | 170 (2.4%) | 291 (5.0%) |
| 45 to 59 Minutes | 598 (8.3%) | 435 (7.4%) |
| 60 to 89 Minutes | 507 (7.0%) | 128 (2.2%) |
| 90 or more Minutes | 58 (0.8%) | 107 (1.8%) |
Time of Departure to Work by Sex in Lafayette
The most frequent times of departure to work in Lafayette are 8:00 AM to 8:29 AM (1,221, 16.9%) for males and 7:30 AM to 7:59 AM (1,032, 17.5%) for females.
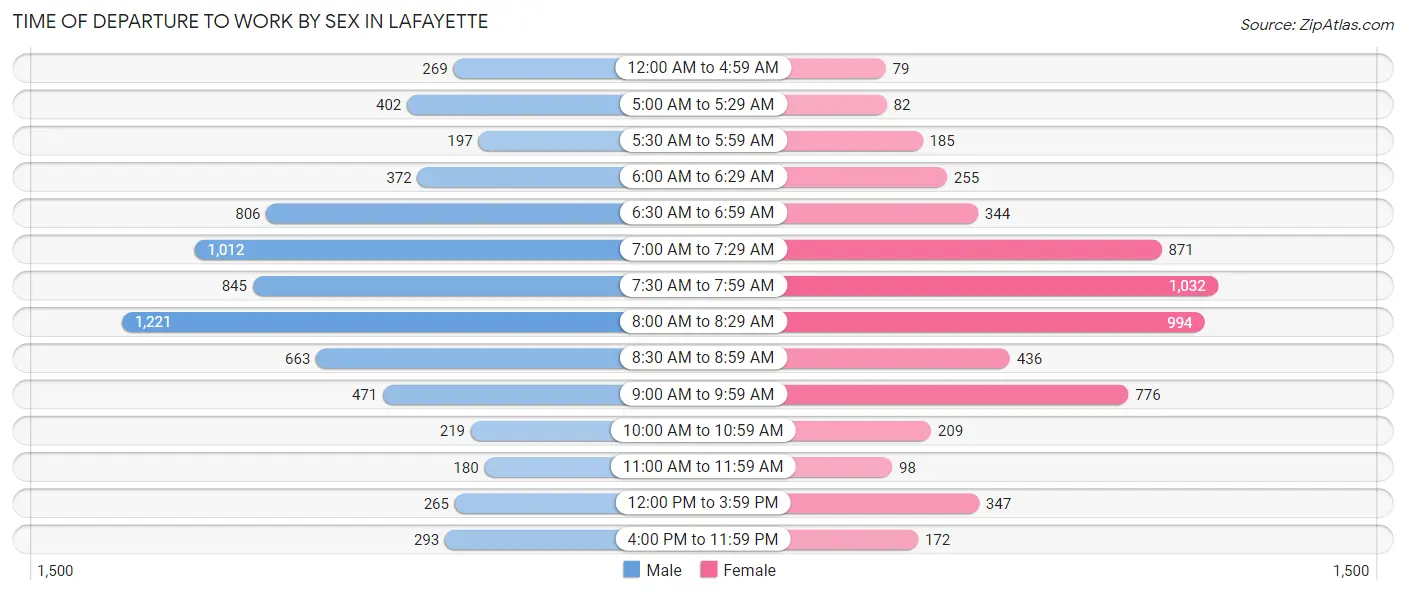
| Time of Departure | Male | Female |
| 12:00 AM to 4:59 AM | 269 (3.7%) | 79 (1.3%) |
| 5:00 AM to 5:29 AM | 402 (5.6%) | 82 (1.4%) |
| 5:30 AM to 5:59 AM | 197 (2.7%) | 185 (3.2%) |
| 6:00 AM to 6:29 AM | 372 (5.2%) | 255 (4.3%) |
| 6:30 AM to 6:59 AM | 806 (11.2%) | 344 (5.9%) |
| 7:00 AM to 7:29 AM | 1,012 (14.0%) | 871 (14.8%) |
| 7:30 AM to 7:59 AM | 845 (11.7%) | 1,032 (17.5%) |
| 8:00 AM to 8:29 AM | 1,221 (16.9%) | 994 (16.9%) |
| 8:30 AM to 8:59 AM | 663 (9.2%) | 436 (7.4%) |
| 9:00 AM to 9:59 AM | 471 (6.5%) | 776 (13.2%) |
| 10:00 AM to 10:59 AM | 219 (3.0%) | 209 (3.5%) |
| 11:00 AM to 11:59 AM | 180 (2.5%) | 98 (1.7%) |
| 12:00 PM to 3:59 PM | 265 (3.7%) | 347 (5.9%) |
| 4:00 PM to 11:59 PM | 293 (4.1%) | 172 (2.9%) |
| Total | 7,215 (100.0%) | 5,880 (100.0%) |
Housing Occupancy in Lafayette
Occupancy by Ownership in Lafayette
Of the total 12,707 dwellings in Lafayette, owner-occupied units account for 8,625 (67.9%), while renter-occupied units make up 4,082 (32.1%).
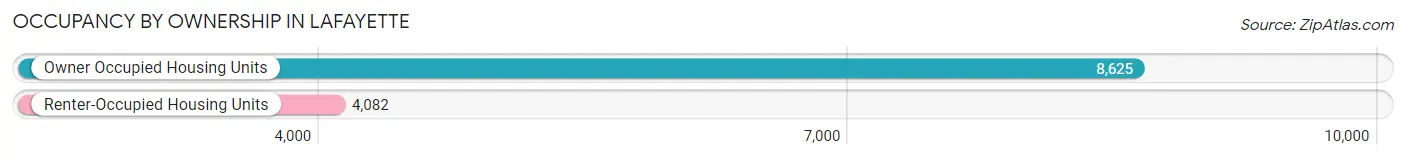
| Occupancy | # Housing Units | % Housing Units |
| Owner Occupied Housing Units | 8,625 | 67.9% |
| Renter-Occupied Housing Units | 4,082 | 32.1% |
| Total Occupied Housing Units | 12,707 | 100.0% |
Occupancy by Household Size in Lafayette
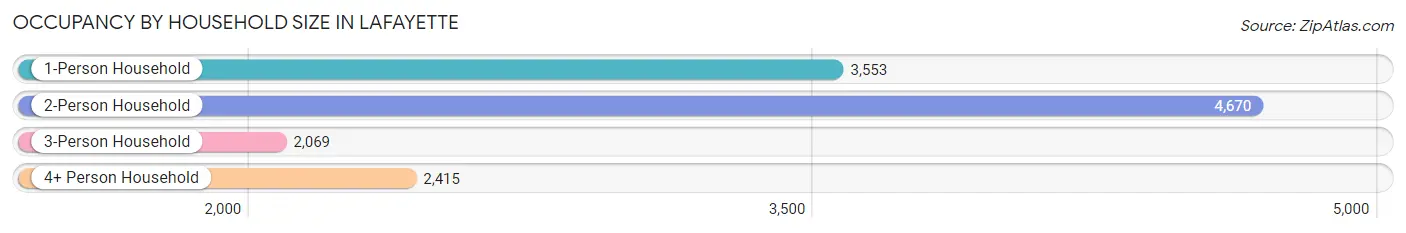
| Household Size | # Housing Units | % Housing Units |
| 1-Person Household | 3,553 | 28.0% |
| 2-Person Household | 4,670 | 36.7% |
| 3-Person Household | 2,069 | 16.3% |
| 4+ Person Household | 2,415 | 19.0% |
| Total Housing Units | 12,707 | 100.0% |
Occupancy by Ownership by Household Size in Lafayette
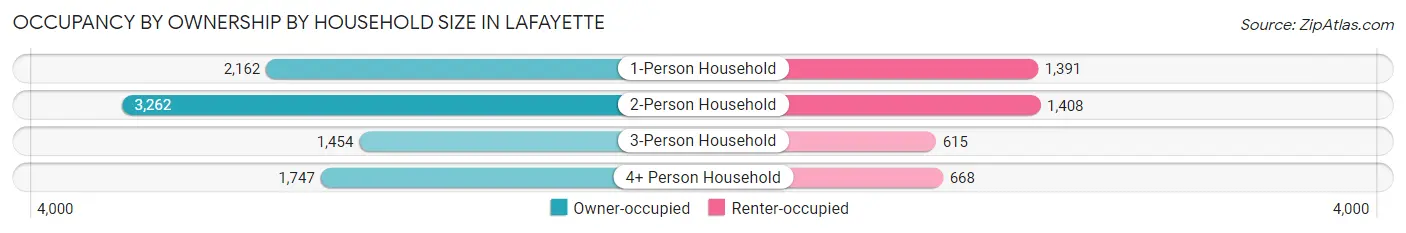
| Household Size | Owner-occupied | Renter-occupied |
| 1-Person Household | 2,162 (60.9%) | 1,391 (39.2%) |
| 2-Person Household | 3,262 (69.9%) | 1,408 (30.1%) |
| 3-Person Household | 1,454 (70.3%) | 615 (29.7%) |
| 4+ Person Household | 1,747 (72.3%) | 668 (27.7%) |
| Total Housing Units | 8,625 (67.9%) | 4,082 (32.1%) |
Occupancy by Educational Attainment in Lafayette
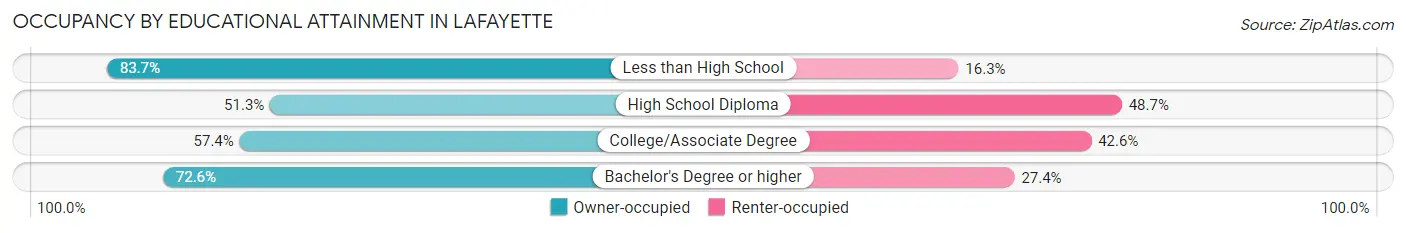
| Household Size | Owner-occupied | Renter-occupied |
| Less than High School | 467 (83.7%) | 91 (16.3%) |
| High School Diploma | 608 (51.3%) | 577 (48.7%) |
| College/Associate Degree | 1,537 (57.4%) | 1,142 (42.6%) |
| Bachelor's Degree or higher | 6,013 (72.6%) | 2,272 (27.4%) |
Occupancy by Age of Householder in Lafayette
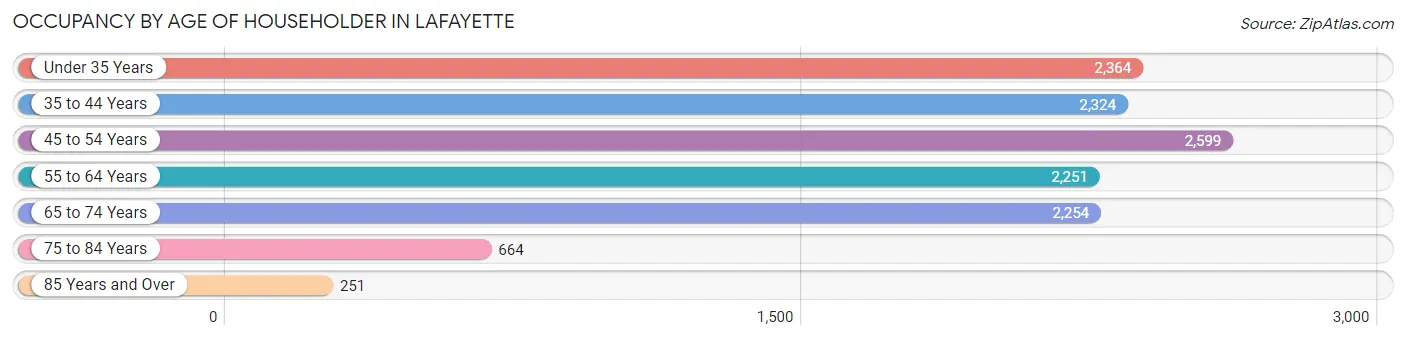
| Age Bracket | # Households | % Households |
| Under 35 Years | 2,364 | 18.6% |
| 35 to 44 Years | 2,324 | 18.3% |
| 45 to 54 Years | 2,599 | 20.4% |
| 55 to 64 Years | 2,251 | 17.7% |
| 65 to 74 Years | 2,254 | 17.7% |
| 75 to 84 Years | 664 | 5.2% |
| 85 Years and Over | 251 | 2.0% |
| Total | 12,707 | 100.0% |
Housing Finances in Lafayette
Median Income by Occupancy in Lafayette
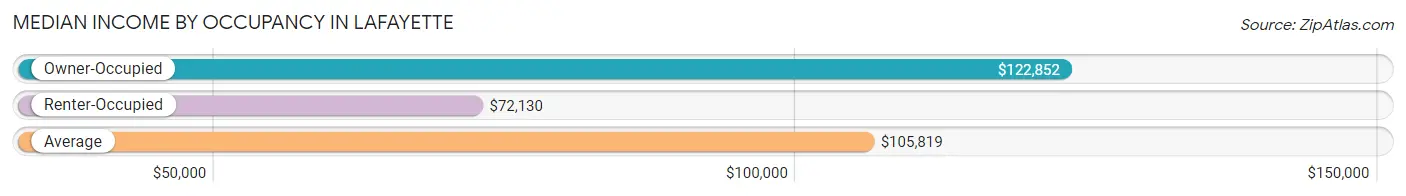
| Occupancy Type | # Households | Median Income |
| Owner-Occupied | 8,625 (67.9%) | $122,852 |
| Renter-Occupied | 4,082 (32.1%) | $72,130 |
| Average | 12,707 (100.0%) | $105,819 |
Occupancy by Householder Income Bracket in Lafayette
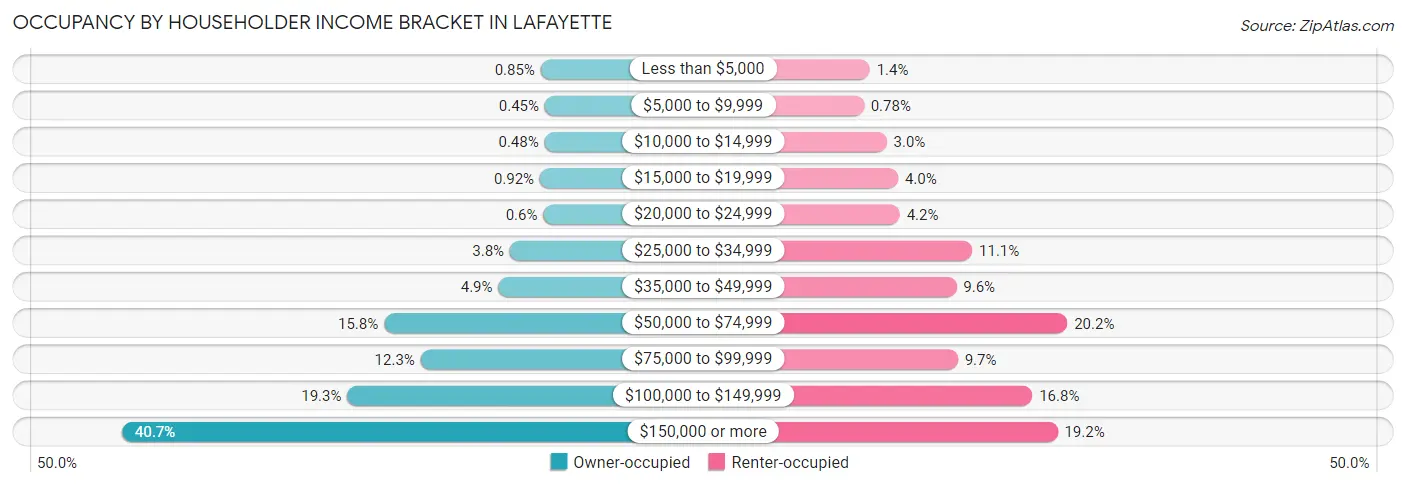
| Income Bracket | Owner-occupied | Renter-occupied |
| Less than $5,000 | 73 (0.9%) | 55 (1.3%) |
| $5,000 to $9,999 | 39 (0.4%) | 32 (0.8%) |
| $10,000 to $14,999 | 41 (0.5%) | 121 (3.0%) |
| $15,000 to $19,999 | 79 (0.9%) | 165 (4.0%) |
| $20,000 to $24,999 | 52 (0.6%) | 172 (4.2%) |
| $25,000 to $34,999 | 326 (3.8%) | 453 (11.1%) |
| $35,000 to $49,999 | 421 (4.9%) | 392 (9.6%) |
| $50,000 to $74,999 | 1,360 (15.8%) | 823 (20.2%) |
| $75,000 to $99,999 | 1,059 (12.3%) | 397 (9.7%) |
| $100,000 to $149,999 | 1,662 (19.3%) | 687 (16.8%) |
| $150,000 or more | 3,513 (40.7%) | 785 (19.2%) |
| Total | 8,625 (100.0%) | 4,082 (100.0%) |
Monthly Housing Cost Tiers in Lafayette
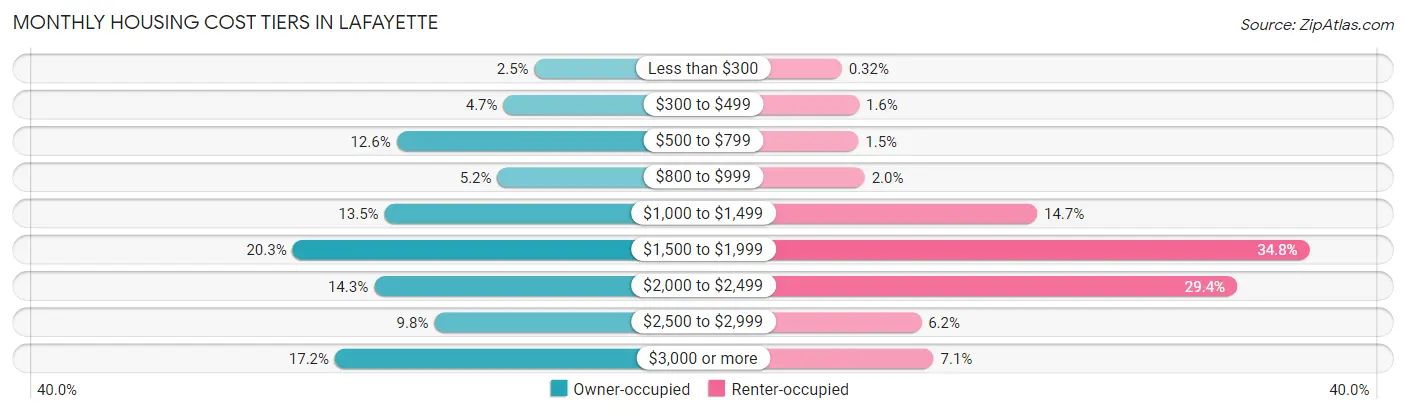
| Monthly Cost | Owner-occupied | Renter-occupied |
| Less than $300 | 211 (2.5%) | 13 (0.3%) |
| $300 to $499 | 409 (4.7%) | 65 (1.6%) |
| $500 to $799 | 1,088 (12.6%) | 63 (1.5%) |
| $800 to $999 | 447 (5.2%) | 82 (2.0%) |
| $1,000 to $1,499 | 1,164 (13.5%) | 600 (14.7%) |
| $1,500 to $1,999 | 1,748 (20.3%) | 1,419 (34.8%) |
| $2,000 to $2,499 | 1,231 (14.3%) | 1,201 (29.4%) |
| $2,500 to $2,999 | 848 (9.8%) | 252 (6.2%) |
| $3,000 or more | 1,479 (17.2%) | 289 (7.1%) |
| Total | 8,625 (100.0%) | 4,082 (100.0%) |
Physical Housing Characteristics in Lafayette
Housing Structures in Lafayette
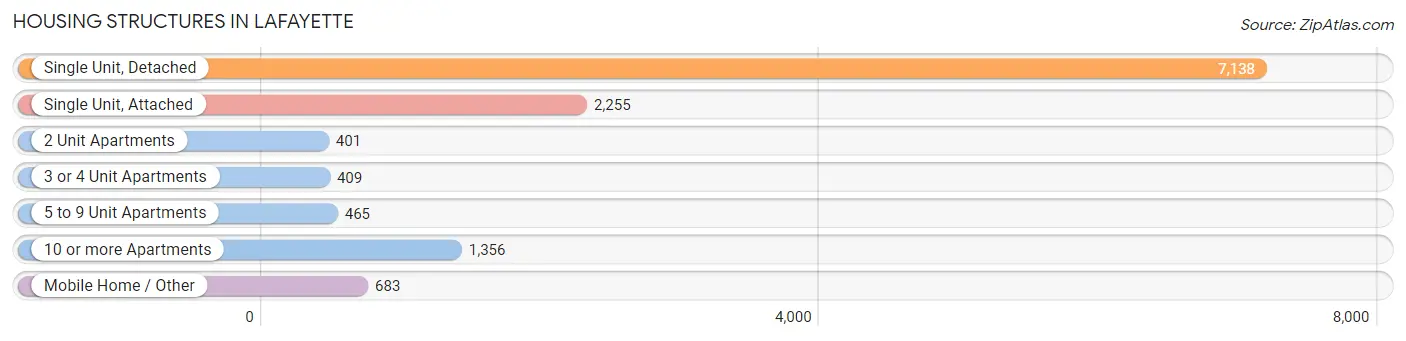
| Structure Type | # Housing Units | % Housing Units |
| Single Unit, Detached | 7,138 | 56.2% |
| Single Unit, Attached | 2,255 | 17.7% |
| 2 Unit Apartments | 401 | 3.2% |
| 3 or 4 Unit Apartments | 409 | 3.2% |
| 5 to 9 Unit Apartments | 465 | 3.7% |
| 10 or more Apartments | 1,356 | 10.7% |
| Mobile Home / Other | 683 | 5.4% |
| Total | 12,707 | 100.0% |
Housing Structures by Occupancy in Lafayette
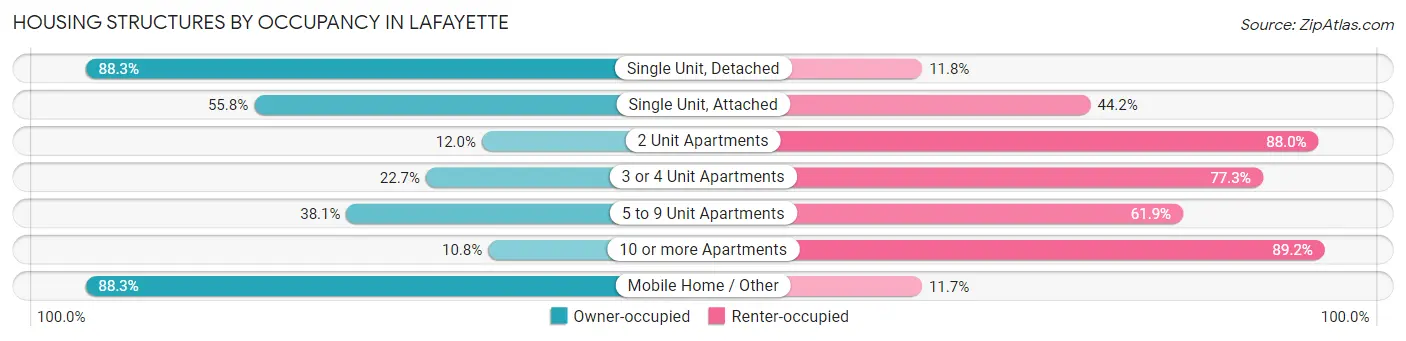
| Structure Type | Owner-occupied | Renter-occupied |
| Single Unit, Detached | 6,299 (88.2%) | 839 (11.7%) |
| Single Unit, Attached | 1,259 (55.8%) | 996 (44.2%) |
| 2 Unit Apartments | 48 (12.0%) | 353 (88.0%) |
| 3 or 4 Unit Apartments | 93 (22.7%) | 316 (77.3%) |
| 5 to 9 Unit Apartments | 177 (38.1%) | 288 (61.9%) |
| 10 or more Apartments | 146 (10.8%) | 1,210 (89.2%) |
| Mobile Home / Other | 603 (88.3%) | 80 (11.7%) |
| Total | 8,625 (67.9%) | 4,082 (32.1%) |
Housing Structures by Number of Rooms in Lafayette
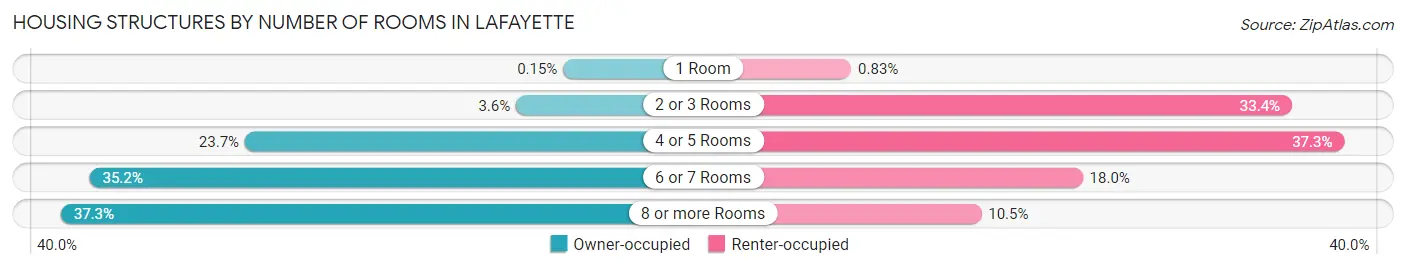
| Number of Rooms | Owner-occupied | Renter-occupied |
| 1 Room | 13 (0.2%) | 34 (0.8%) |
| 2 or 3 Rooms | 314 (3.6%) | 1,365 (33.4%) |
| 4 or 5 Rooms | 2,044 (23.7%) | 1,523 (37.3%) |
| 6 or 7 Rooms | 3,035 (35.2%) | 733 (18.0%) |
| 8 or more Rooms | 3,219 (37.3%) | 427 (10.5%) |
| Total | 8,625 (100.0%) | 4,082 (100.0%) |
Housing Structure by Heating Type in Lafayette
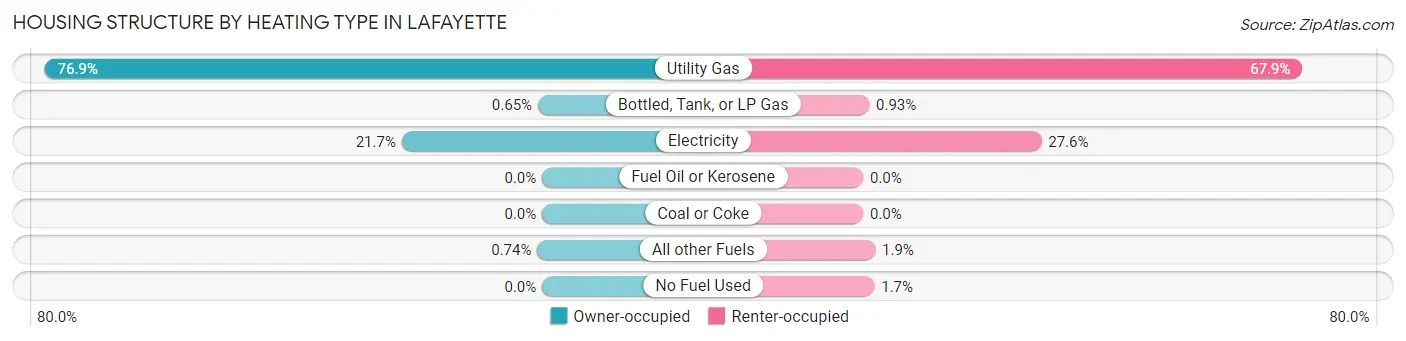
| Heating Type | Owner-occupied | Renter-occupied |
| Utility Gas | 6,633 (76.9%) | 2,772 (67.9%) |
| Bottled, Tank, or LP Gas | 56 (0.6%) | 38 (0.9%) |
| Electricity | 1,872 (21.7%) | 1,125 (27.6%) |
| Fuel Oil or Kerosene | 0 (0.0%) | 0 (0.0%) |
| Coal or Coke | 0 (0.0%) | 0 (0.0%) |
| All other Fuels | 64 (0.7%) | 76 (1.9%) |
| No Fuel Used | 0 (0.0%) | 71 (1.7%) |
| Total | 8,625 (100.0%) | 4,082 (100.0%) |
Household Vehicle Usage in Lafayette
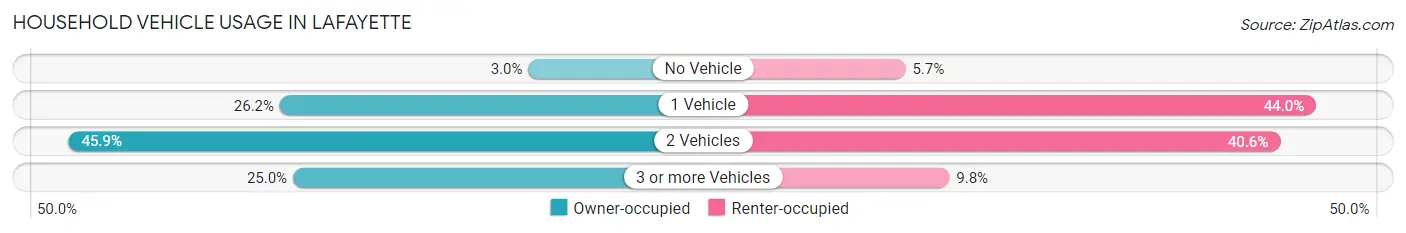
| Vehicles per Household | Owner-occupied | Renter-occupied |
| No Vehicle | 257 (3.0%) | 231 (5.7%) |
| 1 Vehicle | 2,257 (26.2%) | 1,795 (44.0%) |
| 2 Vehicles | 3,959 (45.9%) | 1,658 (40.6%) |
| 3 or more Vehicles | 2,152 (24.9%) | 398 (9.8%) |
| Total | 8,625 (100.0%) | 4,082 (100.0%) |
Real Estate & Mortgages in Lafayette
Real Estate and Mortgage Overview in Lafayette
| Characteristic | Without Mortgage | With Mortgage |
| Housing Units | 2,475 | 6,150 |
| Median Property Value | $554,600 | $626,800 |
| Median Household Income | $85,605 | $2,702 |
| Monthly Housing Costs | $672 | $1,471 |
| Real Estate Taxes | $2,744 | $223 |
Property Value by Mortgage Status in Lafayette
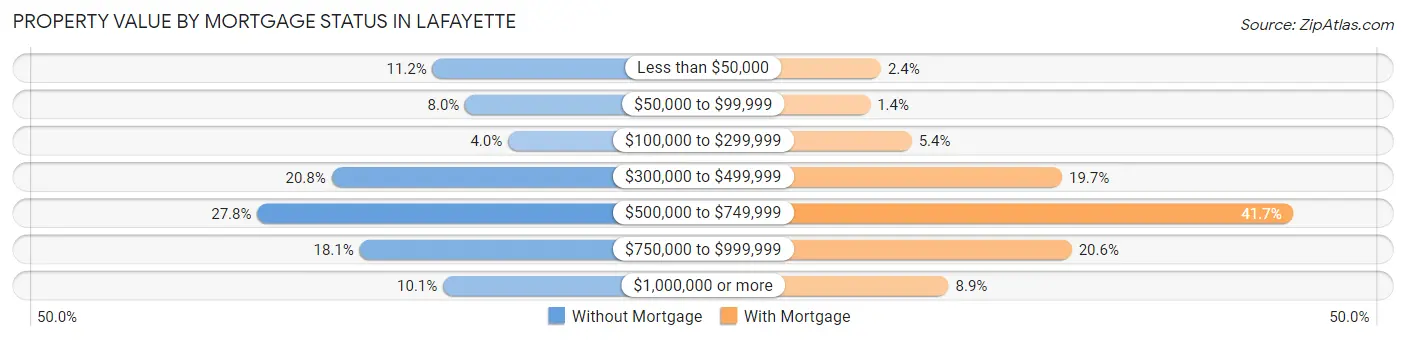
| Property Value | Without Mortgage | With Mortgage |
| Less than $50,000 | 276 (11.2%) | 149 (2.4%) |
| $50,000 to $99,999 | 199 (8.0%) | 86 (1.4%) |
| $100,000 to $299,999 | 98 (4.0%) | 329 (5.3%) |
| $300,000 to $499,999 | 514 (20.8%) | 1,210 (19.7%) |
| $500,000 to $749,999 | 689 (27.8%) | 2,565 (41.7%) |
| $750,000 to $999,999 | 448 (18.1%) | 1,266 (20.6%) |
| $1,000,000 or more | 251 (10.1%) | 545 (8.9%) |
| Total | 2,475 (100.0%) | 6,150 (100.0%) |
Household Income by Mortgage Status in Lafayette
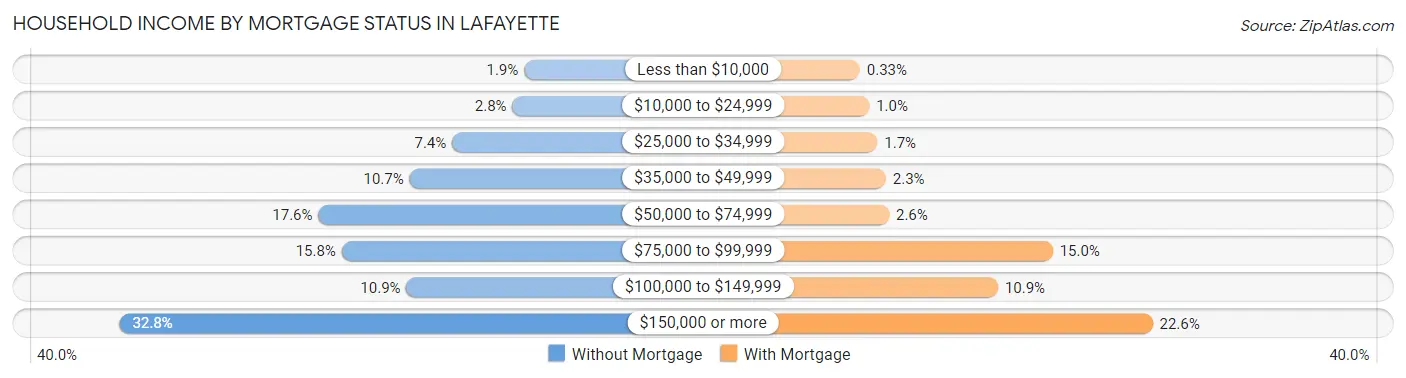
| Household Income | Without Mortgage | With Mortgage |
| Less than $10,000 | 48 (1.9%) | 20 (0.3%) |
| $10,000 to $24,999 | 70 (2.8%) | 64 (1.0%) |
| $25,000 to $34,999 | 184 (7.4%) | 102 (1.7%) |
| $35,000 to $49,999 | 264 (10.7%) | 142 (2.3%) |
| $50,000 to $74,999 | 436 (17.6%) | 157 (2.5%) |
| $75,000 to $99,999 | 392 (15.8%) | 924 (15.0%) |
| $100,000 to $149,999 | 270 (10.9%) | 667 (10.8%) |
| $150,000 or more | 811 (32.8%) | 1,392 (22.6%) |
| Total | 2,475 (100.0%) | 6,150 (100.0%) |
Property Value to Household Income Ratio in Lafayette
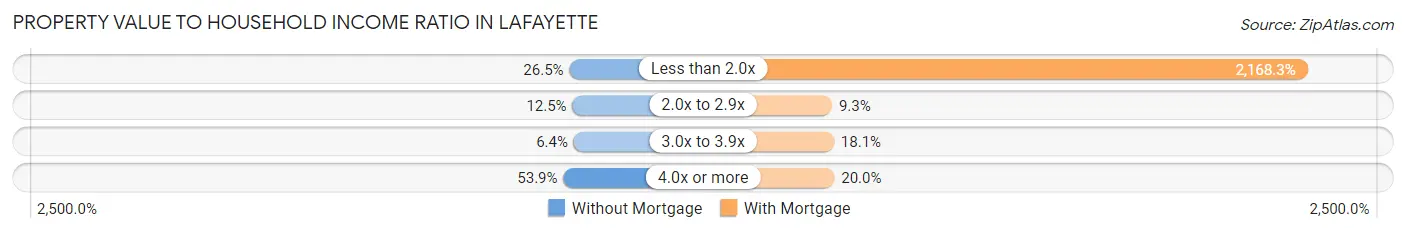
| Value-to-Income Ratio | Without Mortgage | With Mortgage |
| Less than 2.0x | 656 (26.5%) | 133,353 (2,168.3%) |
| 2.0x to 2.9x | 310 (12.5%) | 569 (9.2%) |
| 3.0x to 3.9x | 159 (6.4%) | 1,113 (18.1%) |
| 4.0x or more | 1,334 (53.9%) | 1,230 (20.0%) |
| Total | 2,475 (100.0%) | 6,150 (100.0%) |
Real Estate Taxes by Mortgage Status in Lafayette
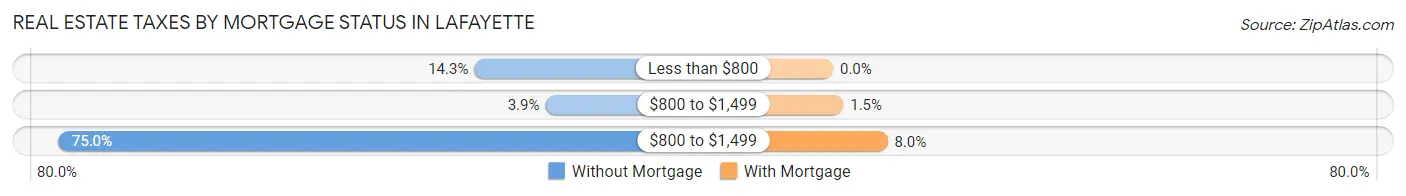
| Property Taxes | Without Mortgage | With Mortgage |
| Less than $800 | 354 (14.3%) | 0 (0.0%) |
| $800 to $1,499 | 97 (3.9%) | 92 (1.5%) |
| $800 to $1,499 | 1,856 (75.0%) | 489 (8.0%) |
| Total | 2,475 (100.0%) | 6,150 (100.0%) |
Health & Disability in Lafayette
Health Insurance Coverage by Age in Lafayette
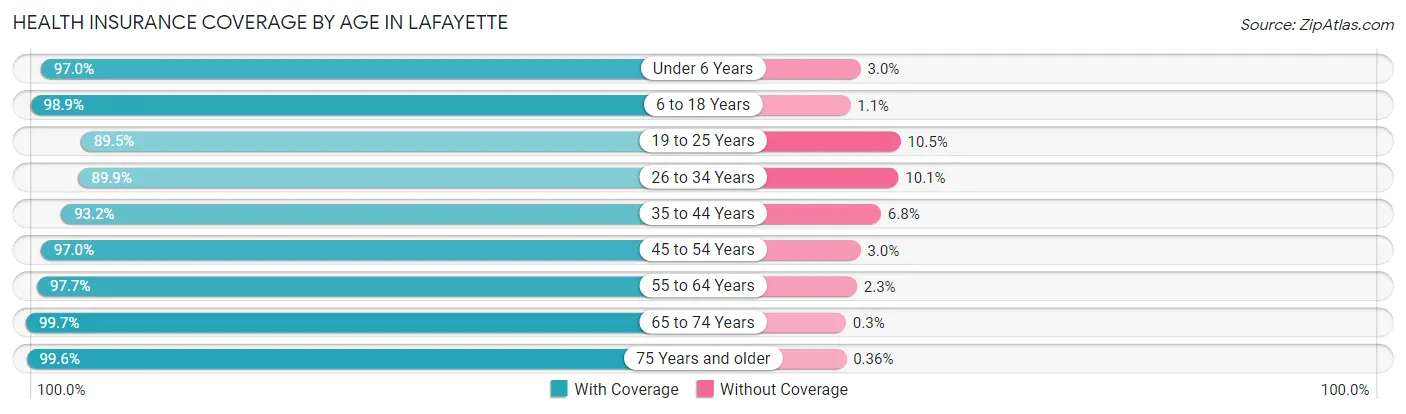
| Age Bracket | With Coverage | Without Coverage |
| Under 6 Years | 1,945 (97.0%) | 61 (3.0%) |
| 6 to 18 Years | 5,181 (98.9%) | 59 (1.1%) |
| 19 to 25 Years | 1,941 (89.5%) | 228 (10.5%) |
| 26 to 34 Years | 3,513 (89.9%) | 394 (10.1%) |
| 35 to 44 Years | 4,254 (93.2%) | 312 (6.8%) |
| 45 to 54 Years | 4,178 (97.0%) | 130 (3.0%) |
| 55 to 64 Years | 3,587 (97.7%) | 86 (2.3%) |
| 65 to 74 Years | 2,977 (99.7%) | 9 (0.3%) |
| 75 Years and older | 1,387 (99.6%) | 5 (0.4%) |
| Total | 28,963 (95.8%) | 1,284 (4.3%) |
Health Insurance Coverage by Citizenship Status in Lafayette
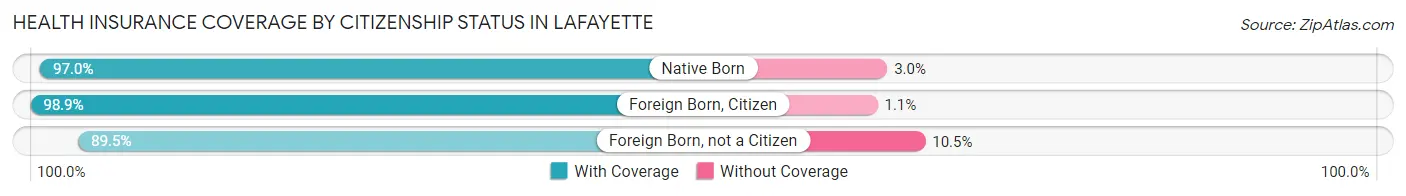
| Citizenship Status | With Coverage | Without Coverage |
| Native Born | 1,945 (97.0%) | 61 (3.0%) |
| Foreign Born, Citizen | 5,181 (98.9%) | 59 (1.1%) |
| Foreign Born, not a Citizen | 1,941 (89.5%) | 228 (10.5%) |
Health Insurance Coverage by Household Income in Lafayette
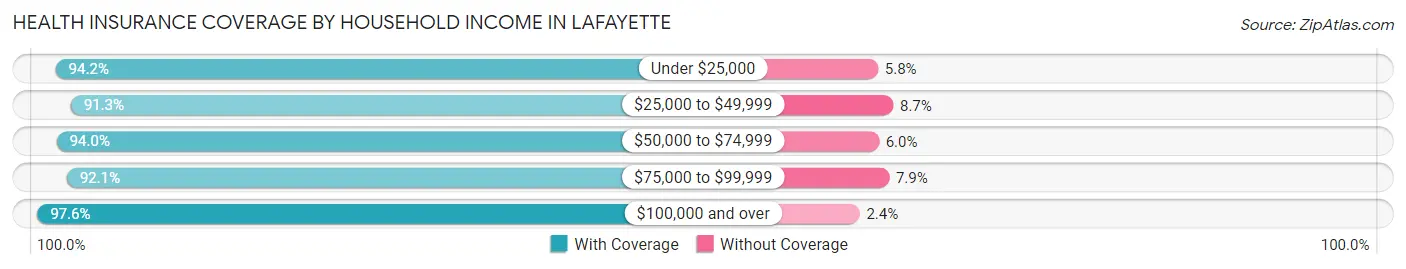
| Household Income | With Coverage | Without Coverage |
| Under $25,000 | 1,148 (94.2%) | 71 (5.8%) |
| $25,000 to $49,999 | 2,521 (91.3%) | 239 (8.7%) |
| $50,000 to $74,999 | 4,198 (94.0%) | 267 (6.0%) |
| $75,000 to $99,999 | 3,171 (92.1%) | 272 (7.9%) |
| $100,000 and over | 17,895 (97.6%) | 435 (2.4%) |
Public vs Private Health Insurance Coverage by Age in Lafayette
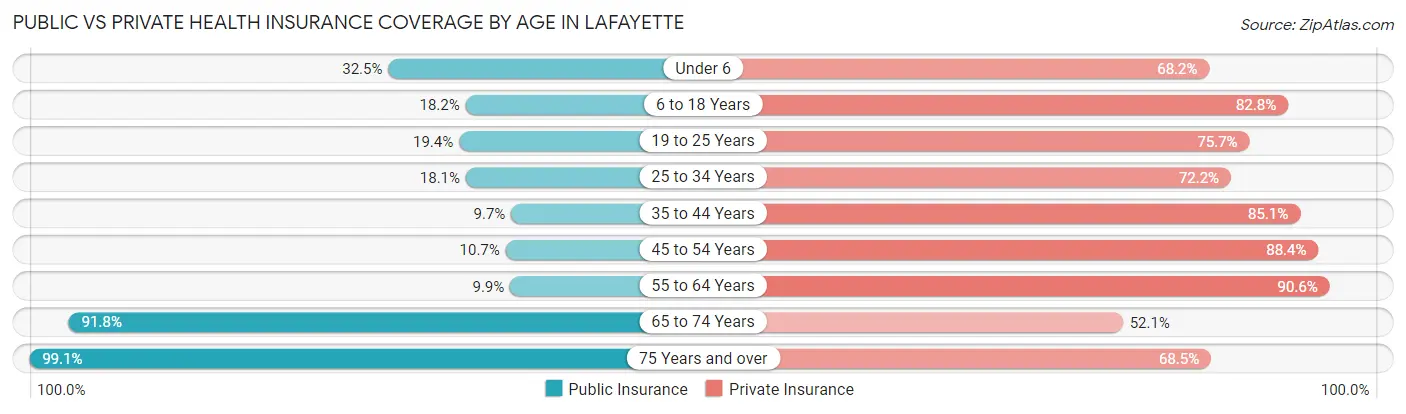
| Age Bracket | Public Insurance | Private Insurance |
| Under 6 | 652 (32.5%) | 1,368 (68.2%) |
| 6 to 18 Years | 951 (18.1%) | 4,339 (82.8%) |
| 19 to 25 Years | 420 (19.4%) | 1,641 (75.7%) |
| 25 to 34 Years | 707 (18.1%) | 2,822 (72.2%) |
| 35 to 44 Years | 442 (9.7%) | 3,884 (85.1%) |
| 45 to 54 Years | 462 (10.7%) | 3,810 (88.4%) |
| 55 to 64 Years | 363 (9.9%) | 3,326 (90.5%) |
| 65 to 74 Years | 2,742 (91.8%) | 1,557 (52.1%) |
| 75 Years and over | 1,380 (99.1%) | 954 (68.5%) |
| Total | 8,119 (26.8%) | 23,701 (78.4%) |
Disability Status by Sex by Age in Lafayette
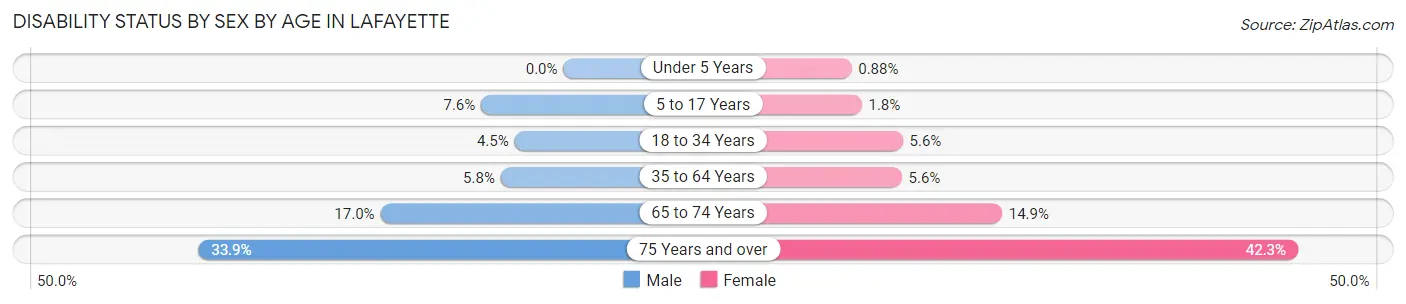
| Age Bracket | Male | Female |
| Under 5 Years | 0 (0.0%) | 6 (0.9%) |
| 5 to 17 Years | 184 (7.6%) | 50 (1.8%) |
| 18 to 34 Years | 147 (4.5%) | 182 (5.6%) |
| 35 to 64 Years | 365 (5.8%) | 348 (5.6%) |
| 65 to 74 Years | 244 (17.0%) | 230 (14.8%) |
| 75 Years and over | 185 (33.9%) | 358 (42.3%) |
Disability Class by Sex by Age in Lafayette
Disability Class: Hearing Difficulty
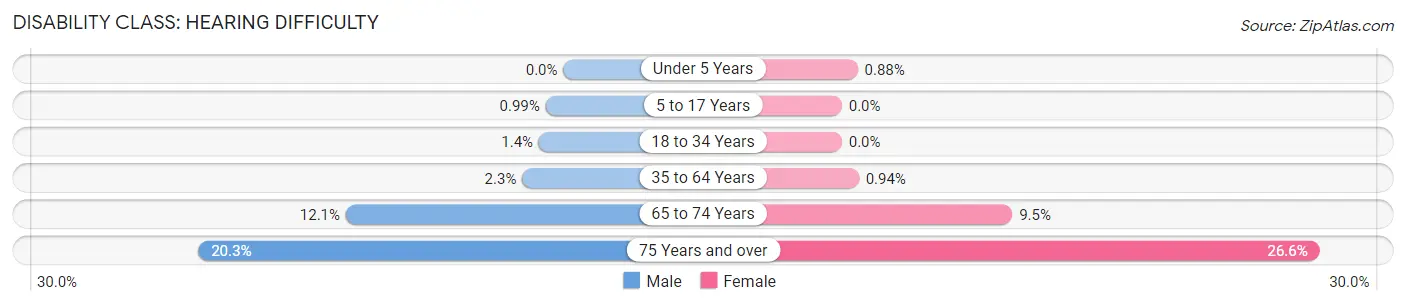
| Age Bracket | Male | Female |
| Under 5 Years | 0 (0.0%) | 6 (0.9%) |
| 5 to 17 Years | 24 (1.0%) | 0 (0.0%) |
| 18 to 34 Years | 44 (1.4%) | 0 (0.0%) |
| 35 to 64 Years | 144 (2.3%) | 59 (0.9%) |
| 65 to 74 Years | 174 (12.1%) | 147 (9.5%) |
| 75 Years and over | 111 (20.3%) | 225 (26.6%) |
Disability Class: Vision Difficulty
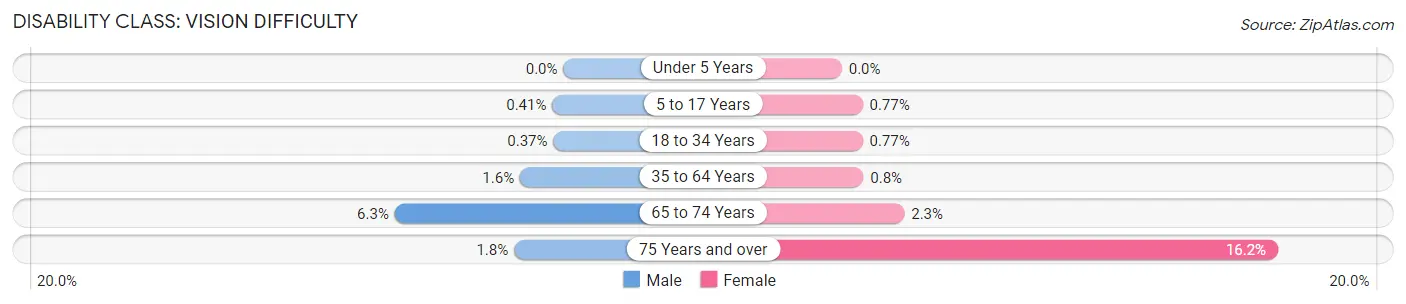
| Age Bracket | Male | Female |
| Under 5 Years | 0 (0.0%) | 0 (0.0%) |
| 5 to 17 Years | 10 (0.4%) | 21 (0.8%) |
| 18 to 34 Years | 12 (0.4%) | 25 (0.8%) |
| 35 to 64 Years | 101 (1.6%) | 50 (0.8%) |
| 65 to 74 Years | 90 (6.3%) | 36 (2.3%) |
| 75 Years and over | 10 (1.8%) | 137 (16.2%) |
Disability Class: Cognitive Difficulty
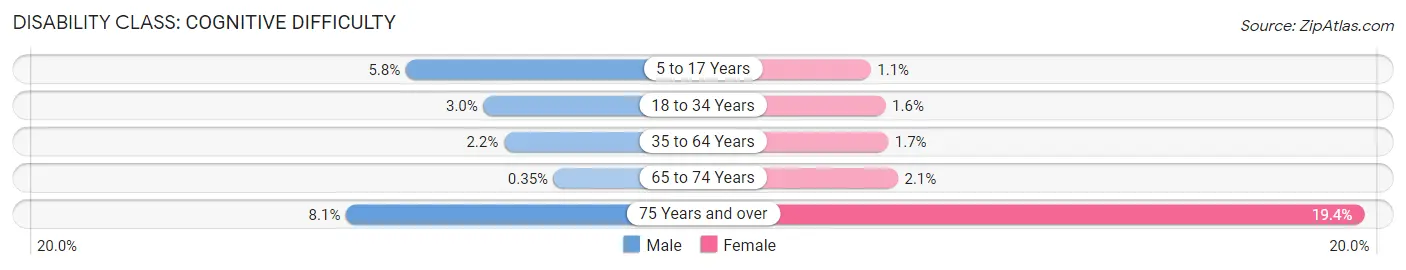
| Age Bracket | Male | Female |
| 5 to 17 Years | 141 (5.8%) | 29 (1.1%) |
| 18 to 34 Years | 96 (3.0%) | 52 (1.6%) |
| 35 to 64 Years | 138 (2.2%) | 107 (1.7%) |
| 65 to 74 Years | 5 (0.4%) | 32 (2.1%) |
| 75 Years and over | 44 (8.1%) | 164 (19.4%) |
Disability Class: Ambulatory Difficulty
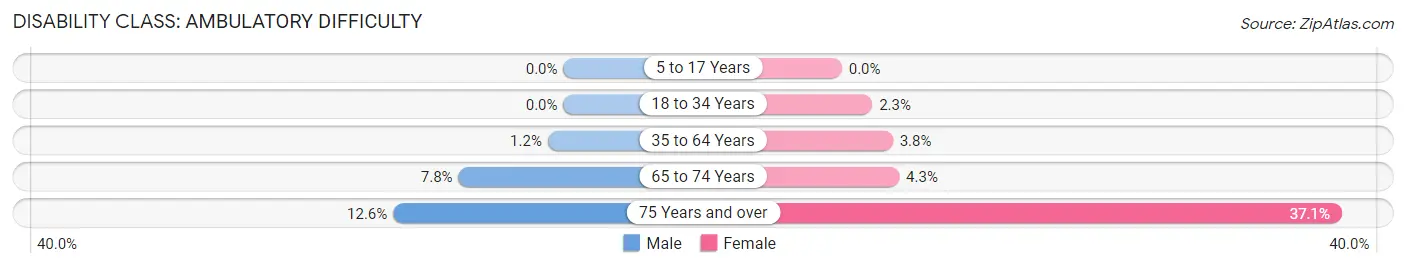
| Age Bracket | Male | Female |
| 5 to 17 Years | 0 (0.0%) | 0 (0.0%) |
| 18 to 34 Years | 0 (0.0%) | 73 (2.3%) |
| 35 to 64 Years | 73 (1.2%) | 237 (3.8%) |
| 65 to 74 Years | 112 (7.8%) | 66 (4.3%) |
| 75 Years and over | 69 (12.6%) | 314 (37.1%) |
Disability Class: Self-Care Difficulty
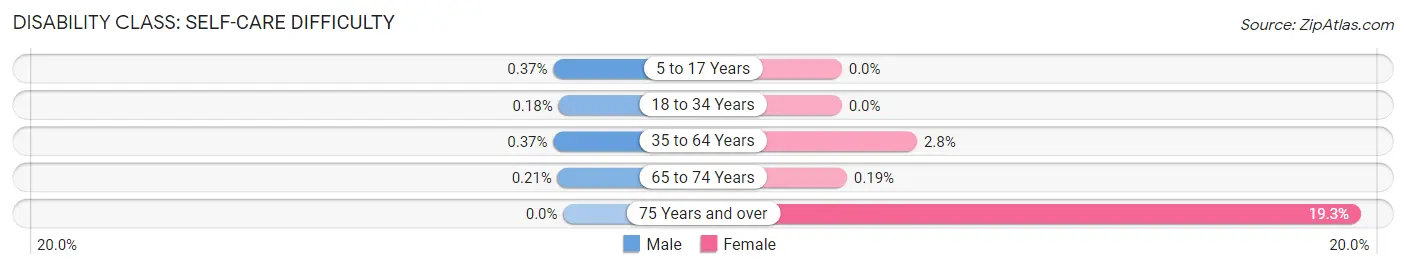
| Age Bracket | Male | Female |
| 5 to 17 Years | 9 (0.4%) | 0 (0.0%) |
| 18 to 34 Years | 6 (0.2%) | 0 (0.0%) |
| 35 to 64 Years | 23 (0.4%) | 175 (2.8%) |
| 65 to 74 Years | 3 (0.2%) | 3 (0.2%) |
| 75 Years and over | 0 (0.0%) | 163 (19.3%) |
Technology Access in Lafayette
Computing Device Access in Lafayette
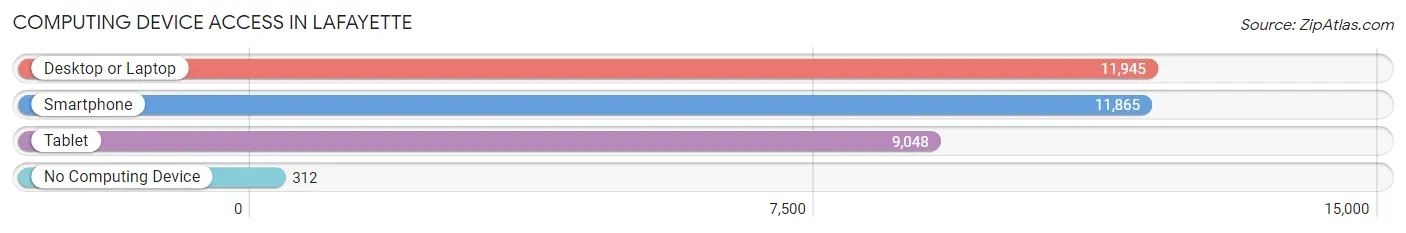
| Device Type | # Households | % Households |
| Desktop or Laptop | 11,945 | 94.0% |
| Smartphone | 11,865 | 93.4% |
| Tablet | 9,048 | 71.2% |
| No Computing Device | 312 | 2.5% |
| Total | 12,707 | 100.0% |
Internet Access in Lafayette
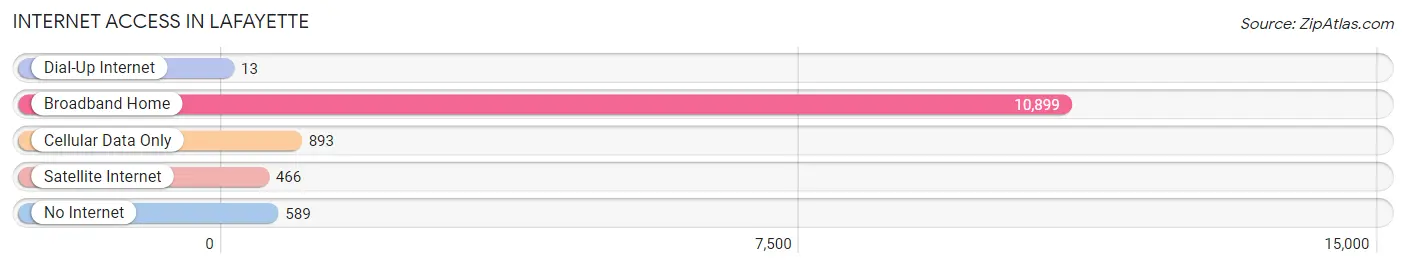
| Internet Type | # Households | % Households |
| Dial-Up Internet | 13 | 0.1% |
| Broadband Home | 10,899 | 85.8% |
| Cellular Data Only | 893 | 7.0% |
| Satellite Internet | 466 | 3.7% |
| No Internet | 589 | 4.6% |
| Total | 12,707 | 100.0% |
Lafayette Summary
Lafayette is a city located in Boulder County, Colorado, United States. The city is situated in the foothills of the Rocky Mountains, approximately 25 miles northwest of Denver. As of the 2010 census, the population of Lafayette was 24,453.
History
The area that is now Lafayette was originally inhabited by the Arapaho and Cheyenne Native American tribes. The first European settlers arrived in the area in the late 1800s, and the town of Lafayette was officially incorporated in 1888. The town was named after the Marquis de Lafayette, a French military leader who fought alongside the American colonists during the Revolutionary War.
In the early 1900s, the town of Lafayette experienced a period of rapid growth, due in part to the discovery of coal in the area. The coal industry provided jobs and economic stability to the town, and by the mid-1900s, Lafayette had become a thriving community.
Geography
Lafayette is located in Boulder County, Colorado, at the base of the Rocky Mountains. The city is situated at an elevation of 5,400 feet above sea level. The city covers an area of 8.3 square miles, and is bordered by the cities of Louisville to the north, Broomfield to the east, and Boulder to the south.
The city of Lafayette is located in a semi-arid climate zone, with hot summers and cold winters. The average annual temperature is 54 degrees Fahrenheit, and the average annual precipitation is 16.5 inches.
Economy
The economy of Lafayette is largely based on the service industry. The city is home to a variety of retail stores, restaurants, and other businesses. The city is also home to several technology companies, including IBM, Oracle, and Google.
The city of Lafayette is also home to several educational institutions, including the University of Colorado Boulder, Naropa University, and Front Range Community College.
Demographics
As of the 2010 census, the population of Lafayette was 24,453. The racial makeup of the city was 79.3% White, 5.2% African American, 0.7% Native American, 5.2% Asian, 0.2% Pacific Islander, and 5.2% from other races. The median household income in Lafayette was $63,945, and the median family income was $77,837.
Conclusion
Lafayette is a city located in Boulder County, Colorado, United States. The city is situated in the foothills of the Rocky Mountains, approximately 25 miles northwest of Denver. The city was originally inhabited by the Arapaho and Cheyenne Native American tribes, and was officially incorporated in 1888. The economy of Lafayette is largely based on the service industry, and the city is home to several educational institutions. As of the 2010 census, the population of Lafayette was 24,453.
Common Questions
What is Per Capita Income in Lafayette?
Per Capita income in Lafayette is $59,338.
What is the Median Family Income in Lafayette?
Median Family Income in Lafayette is $131,329.
What is the Median Household income in Lafayette?
Median Household Income in Lafayette is $105,819.
What is Income or Wage Gap in Lafayette?
Income or Wage Gap in Lafayette is 30.8%.
Women in Lafayette earn 69.2 cents for every dollar earned by a man.
What is Inequality or Gini Index in Lafayette?
Inequality or Gini Index in Lafayette is 0.44.
What is the Total Population of Lafayette?
Total Population of Lafayette is 30,295.
What is the Total Male Population of Lafayette?
Total Male Population of Lafayette is 14,949.
What is the Total Female Population of Lafayette?
Total Female Population of Lafayette is 15,346.
What is the Ratio of Males per 100 Females in Lafayette?
There are 97.41 Males per 100 Females in Lafayette.
What is the Ratio of Females per 100 Males in Lafayette?
There are 102.66 Females per 100 Males in Lafayette.
What is the Median Population Age in Lafayette?
Median Population Age in Lafayette is 38.7 Years.
What is the Average Family Size in Lafayette
Average Family Size in Lafayette is 2.9 People.
What is the Average Household Size in Lafayette
Average Household Size in Lafayette is 2.4 People.
How Large is the Labor Force in Lafayette?
There are 18,058 People in the Labor Forcein in Lafayette.
What is the Percentage of People in the Labor Force in Lafayette?
75.6% of People are in the Labor Force in Lafayette.
What is the Unemployment Rate in Lafayette?
Unemployment Rate in Lafayette is 3.7%.