Grand Junction, CO Map & Demographics
Grand Junction Map
Grand Junction Overview
$37,017
PER CAPITA INCOME
$83,721
AVG FAMILY INCOME
$62,993
AVG HOUSEHOLD INCOME
25.3%
WAGE / INCOME GAP [ % ]
74.7¢/ $1
WAGE / INCOME GAP [ $ ]
$9,875
FAMILY INCOME DEFICIT
0.45
INEQUALITY / GINI INDEX
65,918
TOTAL POPULATION
33,145
MALE POPULATION
32,773
FEMALE POPULATION
101.14
MALES / 100 FEMALES
98.88
FEMALES / 100 MALES
39.9
MEDIAN AGE
2.9
AVG FAMILY SIZE
2.2
AVG HOUSEHOLD SIZE
33,655
LABOR FORCE [ PEOPLE ]
61.2%
PERCENT IN LABOR FORCE
4.7%
UNEMPLOYMENT RATE
Grand Junction Area Codes
Income in Grand Junction
Income Overview in Grand Junction
Per Capita Income in Grand Junction is $37,017, while median incomes of families and households are $83,721 and $62,993 respectively.
| Characteristic | Number | Measure |
| Per Capita Income | 65,918 | $37,017 |
| Median Family Income | 15,212 | $83,721 |
| Mean Family Income | 15,212 | $104,469 |
| Median Household Income | 28,093 | $62,993 |
| Mean Household Income | 28,093 | $84,266 |
| Income Deficit | 15,212 | $9,875 |
| Wage / Income Gap (%) | 65,918 | 25.29% |
| Wage / Income Gap ($) | 65,918 | 74.71¢ per $1 |
| Gini / Inequality Index | 65,918 | 0.45 |
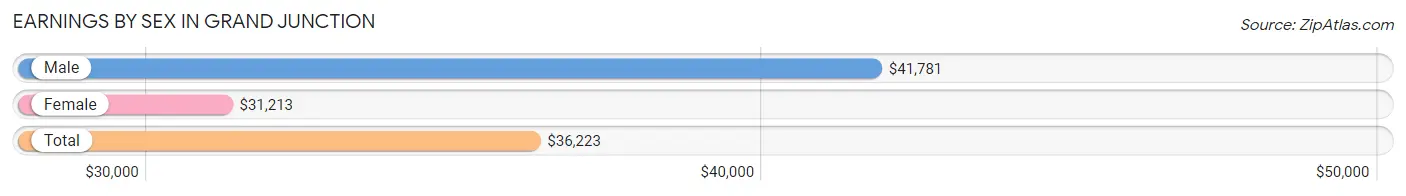
Earnings by Sex in Grand Junction
Average Earnings in Grand Junction are $36,223, $41,781 for men and $31,213 for women, a difference of 25.3%.
| Sex | Number | Average Earnings |
| Male | 19,096 (52.5%) | $41,781 |
| Female | 17,248 (47.5%) | $31,213 |
| Total | 36,344 (100.0%) | $36,223 |
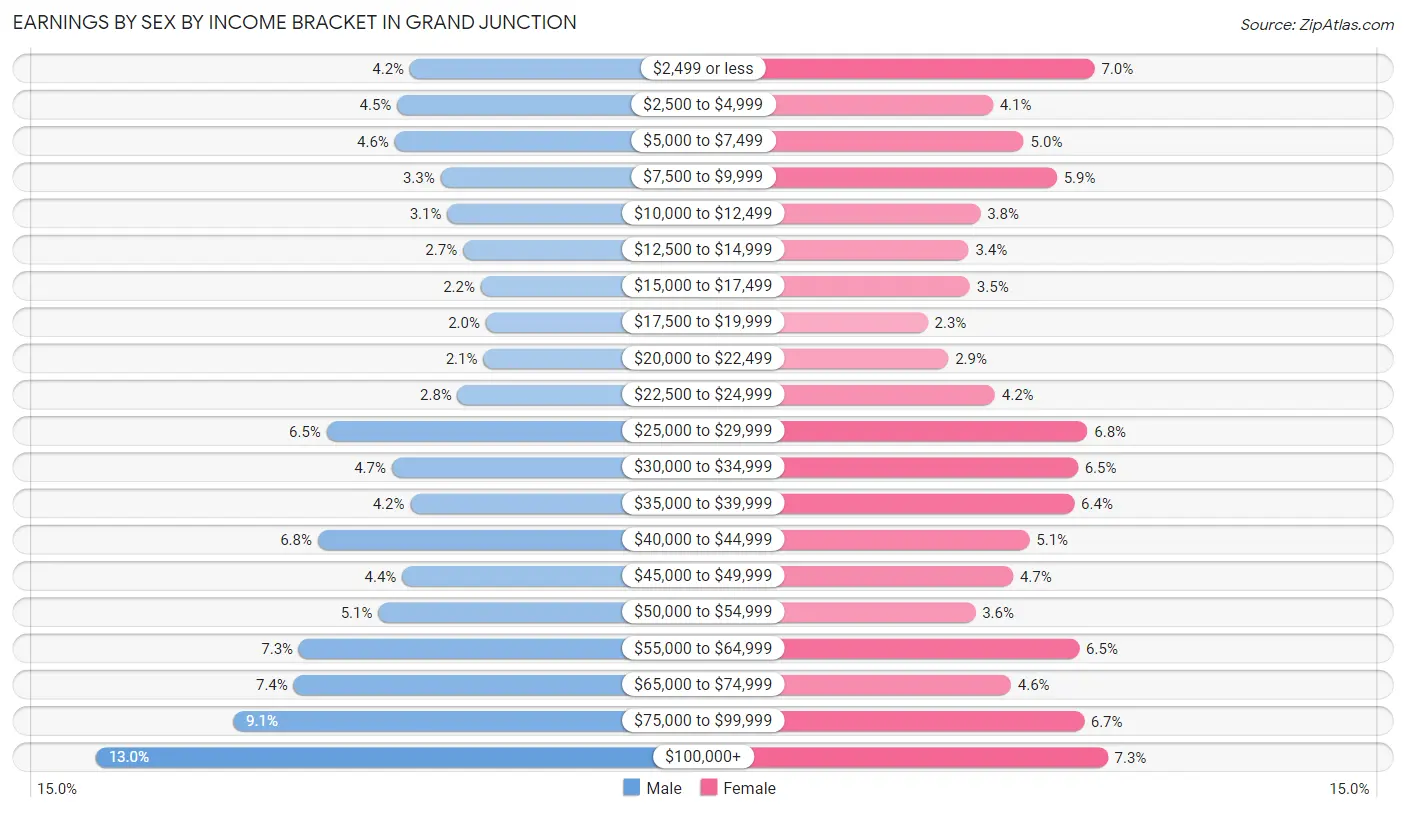
Earnings by Sex by Income Bracket in Grand Junction
The most common earnings brackets in Grand Junction are $100,000+ for men (2,482 | 13.0%) and $100,000+ for women (1,264 | 7.3%).
| Income | Male | Female |
| $2,499 or less | 797 (4.2%) | 1,200 (7.0%) |
| $2,500 to $4,999 | 865 (4.5%) | 707 (4.1%) |
| $5,000 to $7,499 | 879 (4.6%) | 857 (5.0%) |
| $7,500 to $9,999 | 632 (3.3%) | 1,017 (5.9%) |
| $10,000 to $12,499 | 596 (3.1%) | 646 (3.7%) |
| $12,500 to $14,999 | 512 (2.7%) | 590 (3.4%) |
| $15,000 to $17,499 | 416 (2.2%) | 596 (3.5%) |
| $17,500 to $19,999 | 390 (2.0%) | 391 (2.3%) |
| $20,000 to $22,499 | 402 (2.1%) | 492 (2.9%) |
| $22,500 to $24,999 | 540 (2.8%) | 718 (4.2%) |
| $25,000 to $29,999 | 1,244 (6.5%) | 1,166 (6.8%) |
| $30,000 to $34,999 | 894 (4.7%) | 1,120 (6.5%) |
| $35,000 to $39,999 | 794 (4.2%) | 1,102 (6.4%) |
| $40,000 to $44,999 | 1,291 (6.8%) | 884 (5.1%) |
| $45,000 to $49,999 | 839 (4.4%) | 806 (4.7%) |
| $50,000 to $54,999 | 966 (5.1%) | 622 (3.6%) |
| $55,000 to $64,999 | 1,392 (7.3%) | 1,126 (6.5%) |
| $65,000 to $74,999 | 1,420 (7.4%) | 795 (4.6%) |
| $75,000 to $99,999 | 1,745 (9.1%) | 1,149 (6.7%) |
| $100,000+ | 2,482 (13.0%) | 1,264 (7.3%) |
| Total | 19,096 (100.0%) | 17,248 (100.0%) |
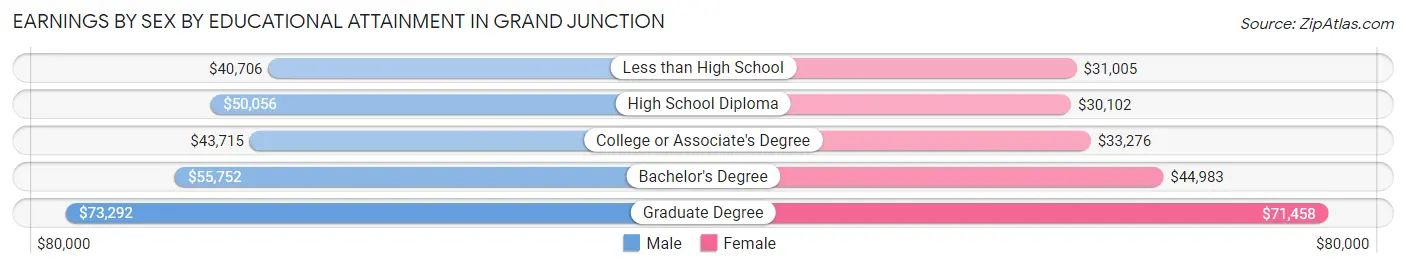
Earnings by Sex by Educational Attainment in Grand Junction
Average earnings in Grand Junction are $48,973 for men and $37,937 for women, a difference of 22.5%. Men with an educational attainment of graduate degree enjoy the highest average annual earnings of $73,292, while those with less than high school education earn the least with $40,706. Women with an educational attainment of graduate degree earn the most with the average annual earnings of $71,458, while those with high school diploma education have the smallest earnings of $30,102.
| Educational Attainment | Male Income | Female Income |
| Less than High School | $40,706 | $31,005 |
| High School Diploma | $50,056 | $30,102 |
| College or Associate's Degree | $43,715 | $33,276 |
| Bachelor's Degree | $55,752 | $44,983 |
| Graduate Degree | $73,292 | $71,458 |
| Total | $48,973 | $37,937 |
Family Income in Grand Junction
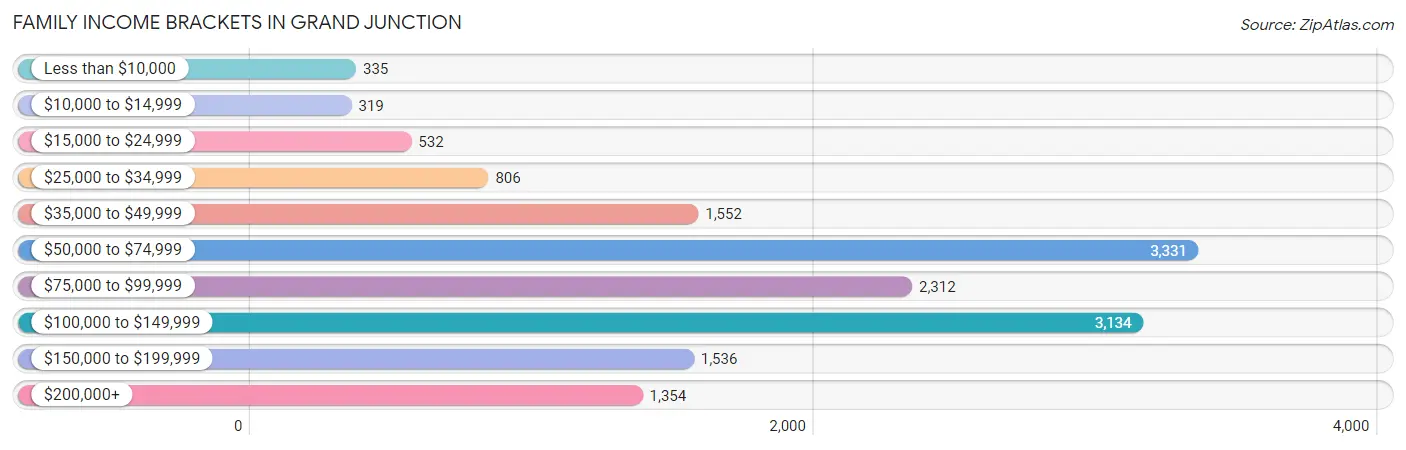
Family Income Brackets in Grand Junction
According to the Grand Junction family income data, there are 3,331 families falling into the $50,000 to $74,999 income range, which is the most common income bracket and makes up 21.9% of all families. Conversely, the $10,000 to $14,999 income bracket is the least frequent group with only 319 families (2.1%) belonging to this category.
| Income Bracket | # Families | % Families |
| Less than $10,000 | 335 | 2.2% |
| $10,000 to $14,999 | 319 | 2.1% |
| $15,000 to $24,999 | 532 | 3.5% |
| $25,000 to $34,999 | 806 | 5.3% |
| $35,000 to $49,999 | 1,552 | 10.2% |
| $50,000 to $74,999 | 3,331 | 21.9% |
| $75,000 to $99,999 | 2,312 | 15.2% |
| $100,000 to $149,999 | 3,134 | 20.6% |
| $150,000 to $199,999 | 1,536 | 10.1% |
| $200,000+ | 1,354 | 8.9% |
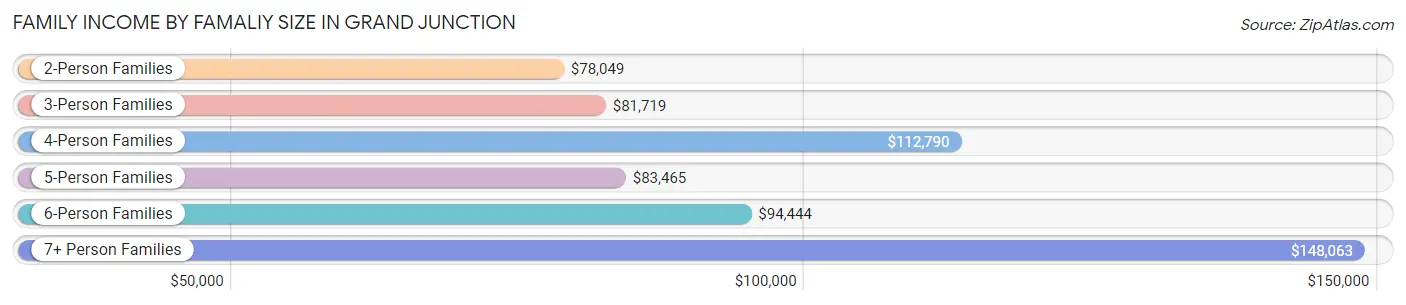
Family Income by Famaliy Size in Grand Junction
7+ person families (139 | 0.9%) account for the highest median family income in Grand Junction with $148,063 per family, while 2-person families (8,069 | 53.0%) have the highest median income of $39,024 per family member.
| Income Bracket | # Families | Median Income |
| 2-Person Families | 8,069 (53.0%) | $78,049 |
| 3-Person Families | 3,287 (21.6%) | $81,719 |
| 4-Person Families | 2,170 (14.3%) | $112,790 |
| 5-Person Families | 1,205 (7.9%) | $83,465 |
| 6-Person Families | 342 (2.2%) | $94,444 |
| 7+ Person Families | 139 (0.9%) | $148,063 |
| Total | 15,212 (100.0%) | $83,721 |
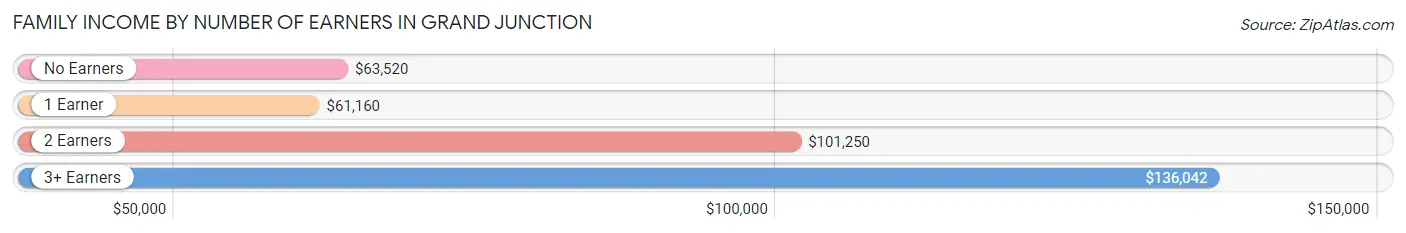
Family Income by Number of Earners in Grand Junction
The median family income in Grand Junction is $83,721, with families comprising 3+ earners (1,444) having the highest median family income of $136,042, while families with 1 earner (4,964) have the lowest median family income of $61,160, accounting for 9.5% and 32.6% of families, respectively.
| Number of Earners | # Families | Median Income |
| No Earners | 2,443 (16.1%) | $63,520 |
| 1 Earner | 4,964 (32.6%) | $61,160 |
| 2 Earners | 6,361 (41.8%) | $101,250 |
| 3+ Earners | 1,444 (9.5%) | $136,042 |
| Total | 15,212 (100.0%) | $83,721 |
Household Income in Grand Junction
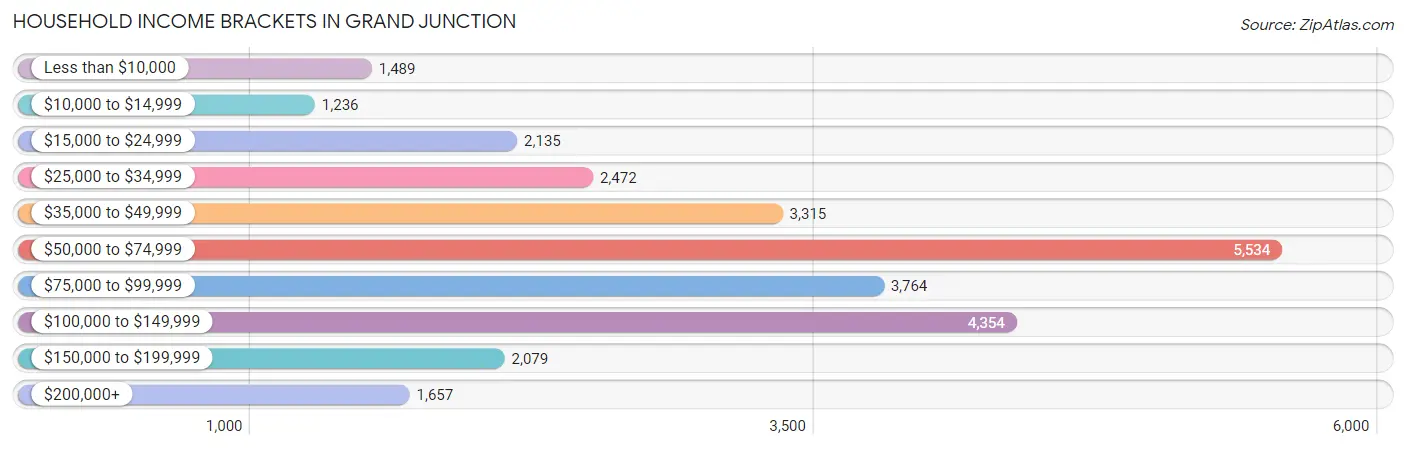
Household Income Brackets in Grand Junction
With 5,534 households falling in the category, the $50,000 to $74,999 income range is the most frequent in Grand Junction, accounting for 19.7% of all households. In contrast, only 1,236 households (4.4%) fall into the $10,000 to $14,999 income bracket, making it the least populous group.
| Income Bracket | # Households | % Households |
| Less than $10,000 | 1,489 | 5.3% |
| $10,000 to $14,999 | 1,236 | 4.4% |
| $15,000 to $24,999 | 2,135 | 7.6% |
| $25,000 to $34,999 | 2,472 | 8.8% |
| $35,000 to $49,999 | 3,315 | 11.8% |
| $50,000 to $74,999 | 5,534 | 19.7% |
| $75,000 to $99,999 | 3,764 | 13.4% |
| $100,000 to $149,999 | 4,354 | 15.5% |
| $150,000 to $199,999 | 2,079 | 7.4% |
| $200,000+ | 1,657 | 5.9% |
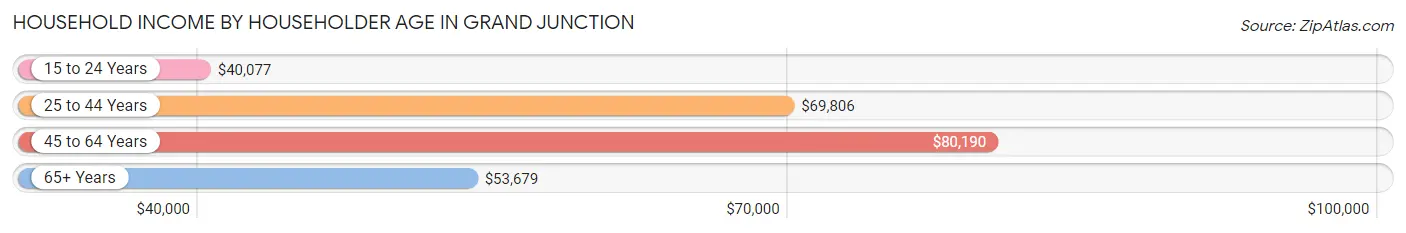
Household Income by Householder Age in Grand Junction
The median household income in Grand Junction is $62,993, with the highest median household income of $80,190 found in the 45 to 64 years age bracket for the primary householder. A total of 8,916 households (31.7%) fall into this category. Meanwhile, the 15 to 24 years age bracket for the primary householder has the lowest median household income of $40,077, with 1,650 households (5.9%) in this group.
| Income Bracket | # Households | Median Income |
| 15 to 24 Years | 1,650 (5.9%) | $40,077 |
| 25 to 44 Years | 8,731 (31.1%) | $69,806 |
| 45 to 64 Years | 8,916 (31.7%) | $80,190 |
| 65+ Years | 8,796 (31.3%) | $53,679 |
| Total | 28,093 (100.0%) | $62,993 |
Poverty in Grand Junction
Income Below Poverty by Sex and Age in Grand Junction
With 11.5% poverty level for males and 13.6% for females among the residents of Grand Junction, 18 to 24 year old males and under 5 year old females are the most vulnerable to poverty, with 901 males (29.4%) and 446 females (24.7%) in their respective age groups living below the poverty level.
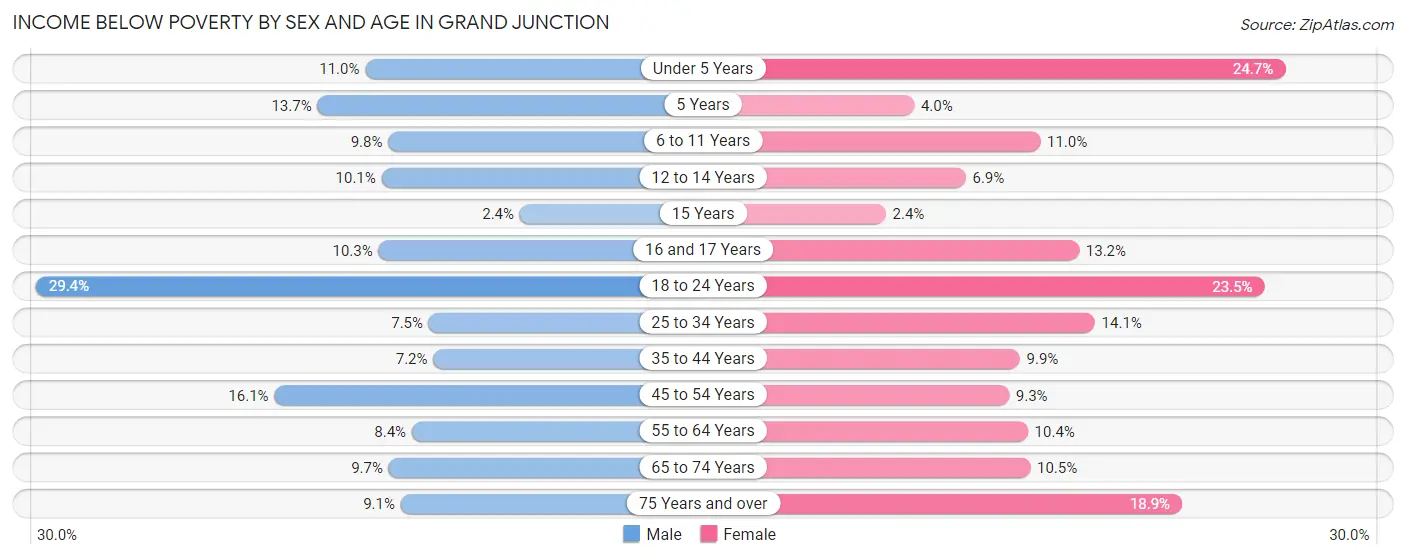
| Age Bracket | Male | Female |
| Under 5 Years | 179 (11.0%) | 446 (24.7%) |
| 5 Years | 36 (13.7%) | 8 (4.0%) |
| 6 to 11 Years | 254 (9.8%) | 228 (11.0%) |
| 12 to 14 Years | 101 (10.1%) | 43 (6.9%) |
| 15 Years | 8 (2.4%) | 6 (2.4%) |
| 16 and 17 Years | 60 (10.3%) | 66 (13.2%) |
| 18 to 24 Years | 901 (29.4%) | 688 (23.5%) |
| 25 to 34 Years | 314 (7.5%) | 638 (14.1%) |
| 35 to 44 Years | 324 (7.2%) | 361 (9.9%) |
| 45 to 54 Years | 569 (16.1%) | 307 (9.3%) |
| 55 to 64 Years | 343 (8.4%) | 454 (10.3%) |
| 65 to 74 Years | 340 (9.7%) | 404 (10.5%) |
| 75 Years and over | 212 (9.0%) | 616 (18.9%) |
| Total | 3,641 (11.5%) | 4,265 (13.6%) |
Income Above Poverty by Sex and Age in Grand Junction
According to the poverty statistics in Grand Junction, males aged 15 years and females aged 15 years are the age groups that are most secure financially, with 97.6% of males and 97.6% of females in these age groups living above the poverty line.
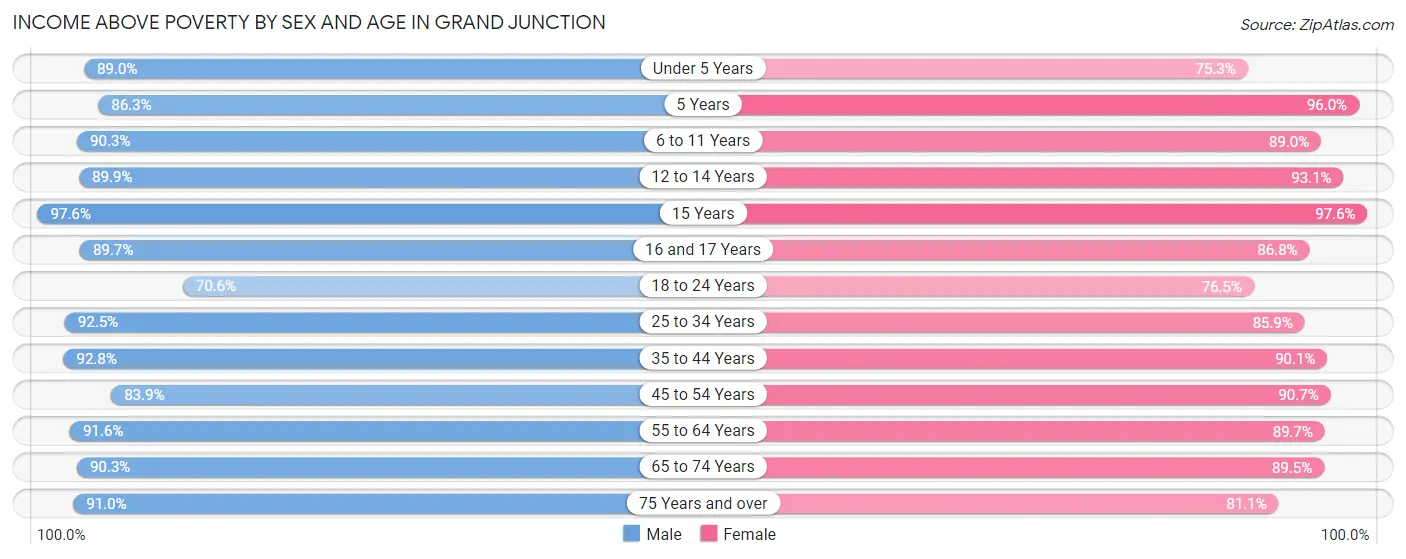
| Age Bracket | Male | Female |
| Under 5 Years | 1,444 (89.0%) | 1,361 (75.3%) |
| 5 Years | 227 (86.3%) | 191 (96.0%) |
| 6 to 11 Years | 2,350 (90.2%) | 1,837 (89.0%) |
| 12 to 14 Years | 897 (89.9%) | 581 (93.1%) |
| 15 Years | 322 (97.6%) | 240 (97.6%) |
| 16 and 17 Years | 523 (89.7%) | 434 (86.8%) |
| 18 to 24 Years | 2,167 (70.6%) | 2,236 (76.5%) |
| 25 to 34 Years | 3,876 (92.5%) | 3,893 (85.9%) |
| 35 to 44 Years | 4,150 (92.8%) | 3,285 (90.1%) |
| 45 to 54 Years | 2,968 (83.9%) | 2,993 (90.7%) |
| 55 to 64 Years | 3,725 (91.6%) | 3,934 (89.6%) |
| 65 to 74 Years | 3,157 (90.3%) | 3,450 (89.5%) |
| 75 Years and over | 2,130 (90.9%) | 2,637 (81.1%) |
| Total | 27,936 (88.5%) | 27,072 (86.4%) |
Income Below Poverty Among Married-Couple Families in Grand Junction
The poverty statistics for married-couple families in Grand Junction show that 3.4% or 394 of the total 11,483 families live below the poverty line. Families with 3 or 4 children have the highest poverty rate of 8.1%, comprising of 78 families. On the other hand, families with 5 or more children have the lowest poverty rate of 0.0%, which includes 0 families.
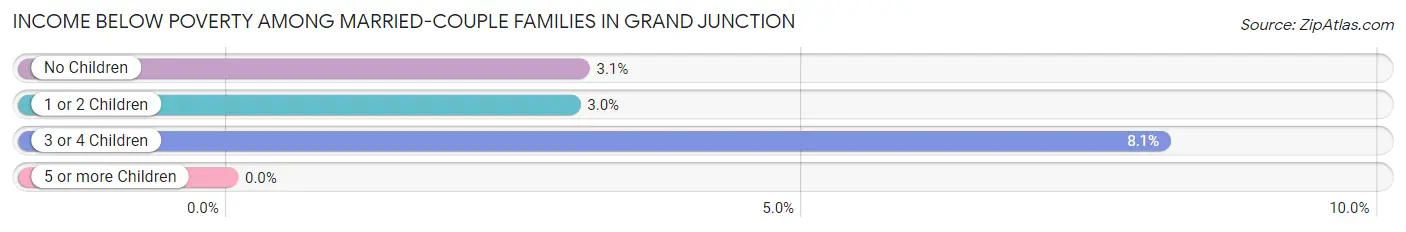
| Children | Above Poverty | Below Poverty |
| No Children | 6,820 (96.9%) | 215 (3.1%) |
| 1 or 2 Children | 3,292 (97.0%) | 101 (3.0%) |
| 3 or 4 Children | 882 (91.9%) | 78 (8.1%) |
| 5 or more Children | 95 (100.0%) | 0 (0.0%) |
| Total | 11,089 (96.6%) | 394 (3.4%) |
Income Below Poverty Among Single-Parent Households in Grand Junction
According to the poverty data in Grand Junction, 8.5% or 97 single-father households and 21.2% or 547 single-mother households are living below the poverty line. Among single-father households, those with 3 or 4 children have the highest poverty rate, with 34 households (65.4%) experiencing poverty. Likewise, among single-mother households, those with 3 or 4 children have the highest poverty rate, with 118 households (57.8%) falling below the poverty line.
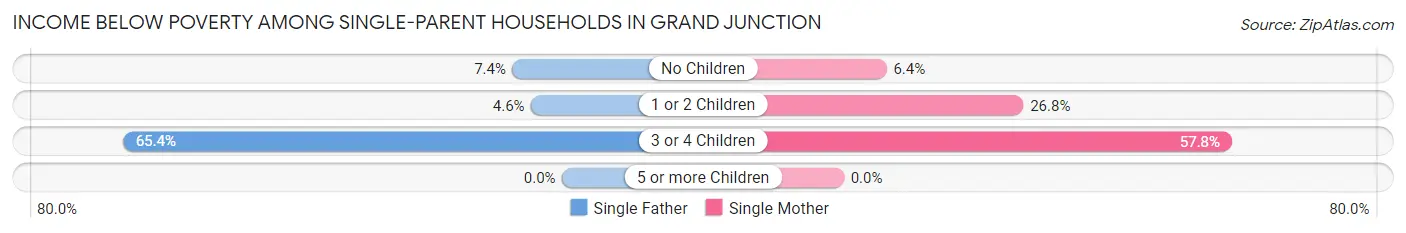
| Children | Single Father | Single Mother |
| No Children | 33 (7.4%) | 65 (6.4%) |
| 1 or 2 Children | 30 (4.6%) | 364 (26.8%) |
| 3 or 4 Children | 34 (65.4%) | 118 (57.8%) |
| 5 or more Children | 0 (0.0%) | 0 (0.0%) |
| Total | 97 (8.5%) | 547 (21.2%) |
Income Below Poverty Among Married-Couple vs Single-Parent Households in Grand Junction
The poverty data for Grand Junction shows that 394 of the married-couple family households (3.4%) and 644 of the single-parent households (17.3%) are living below the poverty level. Within the married-couple family households, those with 3 or 4 children have the highest poverty rate, with 78 households (8.1%) falling below the poverty line. Among the single-parent households, those with 3 or 4 children have the highest poverty rate, with 152 household (59.4%) living below poverty.
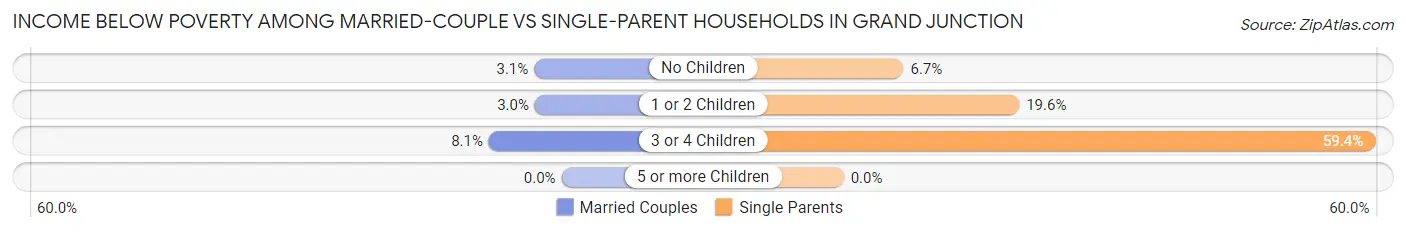
| Children | Married-Couple Families | Single-Parent Households |
| No Children | 215 (3.1%) | 98 (6.7%) |
| 1 or 2 Children | 101 (3.0%) | 394 (19.6%) |
| 3 or 4 Children | 78 (8.1%) | 152 (59.4%) |
| 5 or more Children | 0 (0.0%) | 0 (0.0%) |
| Total | 394 (3.4%) | 644 (17.3%) |
Race in Grand Junction
The most populous races in Grand Junction are White / Caucasian (57,132 | 86.7%), Hispanic or Latino (10,862 | 16.5%), and Two or more Races (5,747 | 8.7%).
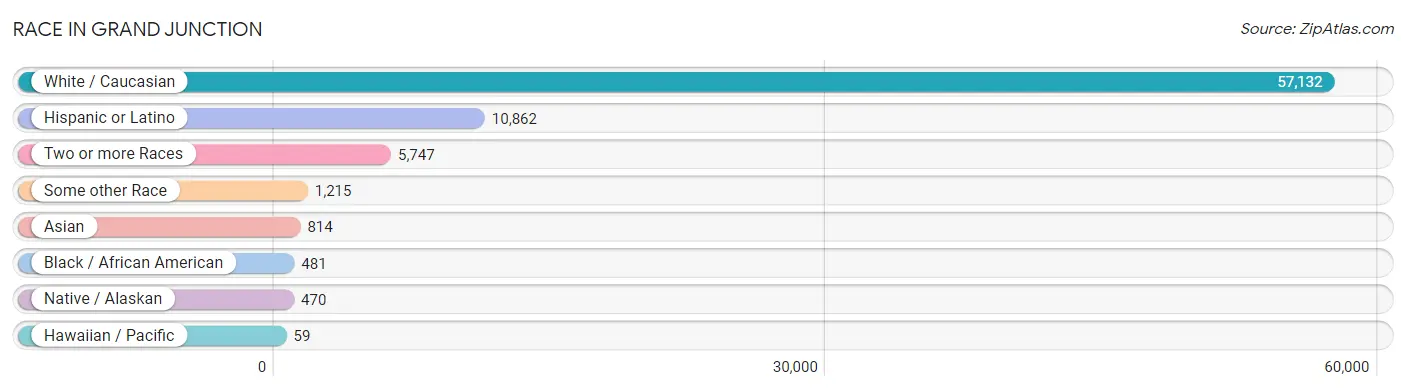
| Race | # Population | % Population |
| Asian | 814 | 1.2% |
| Black / African American | 481 | 0.7% |
| Hawaiian / Pacific | 59 | 0.1% |
| Hispanic or Latino | 10,862 | 16.5% |
| Native / Alaskan | 470 | 0.7% |
| White / Caucasian | 57,132 | 86.7% |
| Two or more Races | 5,747 | 8.7% |
| Some other Race | 1,215 | 1.8% |
| Total | 65,918 | 100.0% |
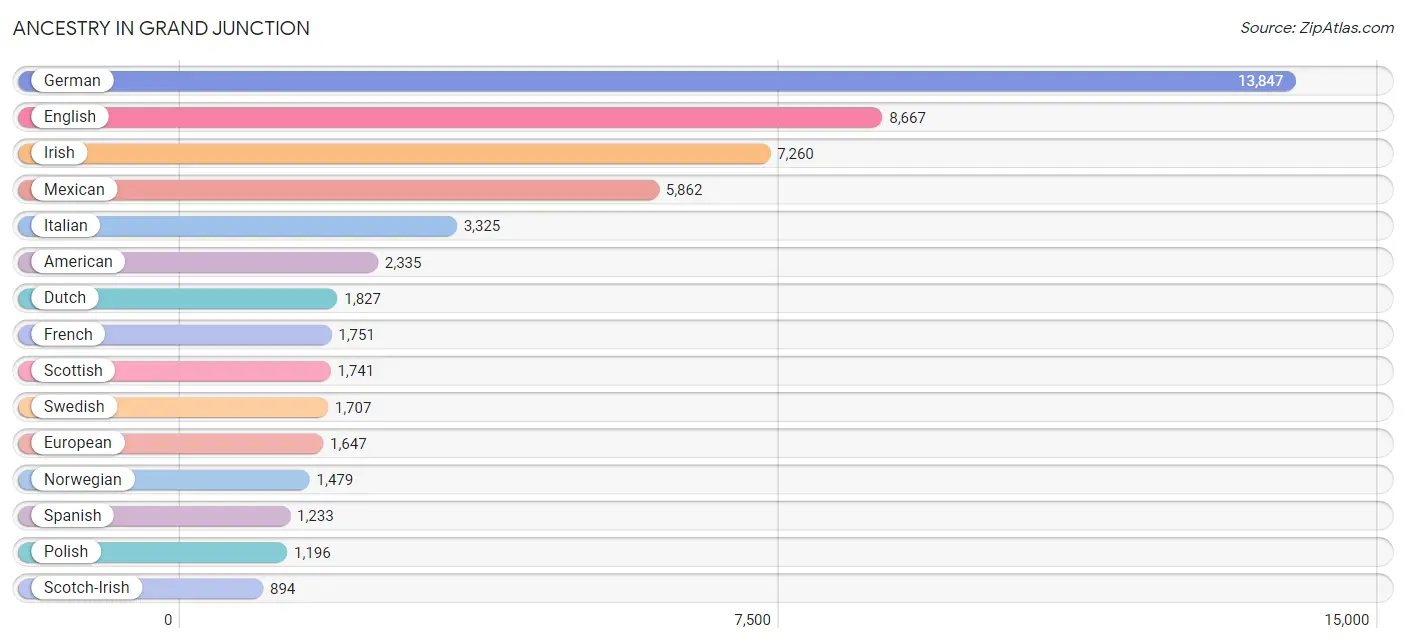
Ancestry in Grand Junction
The most populous ancestries reported in Grand Junction are German (13,847 | 21.0%), English (8,667 | 13.2%), Irish (7,260 | 11.0%), Mexican (5,862 | 8.9%), and Italian (3,325 | 5.0%), together accounting for 59.1% of all Grand Junction residents.
| Ancestry | # Population | % Population |
| Afghan | 10 | 0.0% |
| African | 19 | 0.0% |
| Alaskan Athabascan | 6 | 0.0% |
| Albanian | 18 | 0.0% |
| Aleut | 8 | 0.0% |
| American | 2,335 | 3.5% |
| Apache | 120 | 0.2% |
| Arab | 125 | 0.2% |
| Australian | 54 | 0.1% |
| Austrian | 190 | 0.3% |
| Basque | 92 | 0.1% |
| Belgian | 74 | 0.1% |
| Bhutanese | 322 | 0.5% |
| Blackfeet | 19 | 0.0% |
| Bolivian | 30 | 0.1% |
| Brazilian | 45 | 0.1% |
| British | 523 | 0.8% |
| Bulgarian | 23 | 0.0% |
| Burmese | 155 | 0.2% |
| Canadian | 164 | 0.3% |
| Celtic | 17 | 0.0% |
| Central American | 253 | 0.4% |
| Cherokee | 274 | 0.4% |
| Chickasaw | 19 | 0.0% |
| Chilean | 39 | 0.1% |
| Chippewa | 56 | 0.1% |
| Choctaw | 2 | 0.0% |
| Colombian | 15 | 0.0% |
| Comanche | 12 | 0.0% |
| Costa Rican | 26 | 0.0% |
| Creek | 18 | 0.0% |
| Croatian | 167 | 0.3% |
| Cuban | 134 | 0.2% |
| Czech | 46 | 0.1% |
| Czechoslovakian | 236 | 0.4% |
| Danish | 324 | 0.5% |
| Delaware | 58 | 0.1% |
| Dominican | 8 | 0.0% |
| Dutch | 1,827 | 2.8% |
| Eastern European | 95 | 0.1% |
| Egyptian | 23 | 0.0% |
| English | 8,667 | 13.2% |
| European | 1,647 | 2.5% |
| Filipino | 68 | 0.1% |
| Finnish | 117 | 0.2% |
| French | 1,751 | 2.7% |
| French Canadian | 192 | 0.3% |
| German | 13,847 | 21.0% |
| Ghanaian | 13 | 0.0% |
| Greek | 198 | 0.3% |
| Guamanian / Chamorro | 17 | 0.0% |
| Guatemalan | 27 | 0.0% |
| Hopi | 84 | 0.1% |
| Hungarian | 193 | 0.3% |
| Indian (Asian) | 331 | 0.5% |
| Inupiat | 6 | 0.0% |
| Iranian | 21 | 0.0% |
| Irish | 7,260 | 11.0% |
| Israeli | 9 | 0.0% |
| Italian | 3,325 | 5.0% |
| Japanese | 102 | 0.2% |
| Korean | 555 | 0.8% |
| Latvian | 74 | 0.1% |
| Lebanese | 56 | 0.1% |
| Lithuanian | 174 | 0.3% |
| Luxembourger | 6 | 0.0% |
| Maltese | 45 | 0.1% |
| Mexican | 5,862 | 8.9% |
| Mexican American Indian | 9 | 0.0% |
| Moroccan | 18 | 0.0% |
| Native Hawaiian | 102 | 0.2% |
| Navajo | 22 | 0.0% |
| New Zealander | 5 | 0.0% |
| Nicaraguan | 56 | 0.1% |
| Northern European | 141 | 0.2% |
| Norwegian | 1,479 | 2.2% |
| Paiute | 12 | 0.0% |
| Panamanian | 69 | 0.1% |
| Paraguayan | 34 | 0.1% |
| Pennsylvania German | 20 | 0.0% |
| Polish | 1,196 | 1.8% |
| Portuguese | 139 | 0.2% |
| Potawatomi | 112 | 0.2% |
| Pueblo | 18 | 0.0% |
| Puerto Rican | 401 | 0.6% |
| Romanian | 335 | 0.5% |
| Russian | 339 | 0.5% |
| Salvadoran | 62 | 0.1% |
| Samoan | 11 | 0.0% |
| Scandinavian | 777 | 1.2% |
| Scotch-Irish | 894 | 1.4% |
| Scottish | 1,741 | 2.6% |
| Senegalese | 16 | 0.0% |
| Shoshone | 23 | 0.0% |
| Sioux | 43 | 0.1% |
| Slavic | 8 | 0.0% |
| Slovak | 108 | 0.2% |
| Slovene | 34 | 0.1% |
| South African | 41 | 0.1% |
| South American | 285 | 0.4% |
| Spaniard | 521 | 0.8% |
| Spanish | 1,233 | 1.9% |
| Spanish American | 53 | 0.1% |
| Spanish American Indian | 20 | 0.0% |
| Sri Lankan | 40 | 0.1% |
| Subsaharan African | 113 | 0.2% |
| Swedish | 1,707 | 2.6% |
| Swiss | 336 | 0.5% |
| Syrian | 25 | 0.0% |
| Thai | 8 | 0.0% |
| Tlingit-Haida | 7 | 0.0% |
| Tongan | 11 | 0.0% |
| Ukrainian | 69 | 0.1% |
| Ute | 10 | 0.0% |
| Venezuelan | 167 | 0.3% |
| Welsh | 603 | 0.9% |
| Yaqui | 53 | 0.1% |
| Yugoslavian | 28 | 0.0% | View All 118 Rows |
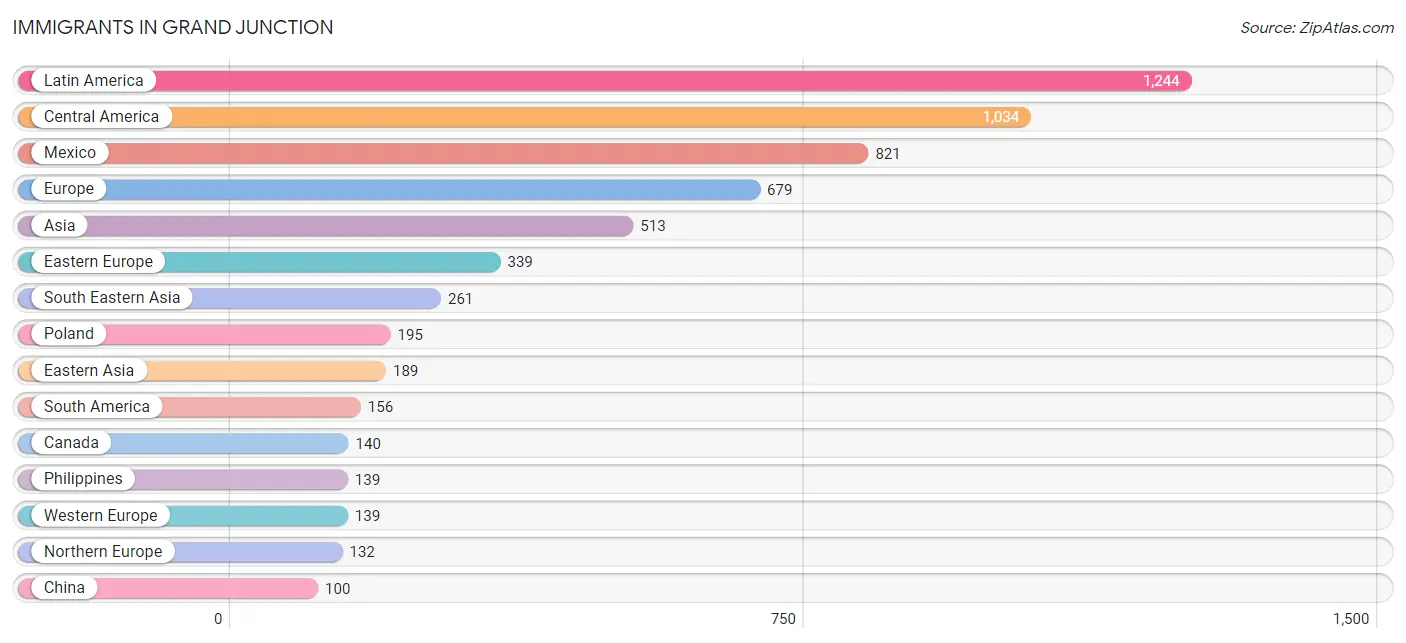
Immigrants in Grand Junction
The most numerous immigrant groups reported in Grand Junction came from Latin America (1,244 | 1.9%), Central America (1,034 | 1.6%), Mexico (821 | 1.3%), Europe (679 | 1.0%), and Asia (513 | 0.8%), together accounting for 6.5% of all Grand Junction residents.
| Immigration Origin | # Population | % Population |
| Afghanistan | 10 | 0.0% |
| Africa | 94 | 0.1% |
| Albania | 13 | 0.0% |
| Asia | 513 | 0.8% |
| Australia | 21 | 0.0% |
| Austria | 11 | 0.0% |
| Azores | 6 | 0.0% |
| Bolivia | 11 | 0.0% |
| Bulgaria | 23 | 0.0% |
| Cambodia | 41 | 0.1% |
| Canada | 140 | 0.2% |
| Caribbean | 54 | 0.1% |
| Central America | 1,034 | 1.6% |
| Chile | 42 | 0.1% |
| China | 100 | 0.2% |
| Colombia | 15 | 0.0% |
| Costa Rica | 15 | 0.0% |
| Cuba | 45 | 0.1% |
| Czechoslovakia | 10 | 0.0% |
| Denmark | 52 | 0.1% |
| Eastern Asia | 189 | 0.3% |
| Eastern Europe | 339 | 0.5% |
| Egypt | 13 | 0.0% |
| El Salvador | 81 | 0.1% |
| England | 72 | 0.1% |
| Europe | 679 | 1.0% |
| Germany | 98 | 0.2% |
| Ghana | 13 | 0.0% |
| Guatemala | 7 | 0.0% |
| Haiti | 9 | 0.0% |
| Honduras | 79 | 0.1% |
| India | 5 | 0.0% |
| Iran | 11 | 0.0% |
| Italy | 56 | 0.1% |
| Japan | 74 | 0.1% |
| Korea | 15 | 0.0% |
| Latin America | 1,244 | 1.9% |
| Latvia | 22 | 0.0% |
| Liberia | 3 | 0.0% |
| Mexico | 821 | 1.3% |
| Micronesia | 39 | 0.1% |
| Middle Africa | 24 | 0.0% |
| Nepal | 22 | 0.0% |
| Netherlands | 13 | 0.0% |
| Nicaragua | 31 | 0.1% |
| Northern Africa | 13 | 0.0% |
| Northern Europe | 132 | 0.2% |
| Oceania | 65 | 0.1% |
| Philippines | 139 | 0.2% |
| Poland | 195 | 0.3% |
| Portugal | 13 | 0.0% |
| Romania | 58 | 0.1% |
| South Africa | 41 | 0.1% |
| South America | 156 | 0.2% |
| South Central Asia | 48 | 0.1% |
| South Eastern Asia | 261 | 0.4% |
| Southern Europe | 69 | 0.1% |
| Switzerland | 17 | 0.0% |
| Syria | 15 | 0.0% |
| Taiwan | 68 | 0.1% |
| Ukraine | 18 | 0.0% |
| Venezuela | 88 | 0.1% |
| Vietnam | 81 | 0.1% |
| Western Africa | 16 | 0.0% |
| Western Asia | 15 | 0.0% |
| Western Europe | 139 | 0.2% |
| Zaire | 24 | 0.0% | View All 67 Rows |
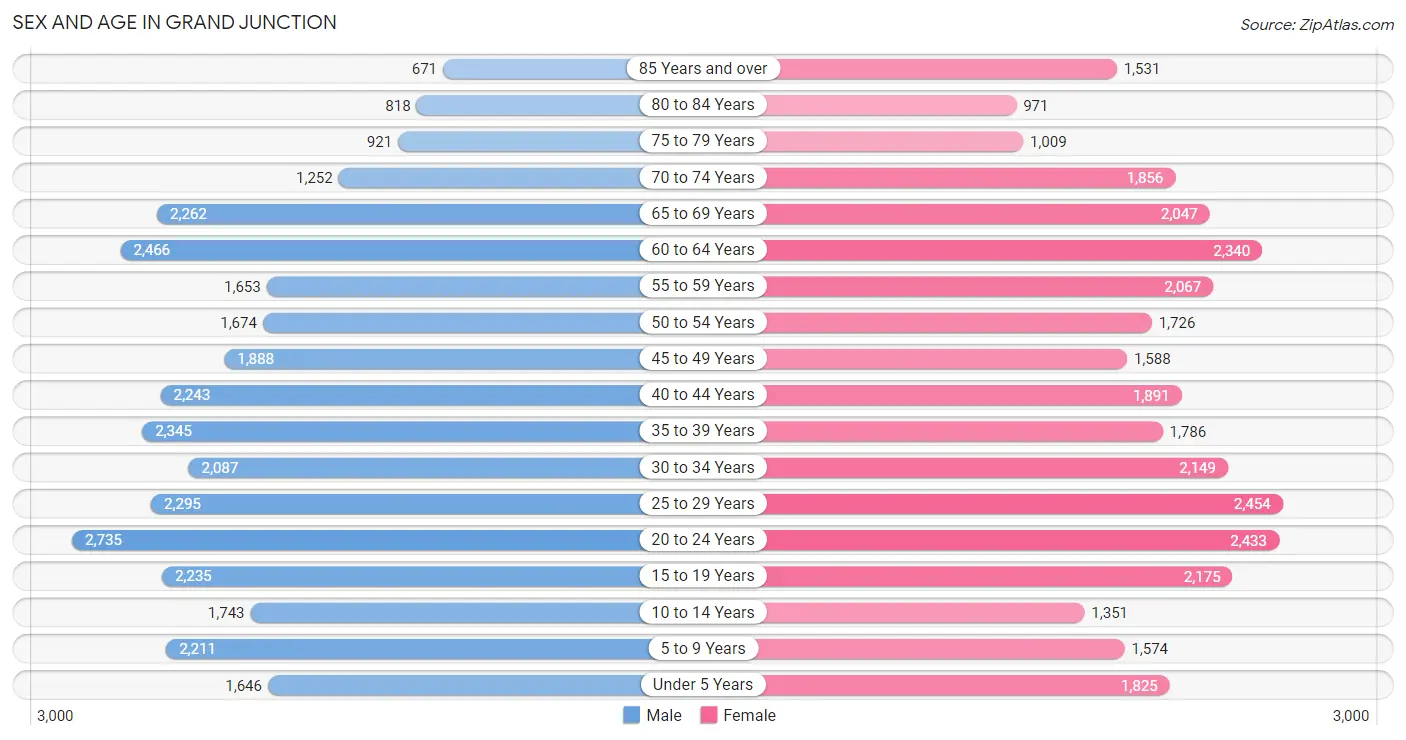
Sex and Age in Grand Junction
Sex and Age in Grand Junction
The most populous age groups in Grand Junction are 20 to 24 Years (2,735 | 8.3%) for men and 25 to 29 Years (2,454 | 7.5%) for women.
| Age Bracket | Male | Female |
| Under 5 Years | 1,646 (5.0%) | 1,825 (5.6%) |
| 5 to 9 Years | 2,211 (6.7%) | 1,574 (4.8%) |
| 10 to 14 Years | 1,743 (5.3%) | 1,351 (4.1%) |
| 15 to 19 Years | 2,235 (6.7%) | 2,175 (6.6%) |
| 20 to 24 Years | 2,735 (8.3%) | 2,433 (7.4%) |
| 25 to 29 Years | 2,295 (6.9%) | 2,454 (7.5%) |
| 30 to 34 Years | 2,087 (6.3%) | 2,149 (6.6%) |
| 35 to 39 Years | 2,345 (7.1%) | 1,786 (5.4%) |
| 40 to 44 Years | 2,243 (6.8%) | 1,891 (5.8%) |
| 45 to 49 Years | 1,888 (5.7%) | 1,588 (4.9%) |
| 50 to 54 Years | 1,674 (5.1%) | 1,726 (5.3%) |
| 55 to 59 Years | 1,653 (5.0%) | 2,067 (6.3%) |
| 60 to 64 Years | 2,466 (7.4%) | 2,340 (7.1%) |
| 65 to 69 Years | 2,262 (6.8%) | 2,047 (6.2%) |
| 70 to 74 Years | 1,252 (3.8%) | 1,856 (5.7%) |
| 75 to 79 Years | 921 (2.8%) | 1,009 (3.1%) |
| 80 to 84 Years | 818 (2.5%) | 971 (3.0%) |
| 85 Years and over | 671 (2.0%) | 1,531 (4.7%) |
| Total | 33,145 (100.0%) | 32,773 (100.0%) |
Families and Households in Grand Junction
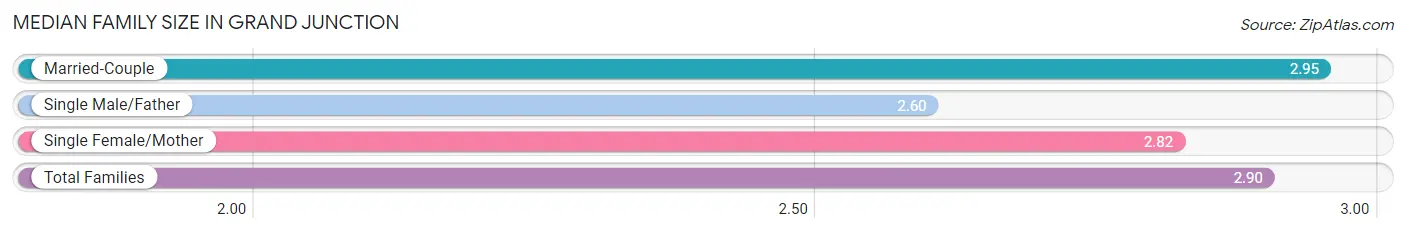
Median Family Size in Grand Junction
The median family size in Grand Junction is 2.90 persons per family, with married-couple families (11,483 | 75.5%) accounting for the largest median family size of 2.95 persons per family. On the other hand, single male/father families (1,146 | 7.5%) represent the smallest median family size with 2.60 persons per family.
| Family Type | # Families | Family Size |
| Married-Couple | 11,483 (75.5%) | 2.95 |
| Single Male/Father | 1,146 (7.5%) | 2.60 |
| Single Female/Mother | 2,583 (17.0%) | 2.82 |
| Total Families | 15,212 (100.0%) | 2.90 |
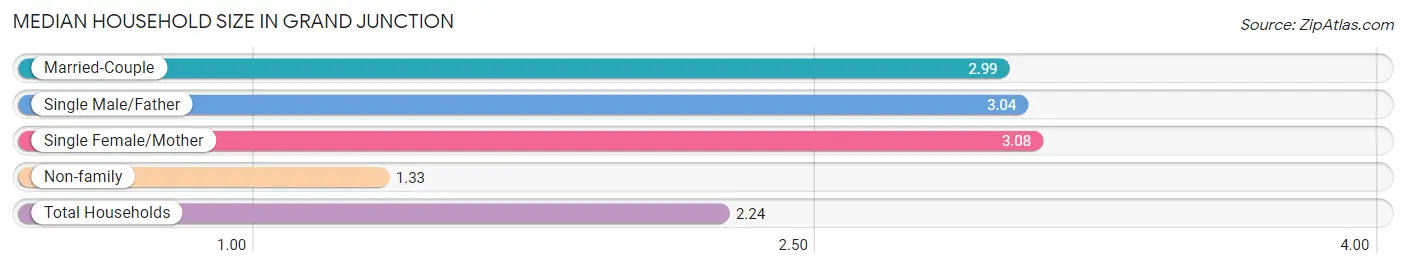
Median Household Size in Grand Junction
The median household size in Grand Junction is 2.24 persons per household, with single female/mother households (2,583 | 9.2%) accounting for the largest median household size of 3.08 persons per household. non-family households (12,881 | 45.9%) represent the smallest median household size with 1.33 persons per household.
| Household Type | # Households | Household Size |
| Married-Couple | 11,483 (40.9%) | 2.99 |
| Single Male/Father | 1,146 (4.1%) | 3.04 |
| Single Female/Mother | 2,583 (9.2%) | 3.08 |
| Non-family | 12,881 (45.9%) | 1.33 |
| Total Households | 28,093 (100.0%) | 2.24 |
Household Size by Marriage Status in Grand Junction
Out of a total of 28,093 households in Grand Junction, 15,212 (54.1%) are family households, while 12,881 (45.9%) are nonfamily households. The most numerous type of family households are 2-person households, comprising 7,613, and the most common type of nonfamily households are 1-person households, comprising 10,099.
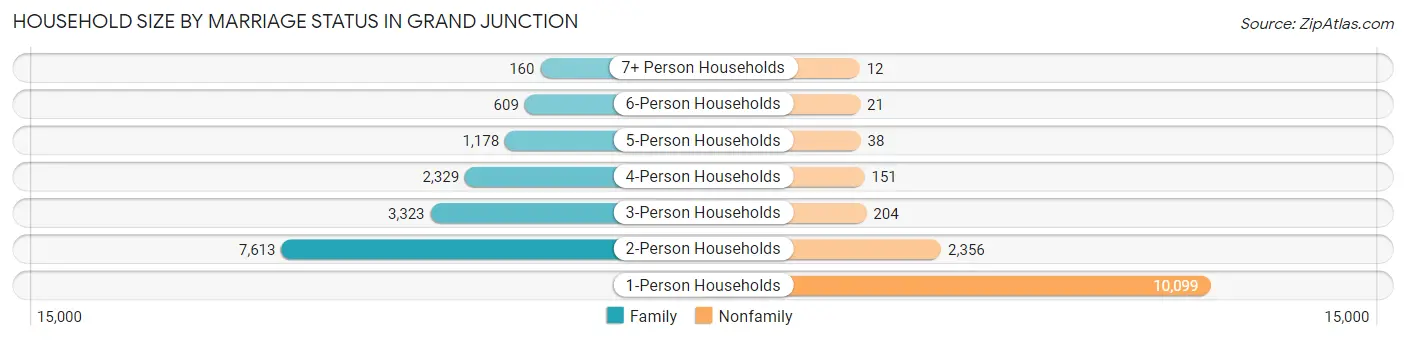
| Household Size | Family Households | Nonfamily Households |
| 1-Person Households | - | 10,099 (35.9%) |
| 2-Person Households | 7,613 (27.1%) | 2,356 (8.4%) |
| 3-Person Households | 3,323 (11.8%) | 204 (0.7%) |
| 4-Person Households | 2,329 (8.3%) | 151 (0.5%) |
| 5-Person Households | 1,178 (4.2%) | 38 (0.1%) |
| 6-Person Households | 609 (2.2%) | 21 (0.1%) |
| 7+ Person Households | 160 (0.6%) | 12 (0.0%) |
| Total | 15,212 (54.1%) | 12,881 (45.9%) |
Female Fertility in Grand Junction
Fertility by Age in Grand Junction
Average fertility rate in Grand Junction is 32.0 births per 1,000 women. Women in the age bracket of 20 to 34 years have the highest fertility rate with 43.0 births per 1,000 women. Women in the age bracket of 20 to 34 years acount for 64.5% of all women with births.
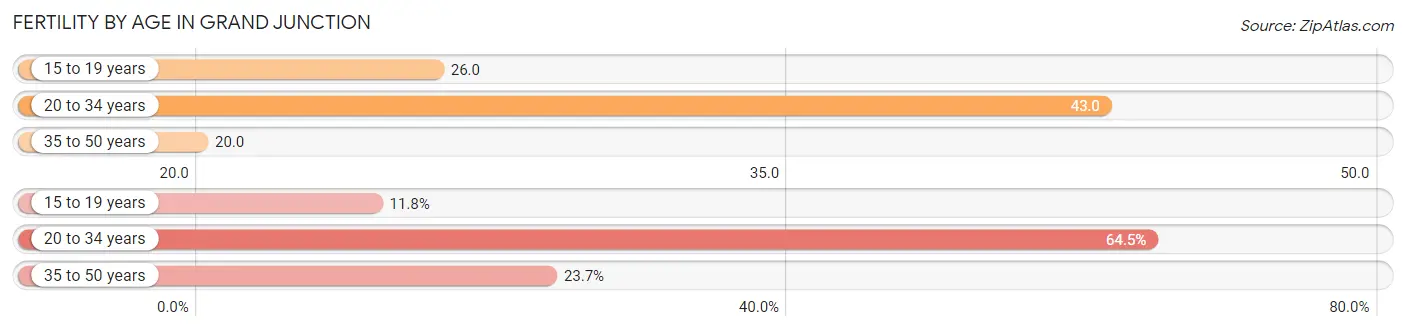
| Age Bracket | Women with Births | Births / 1,000 Women |
| 15 to 19 years | 56 (11.8%) | 26.0 |
| 20 to 34 years | 305 (64.5%) | 43.0 |
| 35 to 50 years | 112 (23.7%) | 20.0 |
| Total | 473 (100.0%) | 32.0 |
Fertility by Age by Marriage Status in Grand Junction
70.8% of women with births (473) in Grand Junction are married. The highest percentage of unmarried women with births falls into 15 to 19 years age bracket with 60.7% of them unmarried at the time of birth, while the lowest percentage of unmarried women with births belong to 35 to 50 years age bracket with 16.1% of them unmarried.
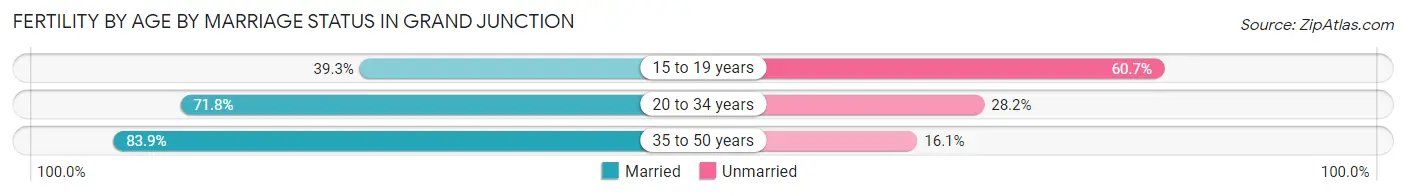
| Age Bracket | Married | Unmarried |
| 15 to 19 years | 22 (39.3%) | 34 (60.7%) |
| 20 to 34 years | 219 (71.8%) | 86 (28.2%) |
| 35 to 50 years | 94 (83.9%) | 18 (16.1%) |
| Total | 335 (70.8%) | 138 (29.2%) |
Fertility by Education in Grand Junction
Average fertility rate in Grand Junction is 32.0 births per 1,000 women. Women with the education attainment of graduate degree have the highest fertility rate of 62.0 births per 1,000 women, while women with the education attainment of college or associate's degree have the lowest fertility at 27.0 births per 1,000 women. Women with the education attainment of college or associate's degree represent 33.0% of all women with births.
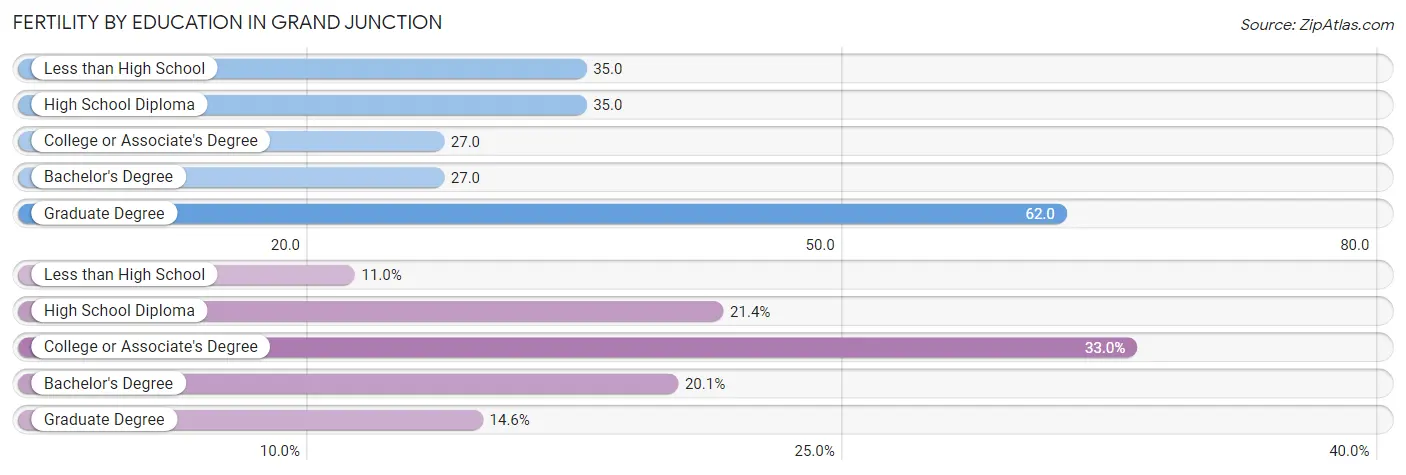
| Educational Attainment | Women with Births | Births / 1,000 Women |
| Less than High School | 52 (11.0%) | 35.0 |
| High School Diploma | 101 (21.3%) | 35.0 |
| College or Associate's Degree | 156 (33.0%) | 27.0 |
| Bachelor's Degree | 95 (20.1%) | 27.0 |
| Graduate Degree | 69 (14.6%) | 62.0 |
| Total | 473 (100.0%) | 32.0 |
Fertility by Education by Marriage Status in Grand Junction
29.2% of women with births in Grand Junction are unmarried. Women with the educational attainment of bachelor's degree are most likely to be married with 100.0% of them married at childbirth, while women with the educational attainment of college or associate's degree are least likely to be married with 62.8% of them unmarried at childbirth.
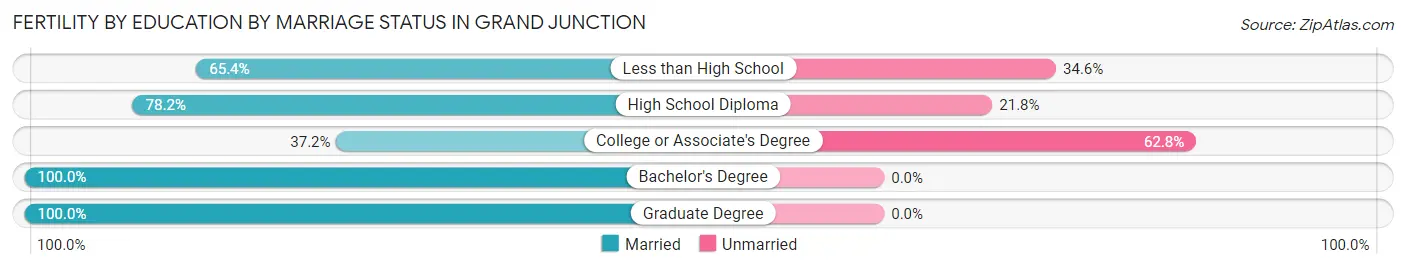
| Educational Attainment | Married | Unmarried |
| Less than High School | 34 (65.4%) | 18 (34.6%) |
| High School Diploma | 79 (78.2%) | 22 (21.8%) |
| College or Associate's Degree | 58 (37.2%) | 98 (62.8%) |
| Bachelor's Degree | 95 (100.0%) | 0 (0.0%) |
| Graduate Degree | 69 (100.0%) | 0 (0.0%) |
| Total | 335 (70.8%) | 138 (29.2%) |
Employment Characteristics in Grand Junction
Employment by Class of Employer in Grand Junction
Among the 31,358 employed individuals in Grand Junction, private company employees (20,120 | 64.2%), not-for-profit organizations (3,125 | 10.0%), and self-employed (not incorporated) (2,035 | 6.5%) make up the most common classes of employment.
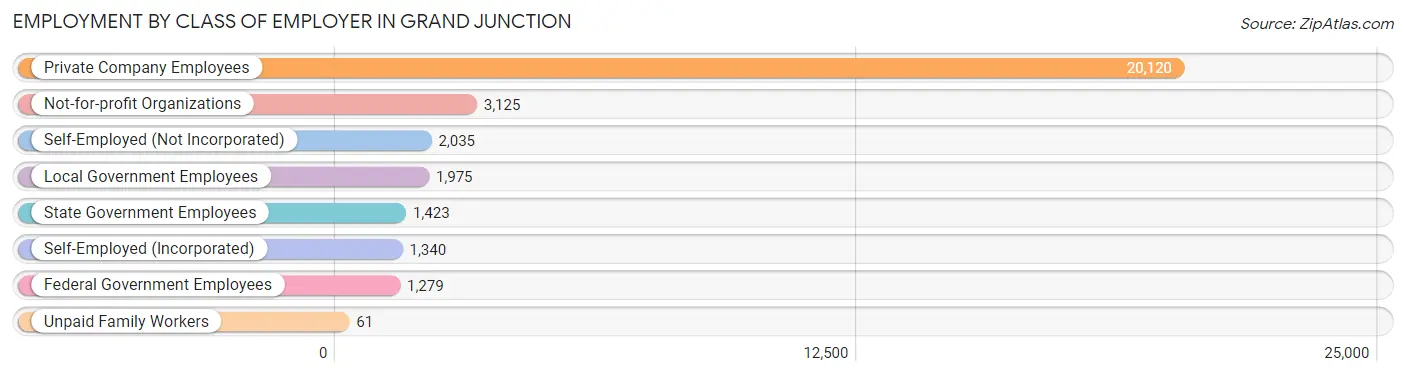
| Employer Class | # Employees | % Employees |
| Private Company Employees | 20,120 | 64.2% |
| Self-Employed (Incorporated) | 1,340 | 4.3% |
| Self-Employed (Not Incorporated) | 2,035 | 6.5% |
| Not-for-profit Organizations | 3,125 | 10.0% |
| Local Government Employees | 1,975 | 6.3% |
| State Government Employees | 1,423 | 4.5% |
| Federal Government Employees | 1,279 | 4.1% |
| Unpaid Family Workers | 61 | 0.2% |
| Total | 31,358 | 100.0% |
Employment Status by Age in Grand Junction
According to the labor force statistics for Grand Junction, out of the total population over 16 years of age (54,992), 61.2% or 33,655 individuals are in the labor force, with 4.7% or 1,582 of them unemployed. The age group with the highest labor force participation rate is 30 to 34 years, with 88.1% or 3,732 individuals in the labor force. Within the labor force, the 16 to 19 years age range has the highest percentage of unemployed individuals, with 21.3% or 451 of them being unemployed.
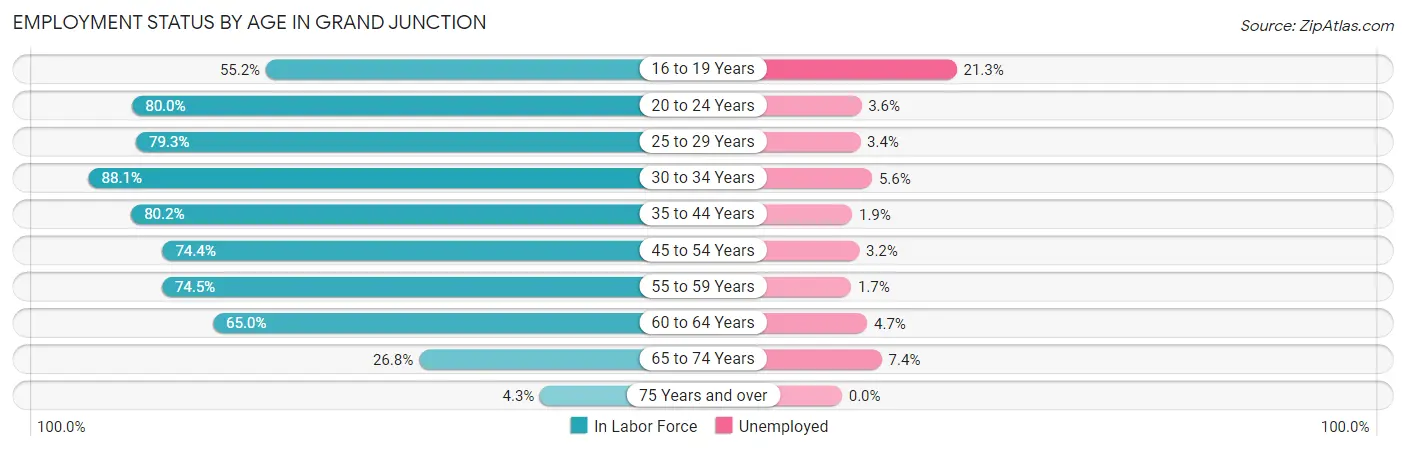
| Age Bracket | In Labor Force | Unemployed |
| 16 to 19 Years | 2,116 (55.2%) | 451 (21.3%) |
| 20 to 24 Years | 4,134 (80.0%) | 149 (3.6%) |
| 25 to 29 Years | 3,766 (79.3%) | 128 (3.4%) |
| 30 to 34 Years | 3,732 (88.1%) | 209 (5.6%) |
| 35 to 44 Years | 6,629 (80.2%) | 126 (1.9%) |
| 45 to 54 Years | 5,116 (74.4%) | 164 (3.2%) |
| 55 to 59 Years | 2,771 (74.5%) | 47 (1.7%) |
| 60 to 64 Years | 3,124 (65.0%) | 147 (4.7%) |
| 65 to 74 Years | 1,988 (26.8%) | 147 (7.4%) |
| 75 Years and over | 255 (4.3%) | 0 (0.0%) |
| Total | 33,655 (61.2%) | 1,582 (4.7%) |
Employment Status by Educational Attainment in Grand Junction
According to labor force statistics for Grand Junction, 77.0% of individuals (25,142) out of the total population between 25 and 64 years of age (32,652) are in the labor force, with 3.3% or 830 of them being unemployed. The group with the highest labor force participation rate are those with the educational attainment of bachelor's degree or higher, with 86.3% or 9,764 individuals in the labor force. Within the labor force, individuals with less than high school education have the highest percentage of unemployment, with 6.0% or 107 of them being unemployed.
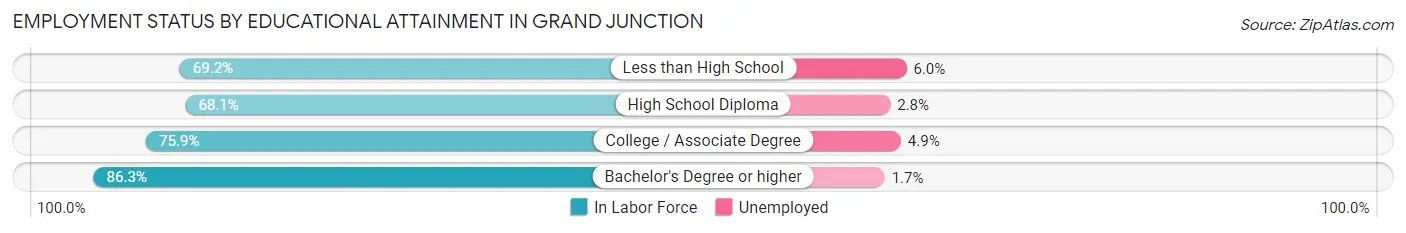
| Educational Attainment | In Labor Force | Unemployed |
| Less than High School | 1,788 (69.2%) | 155 (6.0%) |
| High School Diploma | 5,626 (68.1%) | 231 (2.8%) |
| College / Associate Degree | 7,963 (75.9%) | 514 (4.9%) |
| Bachelor's Degree or higher | 9,764 (86.3%) | 192 (1.7%) |
| Total | 25,142 (77.0%) | 1,078 (3.3%) |
Employment Occupations by Sex in Grand Junction
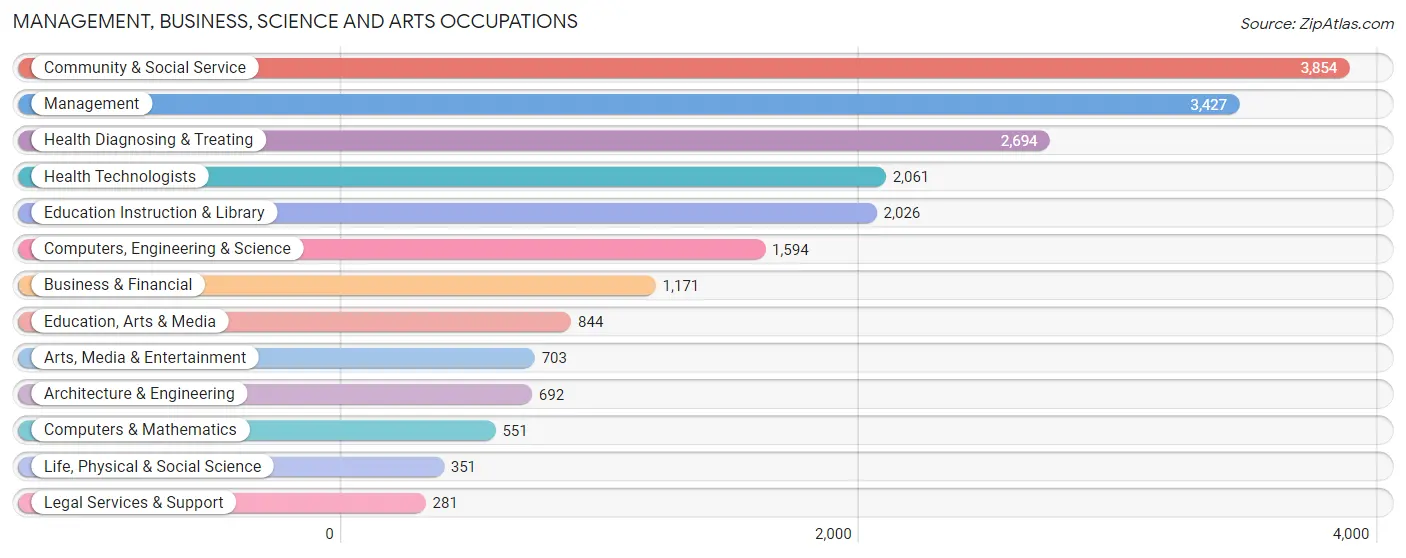
Management, Business, Science and Arts Occupations
The most common Management, Business, Science and Arts occupations in Grand Junction are Community & Social Service (3,854 | 12.0%), Management (3,427 | 10.7%), Health Diagnosing & Treating (2,694 | 8.4%), Health Technologists (2,061 | 6.4%), and Education Instruction & Library (2,026 | 6.3%).
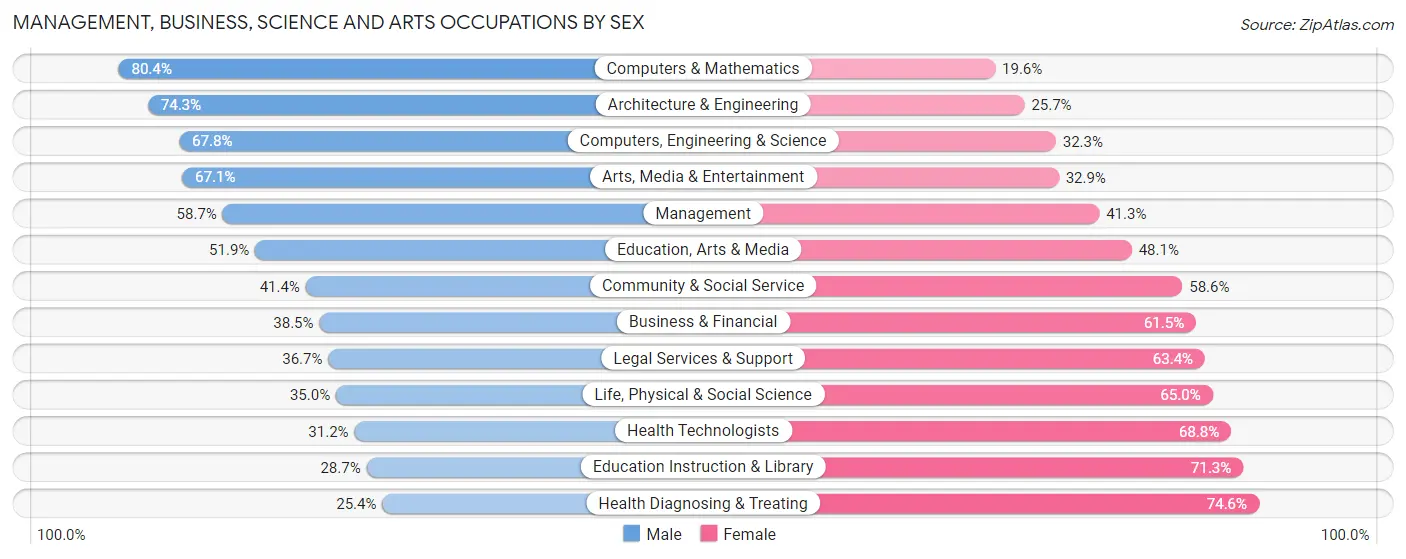
Management, Business, Science and Arts Occupations by Sex
Within the Management, Business, Science and Arts occupations in Grand Junction, the most male-oriented occupations are Computers & Mathematics (80.4%), Architecture & Engineering (74.3%), and Computers, Engineering & Science (67.7%), while the most female-oriented occupations are Health Diagnosing & Treating (74.6%), Education Instruction & Library (71.3%), and Health Technologists (68.8%).
| Occupation | Male | Female |
| Management | 2,011 (58.7%) | 1,416 (41.3%) |
| Business & Financial | 451 (38.5%) | 720 (61.5%) |
| Computers, Engineering & Science | 1,080 (67.7%) | 514 (32.3%) |
| Computers & Mathematics | 443 (80.4%) | 108 (19.6%) |
| Architecture & Engineering | 514 (74.3%) | 178 (25.7%) |
| Life, Physical & Social Science | 123 (35.0%) | 228 (65.0%) |
| Community & Social Service | 1,594 (41.4%) | 2,260 (58.6%) |
| Education, Arts & Media | 438 (51.9%) | 406 (48.1%) |
| Legal Services & Support | 103 (36.6%) | 178 (63.3%) |
| Education Instruction & Library | 581 (28.7%) | 1,445 (71.3%) |
| Arts, Media & Entertainment | 472 (67.1%) | 231 (32.9%) |
| Health Diagnosing & Treating | 684 (25.4%) | 2,010 (74.6%) |
| Health Technologists | 643 (31.2%) | 1,418 (68.8%) |
| Total (Category) | 5,820 (45.7%) | 6,920 (54.3%) |
| Total (Overall) | 16,861 (52.7%) | 15,160 (47.3%) |
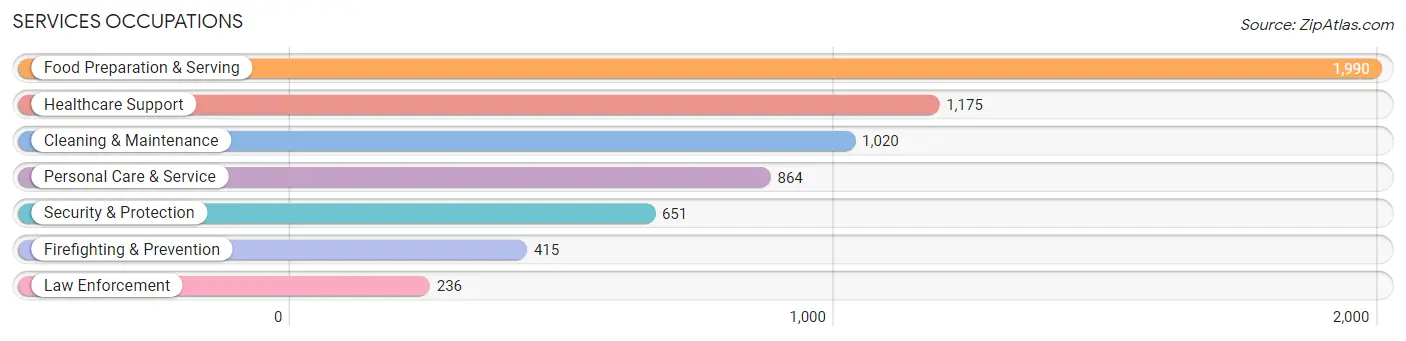
Services Occupations
The most common Services occupations in Grand Junction are Food Preparation & Serving (1,990 | 6.2%), Healthcare Support (1,175 | 3.7%), Cleaning & Maintenance (1,020 | 3.2%), Personal Care & Service (864 | 2.7%), and Security & Protection (651 | 2.0%).
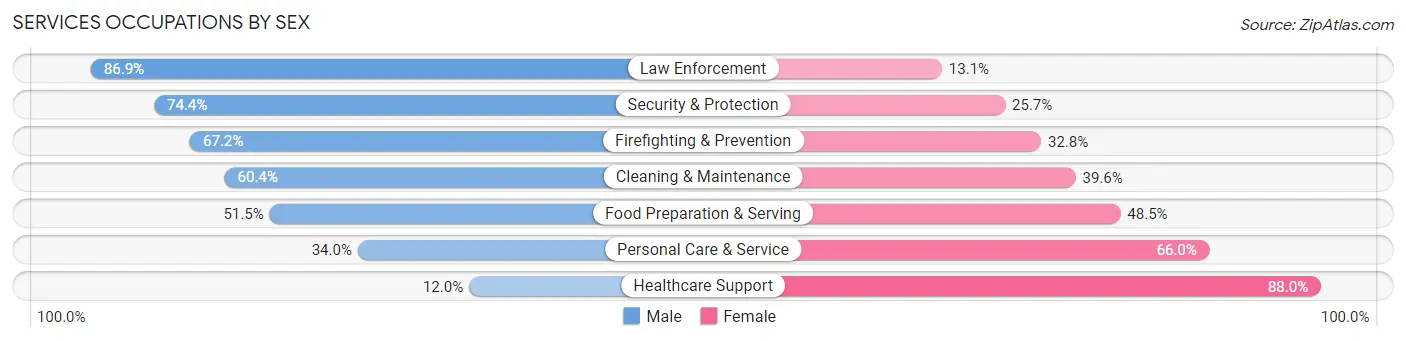
Services Occupations by Sex
Within the Services occupations in Grand Junction, the most male-oriented occupations are Law Enforcement (86.9%), Security & Protection (74.4%), and Firefighting & Prevention (67.2%), while the most female-oriented occupations are Healthcare Support (88.0%), Personal Care & Service (66.0%), and Food Preparation & Serving (48.5%).
| Occupation | Male | Female |
| Healthcare Support | 141 (12.0%) | 1,034 (88.0%) |
| Security & Protection | 484 (74.4%) | 167 (25.7%) |
| Firefighting & Prevention | 279 (67.2%) | 136 (32.8%) |
| Law Enforcement | 205 (86.9%) | 31 (13.1%) |
| Food Preparation & Serving | 1,025 (51.5%) | 965 (48.5%) |
| Cleaning & Maintenance | 616 (60.4%) | 404 (39.6%) |
| Personal Care & Service | 294 (34.0%) | 570 (66.0%) |
| Total (Category) | 2,560 (44.9%) | 3,140 (55.1%) |
| Total (Overall) | 16,861 (52.7%) | 15,160 (47.3%) |
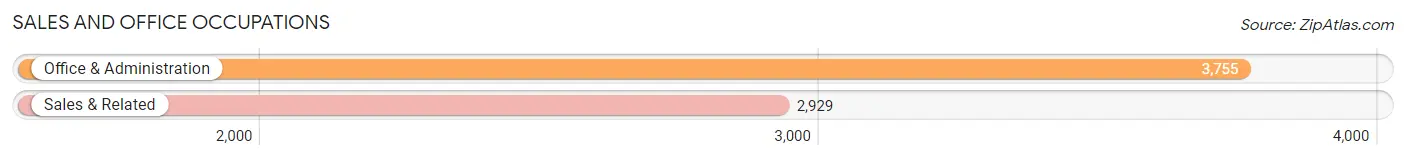
Sales and Office Occupations
The most common Sales and Office occupations in Grand Junction are Office & Administration (3,755 | 11.7%), and Sales & Related (2,929 | 9.1%).
Sales and Office Occupations by Sex
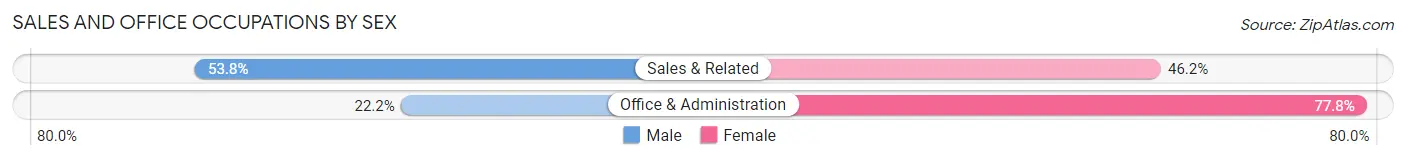
| Occupation | Male | Female |
| Sales & Related | 1,575 (53.8%) | 1,354 (46.2%) |
| Office & Administration | 832 (22.2%) | 2,923 (77.8%) |
| Total (Category) | 2,407 (36.0%) | 4,277 (64.0%) |
| Total (Overall) | 16,861 (52.7%) | 15,160 (47.3%) |
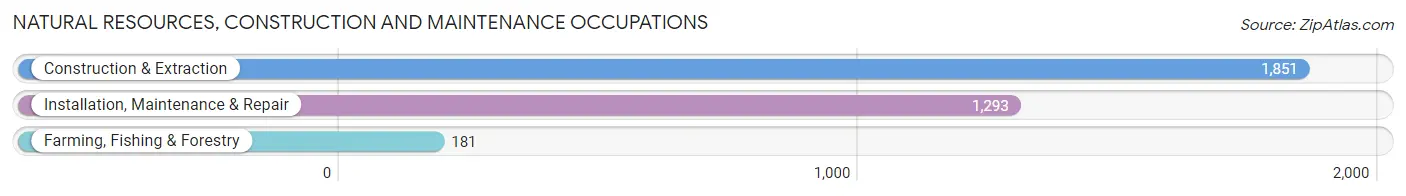
Natural Resources, Construction and Maintenance Occupations
The most common Natural Resources, Construction and Maintenance occupations in Grand Junction are Construction & Extraction (1,851 | 5.8%), Installation, Maintenance & Repair (1,293 | 4.0%), and Farming, Fishing & Forestry (181 | 0.6%).
Natural Resources, Construction and Maintenance Occupations by Sex
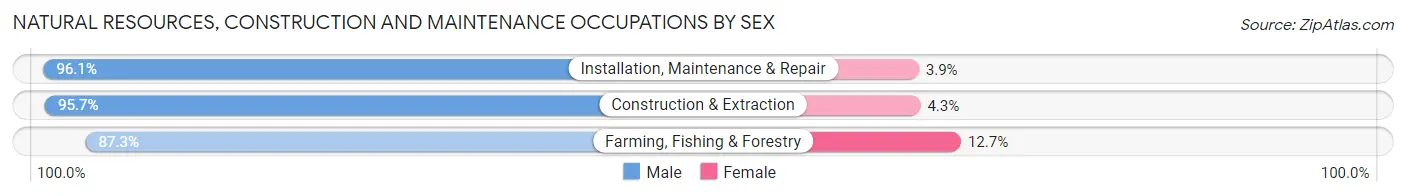
| Occupation | Male | Female |
| Farming, Fishing & Forestry | 158 (87.3%) | 23 (12.7%) |
| Construction & Extraction | 1,772 (95.7%) | 79 (4.3%) |
| Installation, Maintenance & Repair | 1,242 (96.1%) | 51 (3.9%) |
| Total (Category) | 3,172 (95.4%) | 153 (4.6%) |
| Total (Overall) | 16,861 (52.7%) | 15,160 (47.3%) |
Production, Transportation and Moving Occupations
The most common Production, Transportation and Moving occupations in Grand Junction are Production (1,304 | 4.1%), Transportation (1,272 | 4.0%), and Material Moving (996 | 3.1%).
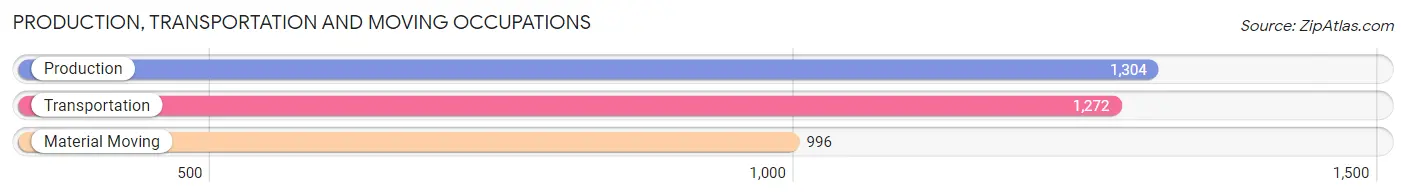
Production, Transportation and Moving Occupations by Sex
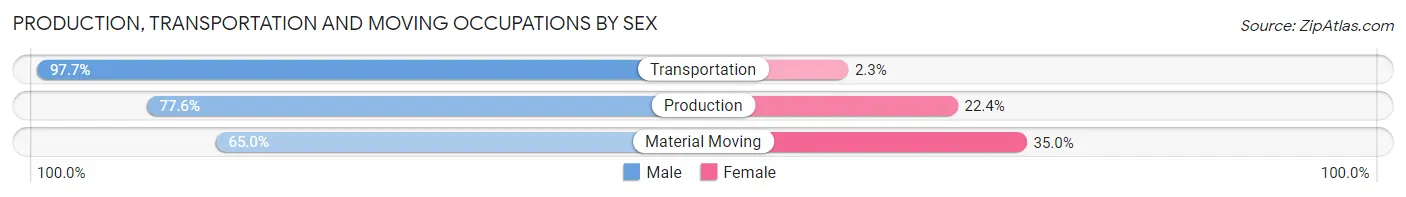
| Occupation | Male | Female |
| Production | 1,012 (77.6%) | 292 (22.4%) |
| Transportation | 1,243 (97.7%) | 29 (2.3%) |
| Material Moving | 647 (65.0%) | 349 (35.0%) |
| Total (Category) | 2,902 (81.2%) | 670 (18.8%) |
| Total (Overall) | 16,861 (52.7%) | 15,160 (47.3%) |
Employment Industries by Sex in Grand Junction
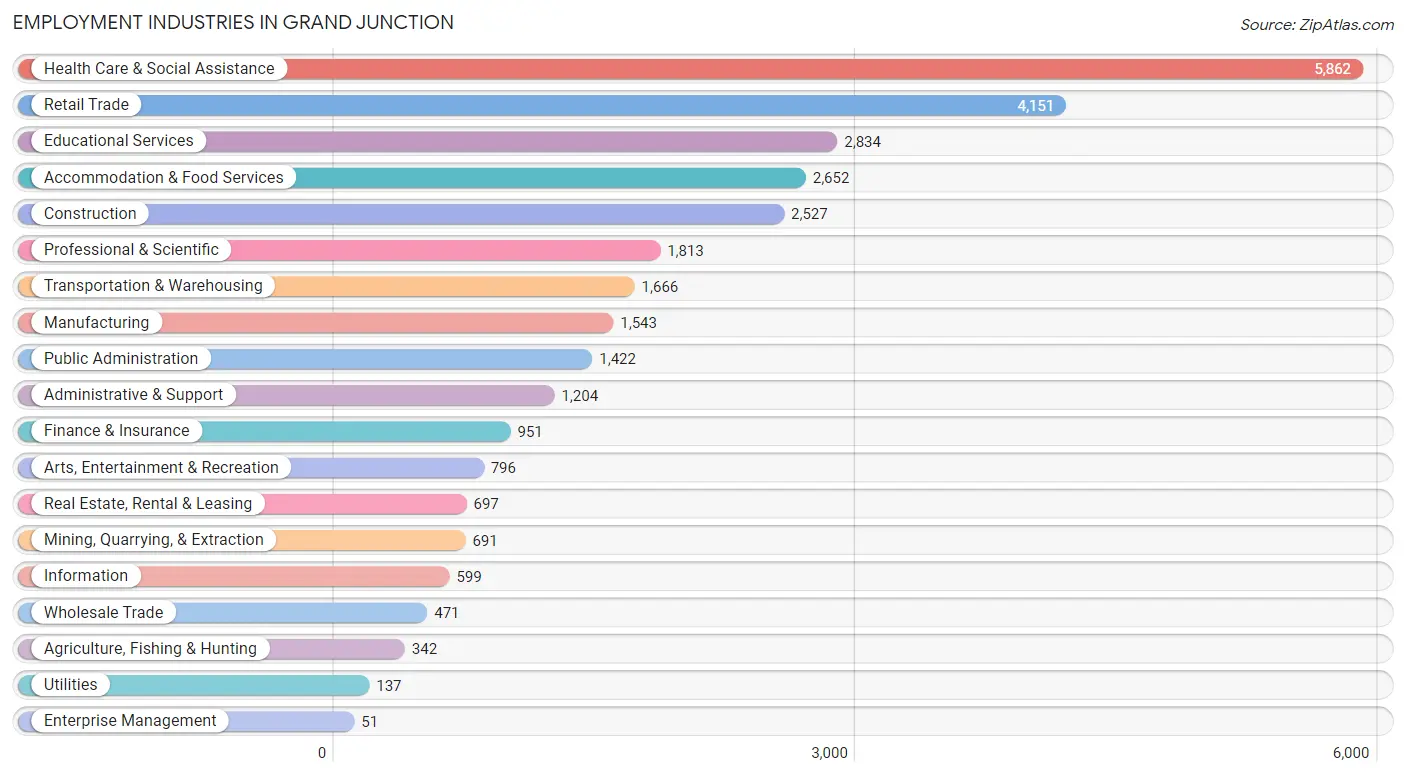
Employment Industries in Grand Junction
The major employment industries in Grand Junction include Health Care & Social Assistance (5,862 | 18.3%), Retail Trade (4,151 | 13.0%), Educational Services (2,834 | 8.8%), Accommodation & Food Services (2,652 | 8.3%), and Construction (2,527 | 7.9%).
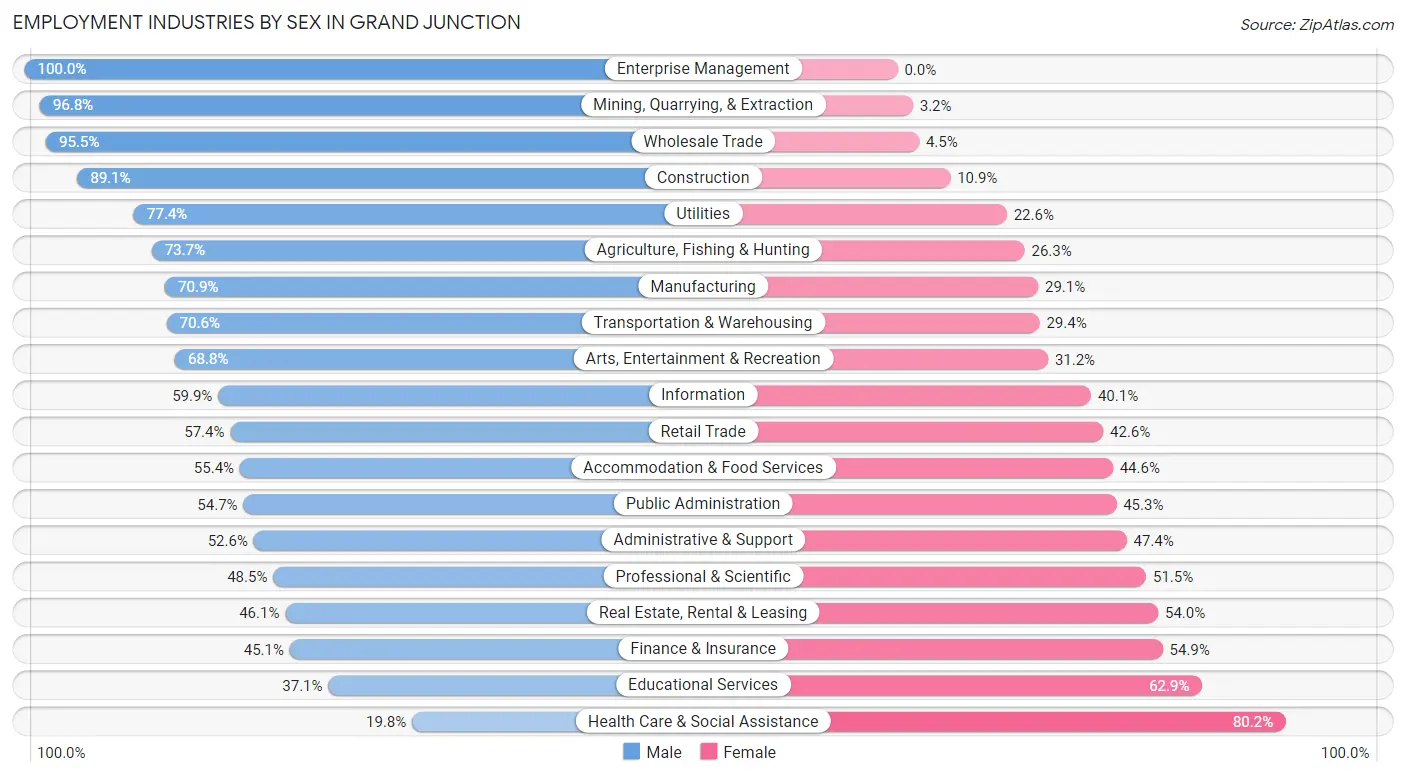
Employment Industries by Sex in Grand Junction
The Grand Junction industries that see more men than women are Enterprise Management (100.0%), Mining, Quarrying, & Extraction (96.8%), and Wholesale Trade (95.5%), whereas the industries that tend to have a higher number of women are Health Care & Social Assistance (80.2%), Educational Services (62.9%), and Finance & Insurance (54.9%).
| Industry | Male | Female |
| Agriculture, Fishing & Hunting | 252 (73.7%) | 90 (26.3%) |
| Mining, Quarrying, & Extraction | 669 (96.8%) | 22 (3.2%) |
| Construction | 2,251 (89.1%) | 276 (10.9%) |
| Manufacturing | 1,094 (70.9%) | 449 (29.1%) |
| Wholesale Trade | 450 (95.5%) | 21 (4.5%) |
| Retail Trade | 2,384 (57.4%) | 1,767 (42.6%) |
| Transportation & Warehousing | 1,176 (70.6%) | 490 (29.4%) |
| Utilities | 106 (77.4%) | 31 (22.6%) |
| Information | 359 (59.9%) | 240 (40.1%) |
| Finance & Insurance | 429 (45.1%) | 522 (54.9%) |
| Real Estate, Rental & Leasing | 321 (46.1%) | 376 (53.9%) |
| Professional & Scientific | 880 (48.5%) | 933 (51.5%) |
| Enterprise Management | 51 (100.0%) | 0 (0.0%) |
| Administrative & Support | 633 (52.6%) | 571 (47.4%) |
| Educational Services | 1,052 (37.1%) | 1,782 (62.9%) |
| Health Care & Social Assistance | 1,160 (19.8%) | 4,702 (80.2%) |
| Arts, Entertainment & Recreation | 548 (68.8%) | 248 (31.2%) |
| Accommodation & Food Services | 1,470 (55.4%) | 1,182 (44.6%) |
| Public Administration | 778 (54.7%) | 644 (45.3%) |
| Total | 16,861 (52.7%) | 15,160 (47.3%) |
Education in Grand Junction
School Enrollment in Grand Junction
The most common levels of schooling among the 15,159 students in Grand Junction are college / undergraduate (5,281 | 34.8%), elementary school (3,415 | 22.5%), and high school (2,371 | 15.6%).
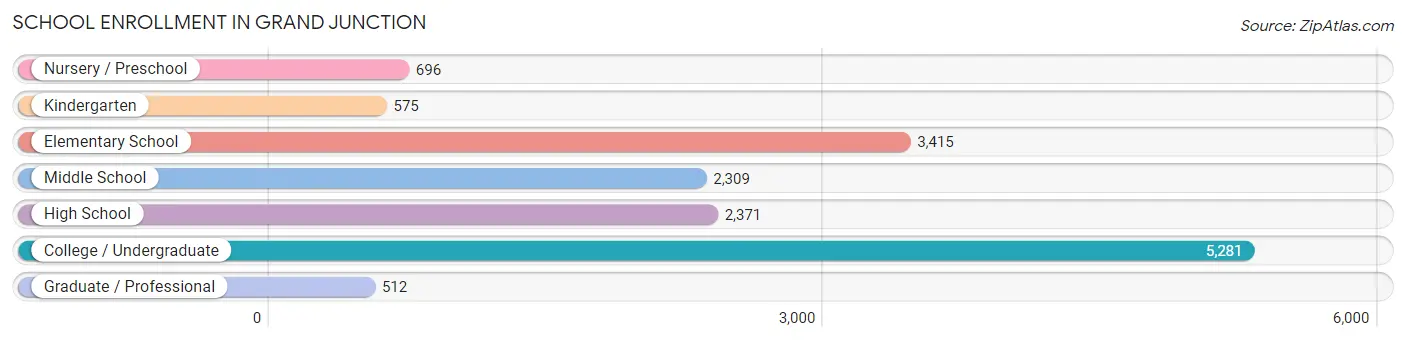
| School Level | # Students | % Students |
| Nursery / Preschool | 696 | 4.6% |
| Kindergarten | 575 | 3.8% |
| Elementary School | 3,415 | 22.5% |
| Middle School | 2,309 | 15.2% |
| High School | 2,371 | 15.6% |
| College / Undergraduate | 5,281 | 34.8% |
| Graduate / Professional | 512 | 3.4% |
| Total | 15,159 | 100.0% |
School Enrollment by Age by Funding Source in Grand Junction
Out of a total of 15,159 students who are enrolled in schools in Grand Junction, 1,880 (12.4%) attend a private institution, while the remaining 13,279 (87.6%) are enrolled in public schools. The age group of 35 years and over has the highest likelihood of being enrolled in private schools, with 248 (31.3% in the age bracket) enrolled. Conversely, the age group of 15 to 17 year olds has the lowest likelihood of being enrolled in a private school, with 1,600 (99.0% in the age bracket) attending a public institution.
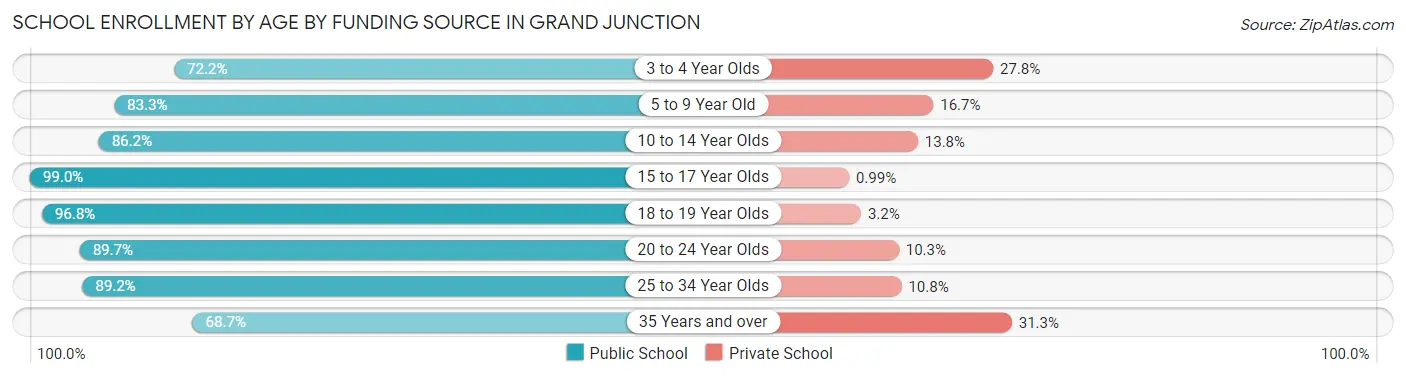
| Age Bracket | Public School | Private School |
| 3 to 4 Year Olds | 438 (72.2%) | 169 (27.8%) |
| 5 to 9 Year Old | 3,050 (83.3%) | 611 (16.7%) |
| 10 to 14 Year Olds | 2,620 (86.2%) | 420 (13.8%) |
| 15 to 17 Year Olds | 1,600 (99.0%) | 16 (1.0%) |
| 18 to 19 Year Olds | 2,035 (96.8%) | 68 (3.2%) |
| 20 to 24 Year Olds | 2,114 (89.7%) | 242 (10.3%) |
| 25 to 34 Year Olds | 878 (89.2%) | 106 (10.8%) |
| 35 Years and over | 544 (68.7%) | 248 (31.3%) |
| Total | 13,279 (87.6%) | 1,880 (12.4%) |
Educational Attainment by Field of Study in Grand Junction
Business (3,103 | 17.3%), science & technology (2,302 | 12.9%), education (1,984 | 11.1%), arts & humanities (1,417 | 7.9%), and social sciences (1,391 | 7.8%) are the most common fields of study among 17,897 individuals in Grand Junction who have obtained a bachelor's degree or higher.
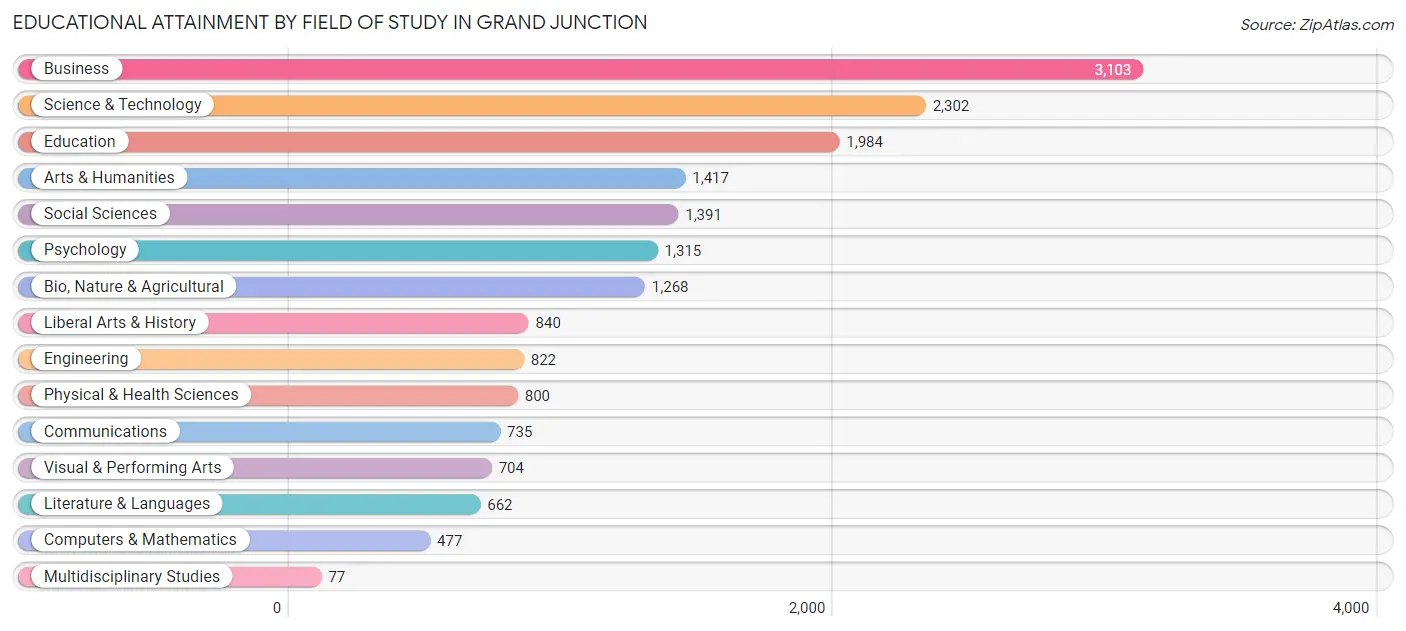
| Field of Study | # Graduates | % Graduates |
| Computers & Mathematics | 477 | 2.7% |
| Bio, Nature & Agricultural | 1,268 | 7.1% |
| Physical & Health Sciences | 800 | 4.5% |
| Psychology | 1,315 | 7.3% |
| Social Sciences | 1,391 | 7.8% |
| Engineering | 822 | 4.6% |
| Multidisciplinary Studies | 77 | 0.4% |
| Science & Technology | 2,302 | 12.9% |
| Business | 3,103 | 17.3% |
| Education | 1,984 | 11.1% |
| Literature & Languages | 662 | 3.7% |
| Liberal Arts & History | 840 | 4.7% |
| Visual & Performing Arts | 704 | 3.9% |
| Communications | 735 | 4.1% |
| Arts & Humanities | 1,417 | 7.9% |
| Total | 17,897 | 100.0% |
Transportation & Commute in Grand Junction
Vehicle Availability by Sex in Grand Junction
The most prevalent vehicle ownership categories in Grand Junction are males with 2 vehicles (7,453, accounting for 46.1%) and females with 2 vehicles (6,228, making up 52.0%).
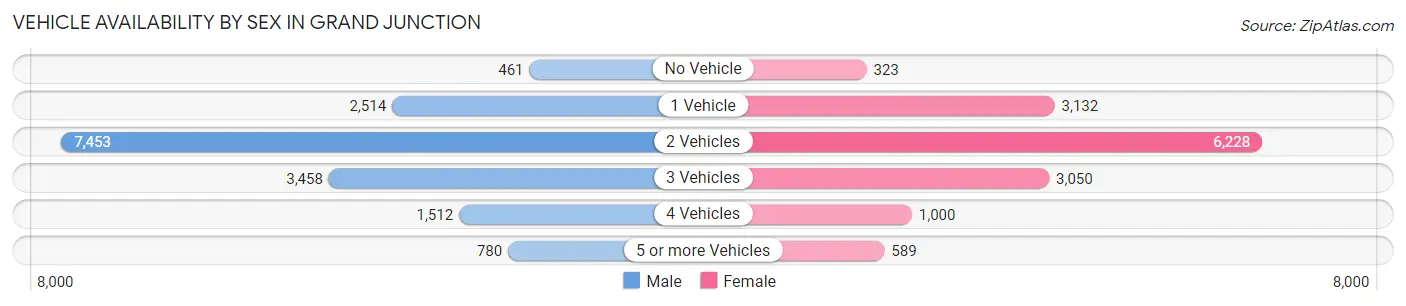
| Vehicles Available | Male | Female |
| No Vehicle | 461 (2.9%) | 323 (2.3%) |
| 1 Vehicle | 2,514 (15.5%) | 3,132 (21.9%) |
| 2 Vehicles | 7,453 (46.1%) | 6,228 (43.5%) |
| 3 Vehicles | 3,458 (21.4%) | 3,050 (21.3%) |
| 4 Vehicles | 1,512 (9.3%) | 1,000 (7.0%) |
| 5 or more Vehicles | 780 (4.8%) | 589 (4.1%) |
| Total | 16,178 (100.0%) | 14,322 (100.0%) |
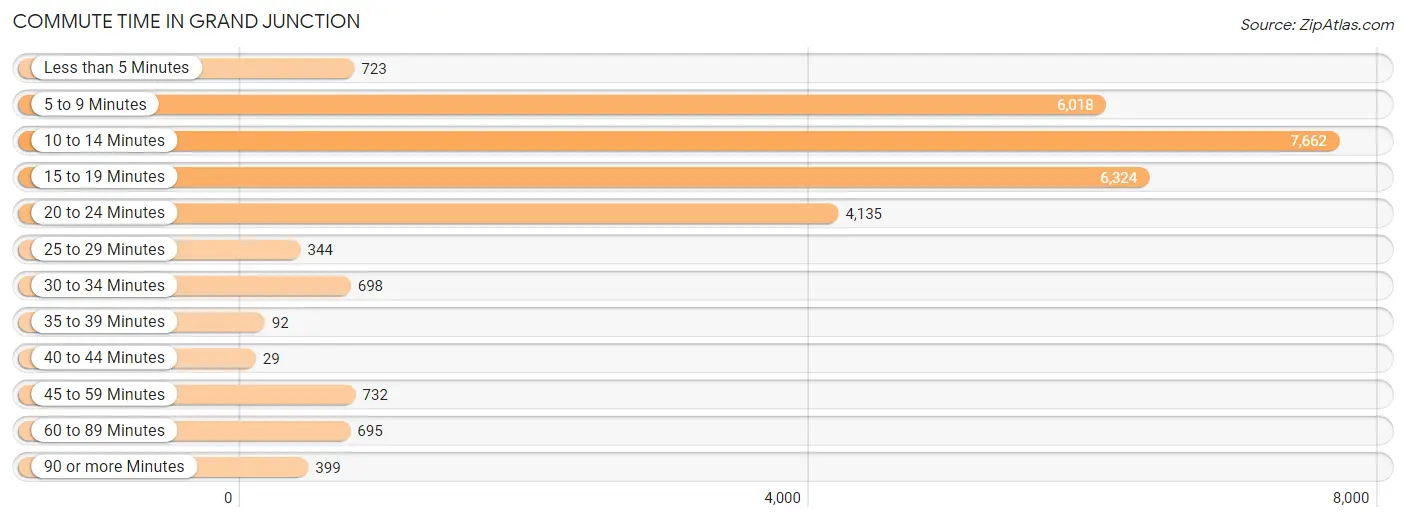
Commute Time in Grand Junction
The most frequently occuring commute durations in Grand Junction are 10 to 14 minutes (7,662 commuters, 27.5%), 15 to 19 minutes (6,324 commuters, 22.7%), and 5 to 9 minutes (6,018 commuters, 21.6%).
| Commute Time | # Commuters | % Commuters |
| Less than 5 Minutes | 723 | 2.6% |
| 5 to 9 Minutes | 6,018 | 21.6% |
| 10 to 14 Minutes | 7,662 | 27.5% |
| 15 to 19 Minutes | 6,324 | 22.7% |
| 20 to 24 Minutes | 4,135 | 14.8% |
| 25 to 29 Minutes | 344 | 1.2% |
| 30 to 34 Minutes | 698 | 2.5% |
| 35 to 39 Minutes | 92 | 0.3% |
| 40 to 44 Minutes | 29 | 0.1% |
| 45 to 59 Minutes | 732 | 2.6% |
| 60 to 89 Minutes | 695 | 2.5% |
| 90 or more Minutes | 399 | 1.4% |
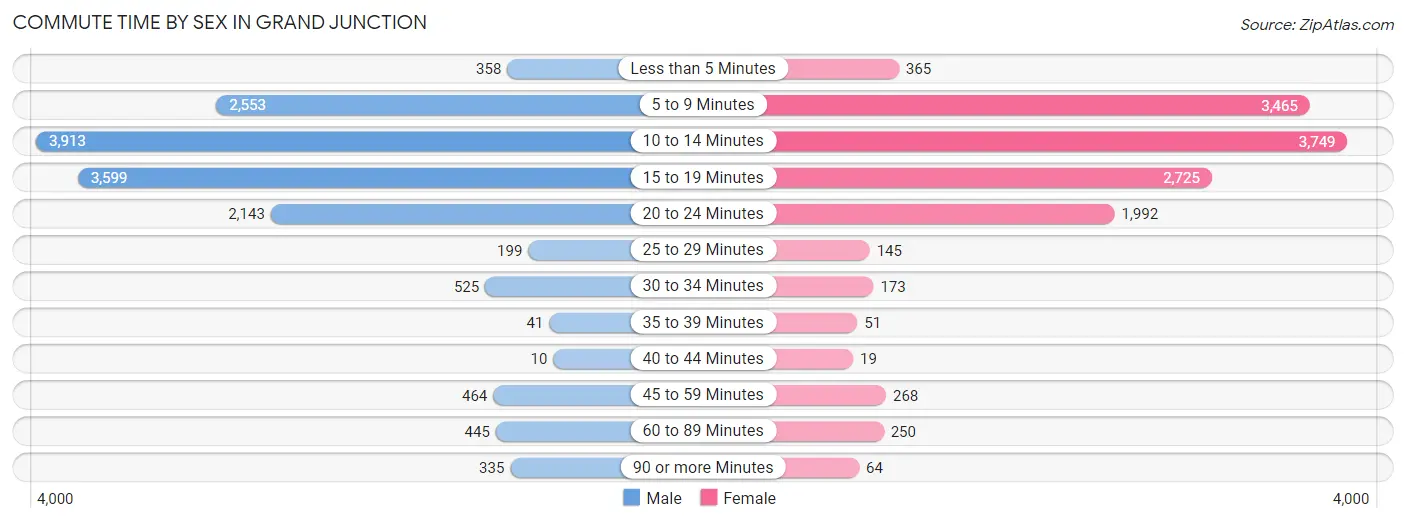
Commute Time by Sex in Grand Junction
The most common commute times in Grand Junction are 10 to 14 minutes (3,913 commuters, 26.8%) for males and 10 to 14 minutes (3,749 commuters, 28.3%) for females.
| Commute Time | Male | Female |
| Less than 5 Minutes | 358 (2.5%) | 365 (2.8%) |
| 5 to 9 Minutes | 2,553 (17.5%) | 3,465 (26.1%) |
| 10 to 14 Minutes | 3,913 (26.8%) | 3,749 (28.3%) |
| 15 to 19 Minutes | 3,599 (24.7%) | 2,725 (20.5%) |
| 20 to 24 Minutes | 2,143 (14.7%) | 1,992 (15.0%) |
| 25 to 29 Minutes | 199 (1.4%) | 145 (1.1%) |
| 30 to 34 Minutes | 525 (3.6%) | 173 (1.3%) |
| 35 to 39 Minutes | 41 (0.3%) | 51 (0.4%) |
| 40 to 44 Minutes | 10 (0.1%) | 19 (0.1%) |
| 45 to 59 Minutes | 464 (3.2%) | 268 (2.0%) |
| 60 to 89 Minutes | 445 (3.0%) | 250 (1.9%) |
| 90 or more Minutes | 335 (2.3%) | 64 (0.5%) |
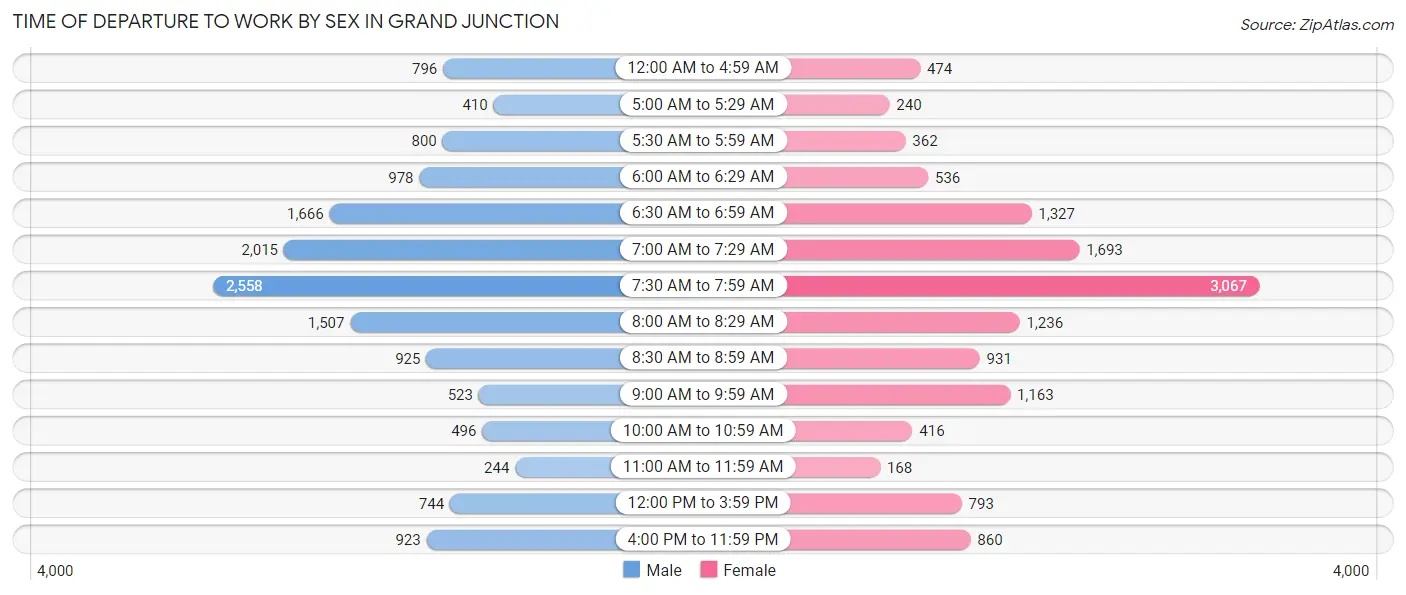
Time of Departure to Work by Sex in Grand Junction
The most frequent times of departure to work in Grand Junction are 7:30 AM to 7:59 AM (2,558, 17.5%) for males and 7:30 AM to 7:59 AM (3,067, 23.1%) for females.
| Time of Departure | Male | Female |
| 12:00 AM to 4:59 AM | 796 (5.5%) | 474 (3.6%) |
| 5:00 AM to 5:29 AM | 410 (2.8%) | 240 (1.8%) |
| 5:30 AM to 5:59 AM | 800 (5.5%) | 362 (2.7%) |
| 6:00 AM to 6:29 AM | 978 (6.7%) | 536 (4.0%) |
| 6:30 AM to 6:59 AM | 1,666 (11.4%) | 1,327 (10.0%) |
| 7:00 AM to 7:29 AM | 2,015 (13.8%) | 1,693 (12.8%) |
| 7:30 AM to 7:59 AM | 2,558 (17.5%) | 3,067 (23.1%) |
| 8:00 AM to 8:29 AM | 1,507 (10.3%) | 1,236 (9.3%) |
| 8:30 AM to 8:59 AM | 925 (6.3%) | 931 (7.0%) |
| 9:00 AM to 9:59 AM | 523 (3.6%) | 1,163 (8.8%) |
| 10:00 AM to 10:59 AM | 496 (3.4%) | 416 (3.1%) |
| 11:00 AM to 11:59 AM | 244 (1.7%) | 168 (1.3%) |
| 12:00 PM to 3:59 PM | 744 (5.1%) | 793 (6.0%) |
| 4:00 PM to 11:59 PM | 923 (6.3%) | 860 (6.5%) |
| Total | 14,585 (100.0%) | 13,266 (100.0%) |
Housing Occupancy in Grand Junction
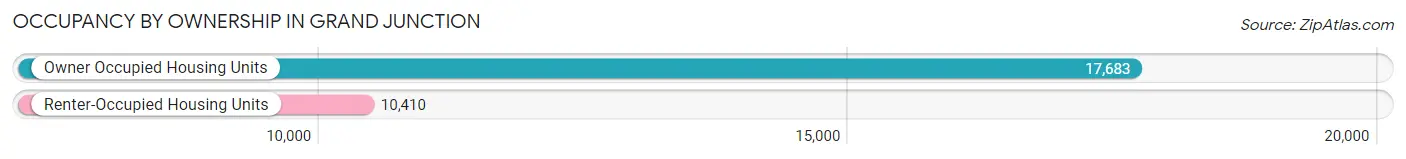
Occupancy by Ownership in Grand Junction
Of the total 28,093 dwellings in Grand Junction, owner-occupied units account for 17,683 (62.9%), while renter-occupied units make up 10,410 (37.1%).
| Occupancy | # Housing Units | % Housing Units |
| Owner Occupied Housing Units | 17,683 | 62.9% |
| Renter-Occupied Housing Units | 10,410 | 37.1% |
| Total Occupied Housing Units | 28,093 | 100.0% |
Occupancy by Household Size in Grand Junction
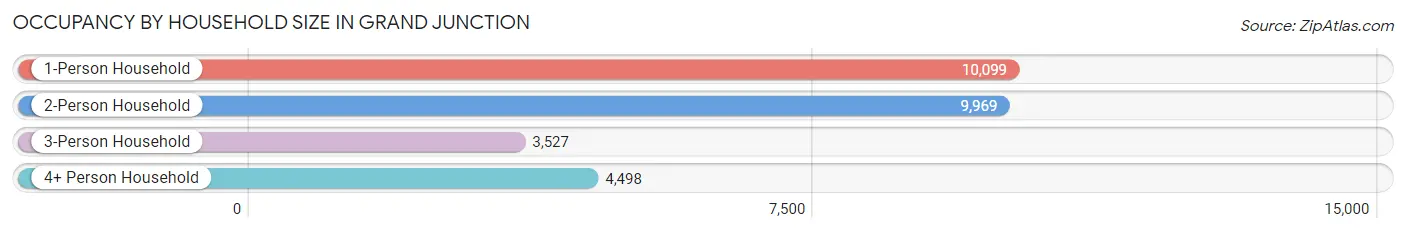
| Household Size | # Housing Units | % Housing Units |
| 1-Person Household | 10,099 | 35.9% |
| 2-Person Household | 9,969 | 35.5% |
| 3-Person Household | 3,527 | 12.6% |
| 4+ Person Household | 4,498 | 16.0% |
| Total Housing Units | 28,093 | 100.0% |
Occupancy by Ownership by Household Size in Grand Junction
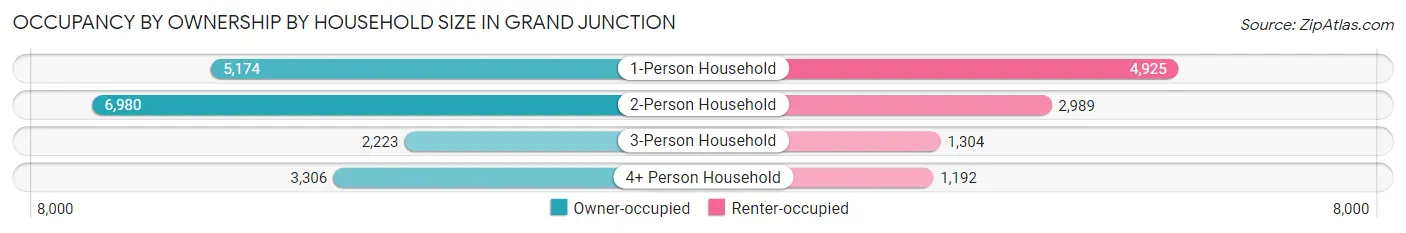
| Household Size | Owner-occupied | Renter-occupied |
| 1-Person Household | 5,174 (51.2%) | 4,925 (48.8%) |
| 2-Person Household | 6,980 (70.0%) | 2,989 (30.0%) |
| 3-Person Household | 2,223 (63.0%) | 1,304 (37.0%) |
| 4+ Person Household | 3,306 (73.5%) | 1,192 (26.5%) |
| Total Housing Units | 17,683 (62.9%) | 10,410 (37.1%) |
Occupancy by Educational Attainment in Grand Junction
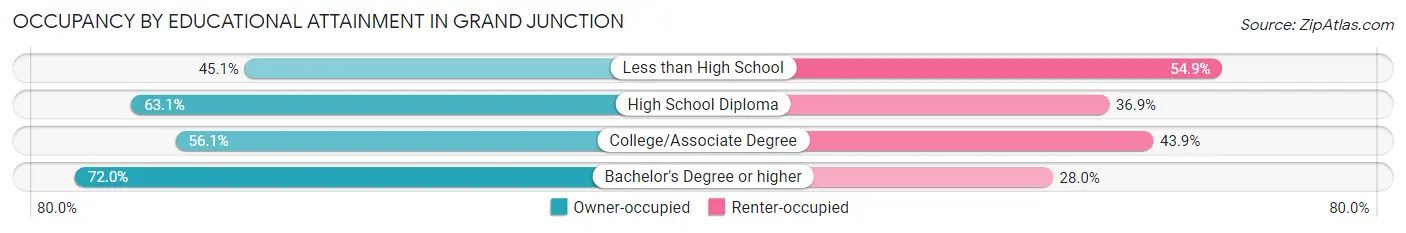
| Household Size | Owner-occupied | Renter-occupied |
| Less than High School | 832 (45.1%) | 1,013 (54.9%) |
| High School Diploma | 4,115 (63.1%) | 2,408 (36.9%) |
| College/Associate Degree | 5,164 (56.1%) | 4,046 (43.9%) |
| Bachelor's Degree or higher | 7,572 (72.0%) | 2,943 (28.0%) |
Occupancy by Age of Householder in Grand Junction
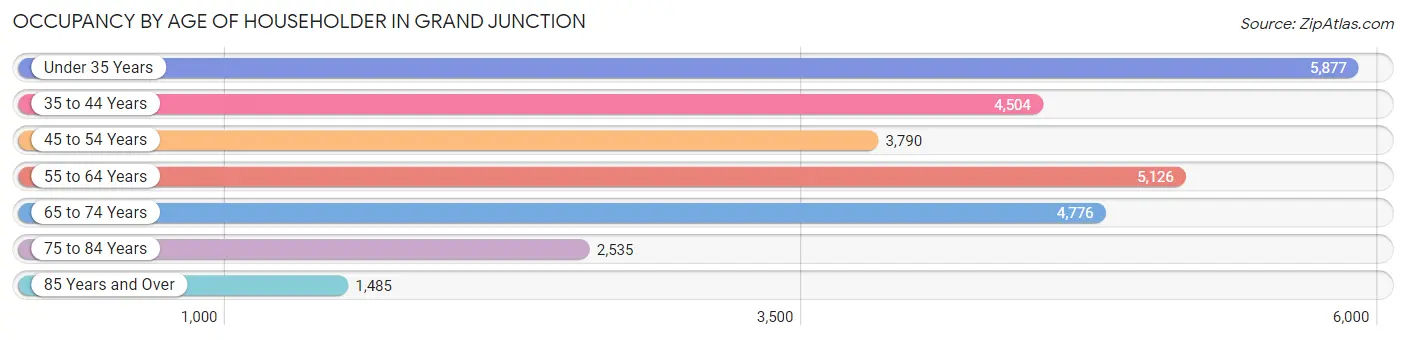
| Age Bracket | # Households | % Households |
| Under 35 Years | 5,877 | 20.9% |
| 35 to 44 Years | 4,504 | 16.0% |
| 45 to 54 Years | 3,790 | 13.5% |
| 55 to 64 Years | 5,126 | 18.2% |
| 65 to 74 Years | 4,776 | 17.0% |
| 75 to 84 Years | 2,535 | 9.0% |
| 85 Years and Over | 1,485 | 5.3% |
| Total | 28,093 | 100.0% |
Housing Finances in Grand Junction
Median Income by Occupancy in Grand Junction
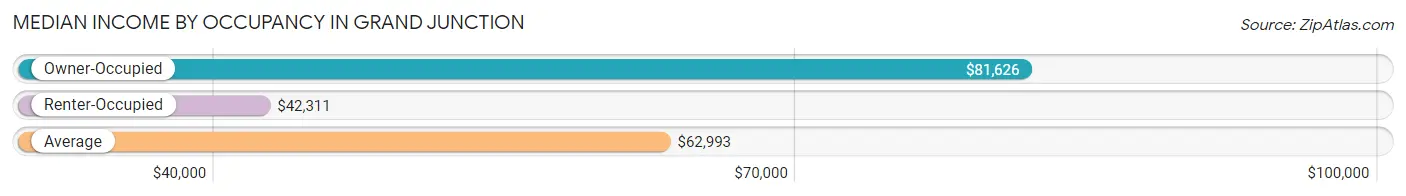
| Occupancy Type | # Households | Median Income |
| Owner-Occupied | 17,683 (62.9%) | $81,626 |
| Renter-Occupied | 10,410 (37.1%) | $42,311 |
| Average | 28,093 (100.0%) | $62,993 |
Occupancy by Householder Income Bracket in Grand Junction
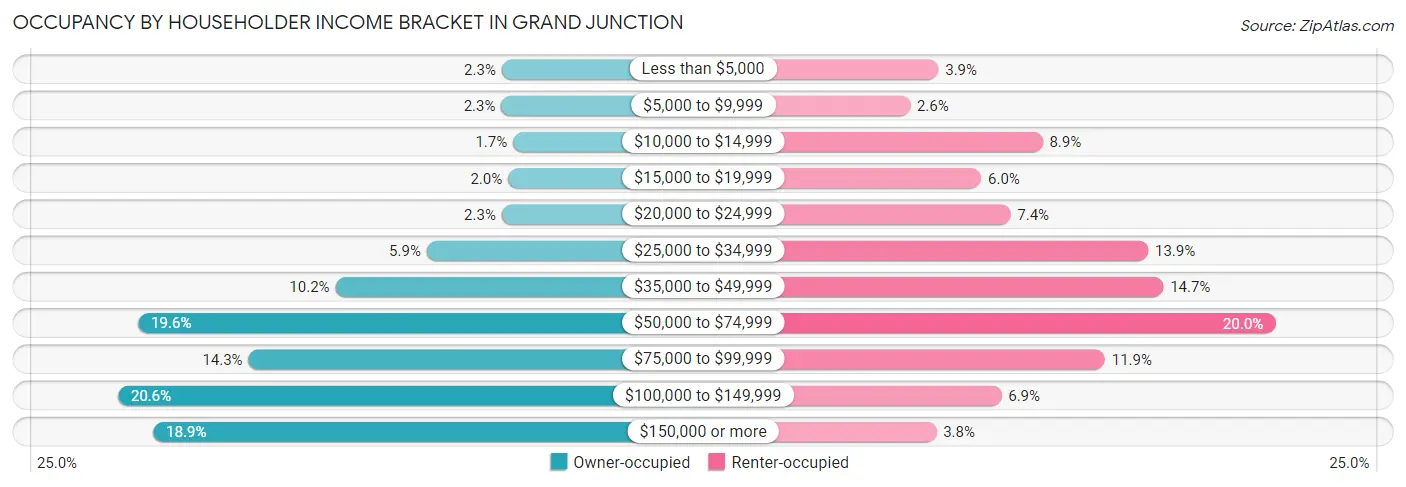
| Income Bracket | Owner-occupied | Renter-occupied |
| Less than $5,000 | 404 (2.3%) | 410 (3.9%) |
| $5,000 to $9,999 | 406 (2.3%) | 270 (2.6%) |
| $10,000 to $14,999 | 307 (1.7%) | 927 (8.9%) |
| $15,000 to $19,999 | 350 (2.0%) | 623 (6.0%) |
| $20,000 to $24,999 | 403 (2.3%) | 767 (7.4%) |
| $25,000 to $34,999 | 1,035 (5.9%) | 1,450 (13.9%) |
| $35,000 to $49,999 | 1,803 (10.2%) | 1,525 (14.6%) |
| $50,000 to $74,999 | 3,466 (19.6%) | 2,080 (20.0%) |
| $75,000 to $99,999 | 2,535 (14.3%) | 1,236 (11.9%) |
| $100,000 to $149,999 | 3,635 (20.6%) | 722 (6.9%) |
| $150,000 or more | 3,339 (18.9%) | 400 (3.8%) |
| Total | 17,683 (100.0%) | 10,410 (100.0%) |
Monthly Housing Cost Tiers in Grand Junction
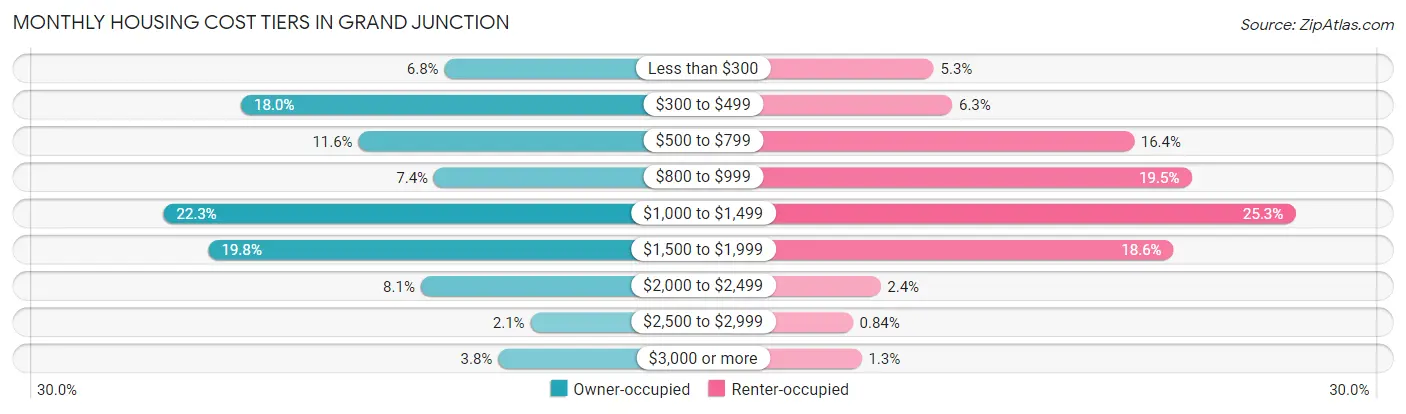
| Monthly Cost | Owner-occupied | Renter-occupied |
| Less than $300 | 1,205 (6.8%) | 553 (5.3%) |
| $300 to $499 | 3,190 (18.0%) | 659 (6.3%) |
| $500 to $799 | 2,045 (11.6%) | 1,704 (16.4%) |
| $800 to $999 | 1,306 (7.4%) | 2,034 (19.5%) |
| $1,000 to $1,499 | 3,949 (22.3%) | 2,632 (25.3%) |
| $1,500 to $1,999 | 3,509 (19.8%) | 1,932 (18.6%) |
| $2,000 to $2,499 | 1,435 (8.1%) | 247 (2.4%) |
| $2,500 to $2,999 | 365 (2.1%) | 87 (0.8%) |
| $3,000 or more | 679 (3.8%) | 138 (1.3%) |
| Total | 17,683 (100.0%) | 10,410 (100.0%) |
Physical Housing Characteristics in Grand Junction
Housing Structures in Grand Junction
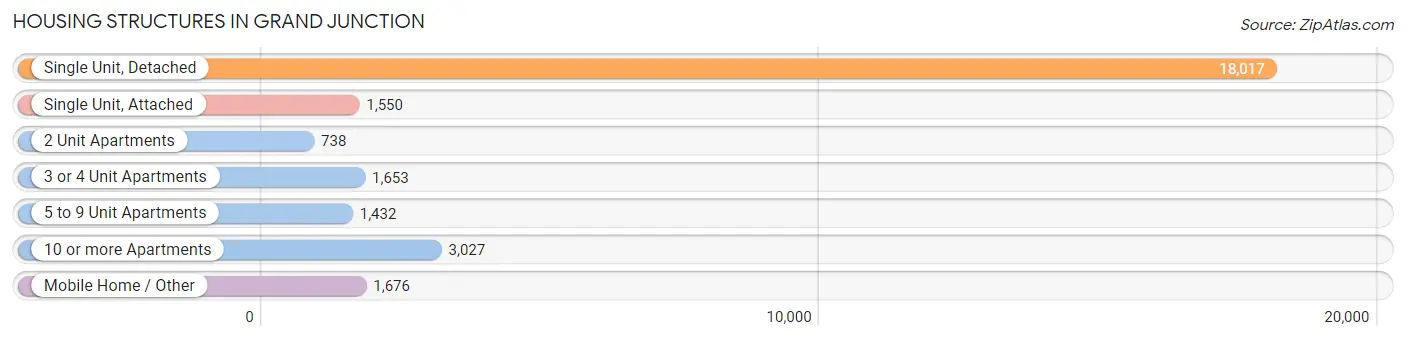
| Structure Type | # Housing Units | % Housing Units |
| Single Unit, Detached | 18,017 | 64.1% |
| Single Unit, Attached | 1,550 | 5.5% |
| 2 Unit Apartments | 738 | 2.6% |
| 3 or 4 Unit Apartments | 1,653 | 5.9% |
| 5 to 9 Unit Apartments | 1,432 | 5.1% |
| 10 or more Apartments | 3,027 | 10.8% |
| Mobile Home / Other | 1,676 | 6.0% |
| Total | 28,093 | 100.0% |
Housing Structures by Occupancy in Grand Junction
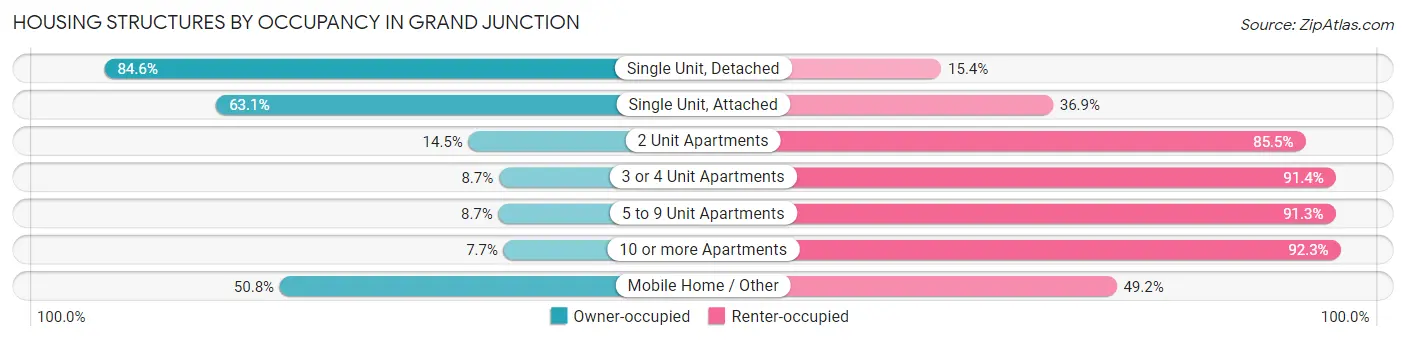
| Structure Type | Owner-occupied | Renter-occupied |
| Single Unit, Detached | 15,244 (84.6%) | 2,773 (15.4%) |
| Single Unit, Attached | 978 (63.1%) | 572 (36.9%) |
| 2 Unit Apartments | 107 (14.5%) | 631 (85.5%) |
| 3 or 4 Unit Apartments | 143 (8.6%) | 1,510 (91.3%) |
| 5 to 9 Unit Apartments | 125 (8.7%) | 1,307 (91.3%) |
| 10 or more Apartments | 234 (7.7%) | 2,793 (92.3%) |
| Mobile Home / Other | 852 (50.8%) | 824 (49.2%) |
| Total | 17,683 (62.9%) | 10,410 (37.1%) |
Housing Structures by Number of Rooms in Grand Junction
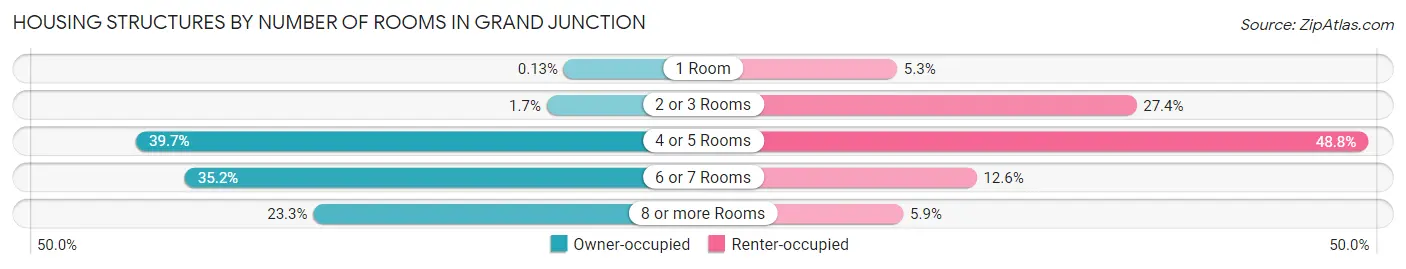
| Number of Rooms | Owner-occupied | Renter-occupied |
| 1 Room | 23 (0.1%) | 549 (5.3%) |
| 2 or 3 Rooms | 303 (1.7%) | 2,853 (27.4%) |
| 4 or 5 Rooms | 7,017 (39.7%) | 5,084 (48.8%) |
| 6 or 7 Rooms | 6,219 (35.2%) | 1,315 (12.6%) |
| 8 or more Rooms | 4,121 (23.3%) | 609 (5.9%) |
| Total | 17,683 (100.0%) | 10,410 (100.0%) |
Housing Structure by Heating Type in Grand Junction
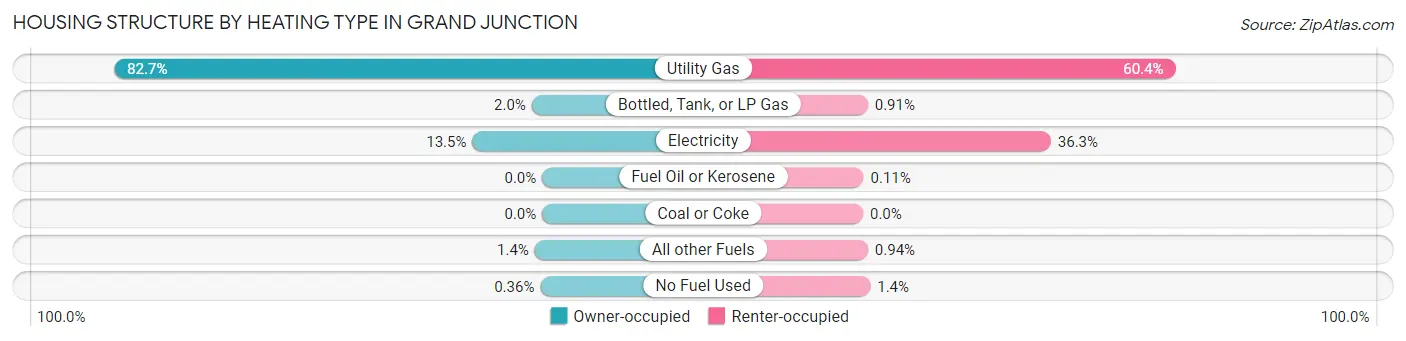
| Heating Type | Owner-occupied | Renter-occupied |
| Utility Gas | 14,626 (82.7%) | 6,282 (60.4%) |
| Bottled, Tank, or LP Gas | 356 (2.0%) | 95 (0.9%) |
| Electricity | 2,385 (13.5%) | 3,778 (36.3%) |
| Fuel Oil or Kerosene | 0 (0.0%) | 11 (0.1%) |
| Coal or Coke | 0 (0.0%) | 0 (0.0%) |
| All other Fuels | 253 (1.4%) | 98 (0.9%) |
| No Fuel Used | 63 (0.4%) | 146 (1.4%) |
| Total | 17,683 (100.0%) | 10,410 (100.0%) |
Household Vehicle Usage in Grand Junction
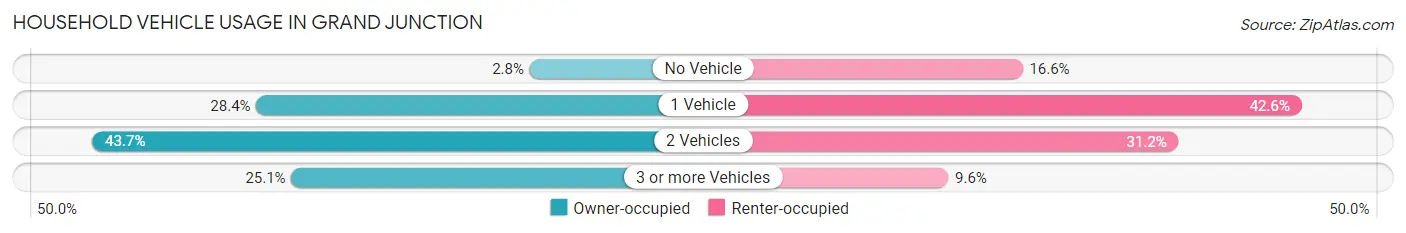
| Vehicles per Household | Owner-occupied | Renter-occupied |
| No Vehicle | 503 (2.8%) | 1,725 (16.6%) |
| 1 Vehicle | 5,015 (28.4%) | 4,439 (42.6%) |
| 2 Vehicles | 7,728 (43.7%) | 3,243 (31.1%) |
| 3 or more Vehicles | 4,437 (25.1%) | 1,003 (9.6%) |
| Total | 17,683 (100.0%) | 10,410 (100.0%) |
Real Estate & Mortgages in Grand Junction
Real Estate and Mortgage Overview in Grand Junction
| Characteristic | Without Mortgage | With Mortgage |
| Housing Units | 6,156 | 11,527 |
| Median Property Value | $328,000 | $312,700 |
| Median Household Income | $65,541 | $2,666 |
| Monthly Housing Costs | $427 | $679 |
| Real Estate Taxes | $1,263 | $102 |
Property Value by Mortgage Status in Grand Junction
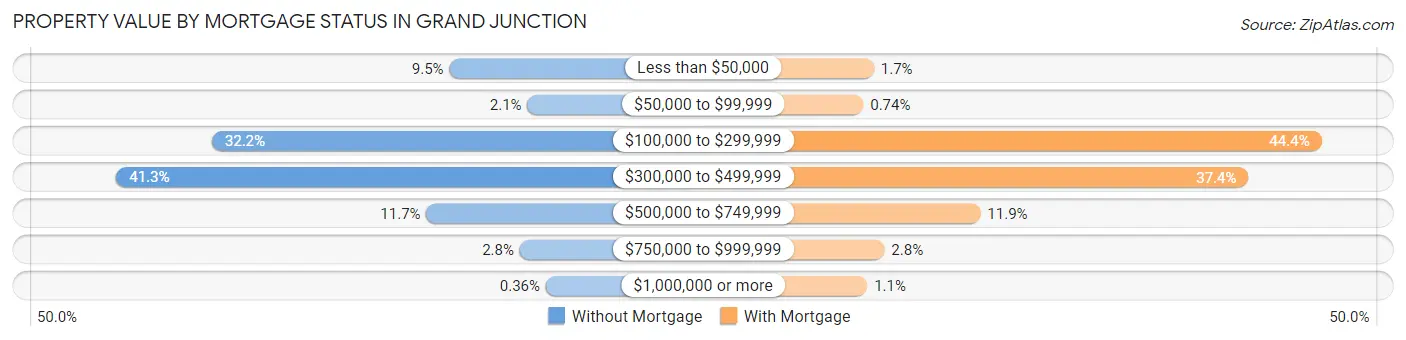
| Property Value | Without Mortgage | With Mortgage |
| Less than $50,000 | 587 (9.5%) | 200 (1.7%) |
| $50,000 to $99,999 | 130 (2.1%) | 85 (0.7%) |
| $100,000 to $299,999 | 1,980 (32.2%) | 5,114 (44.4%) |
| $300,000 to $499,999 | 2,540 (41.3%) | 4,312 (37.4%) |
| $500,000 to $749,999 | 722 (11.7%) | 1,371 (11.9%) |
| $750,000 to $999,999 | 175 (2.8%) | 317 (2.8%) |
| $1,000,000 or more | 22 (0.4%) | 128 (1.1%) |
| Total | 6,156 (100.0%) | 11,527 (100.0%) |
Household Income by Mortgage Status in Grand Junction
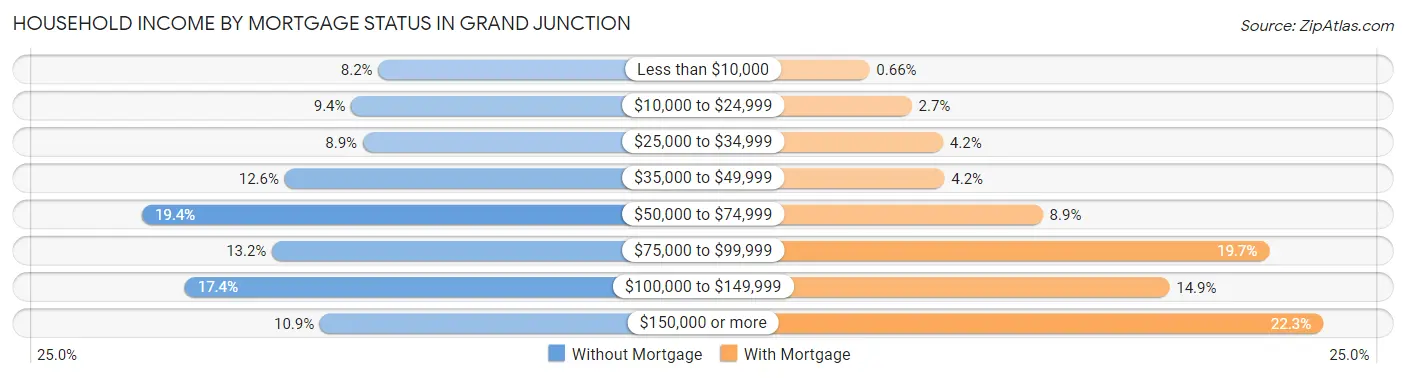
| Household Income | Without Mortgage | With Mortgage |
| Less than $10,000 | 502 (8.2%) | 76 (0.7%) |
| $10,000 to $24,999 | 581 (9.4%) | 308 (2.7%) |
| $25,000 to $34,999 | 547 (8.9%) | 479 (4.2%) |
| $35,000 to $49,999 | 776 (12.6%) | 488 (4.2%) |
| $50,000 to $74,999 | 1,195 (19.4%) | 1,027 (8.9%) |
| $75,000 to $99,999 | 813 (13.2%) | 2,271 (19.7%) |
| $100,000 to $149,999 | 1,069 (17.4%) | 1,722 (14.9%) |
| $150,000 or more | 673 (10.9%) | 2,566 (22.3%) |
| Total | 6,156 (100.0%) | 11,527 (100.0%) |
Property Value to Household Income Ratio in Grand Junction
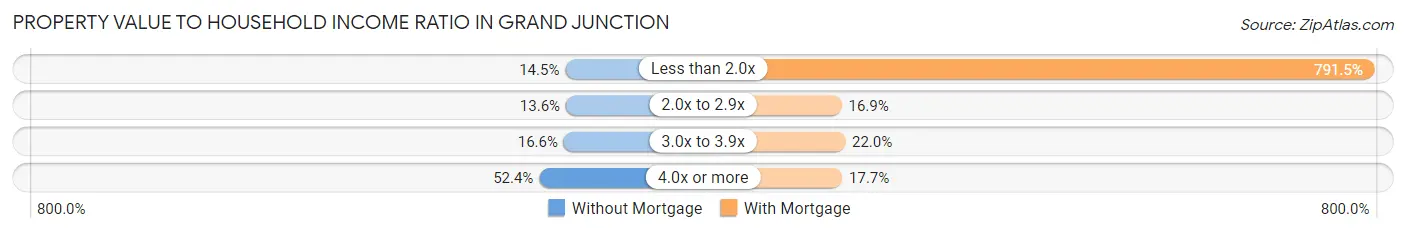
| Value-to-Income Ratio | Without Mortgage | With Mortgage |
| Less than 2.0x | 892 (14.5%) | 91,240 (791.5%) |
| 2.0x to 2.9x | 834 (13.6%) | 1,953 (16.9%) |
| 3.0x to 3.9x | 1,021 (16.6%) | 2,535 (22.0%) |
| 4.0x or more | 3,223 (52.4%) | 2,038 (17.7%) |
| Total | 6,156 (100.0%) | 11,527 (100.0%) |
Real Estate Taxes by Mortgage Status in Grand Junction
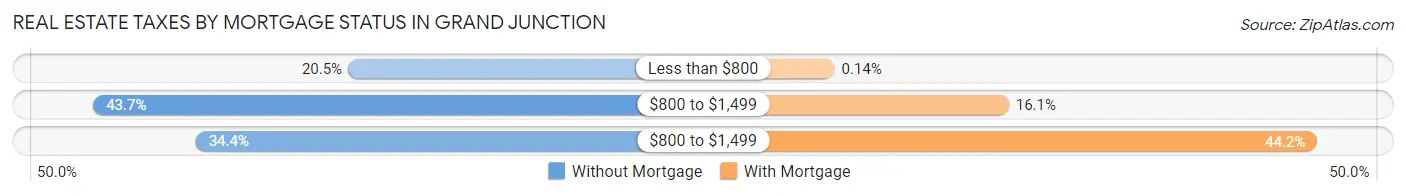
| Property Taxes | Without Mortgage | With Mortgage |
| Less than $800 | 1,260 (20.5%) | 16 (0.1%) |
| $800 to $1,499 | 2,692 (43.7%) | 1,850 (16.1%) |
| $800 to $1,499 | 2,116 (34.4%) | 5,097 (44.2%) |
| Total | 6,156 (100.0%) | 11,527 (100.0%) |
Health & Disability in Grand Junction
Health Insurance Coverage by Age in Grand Junction
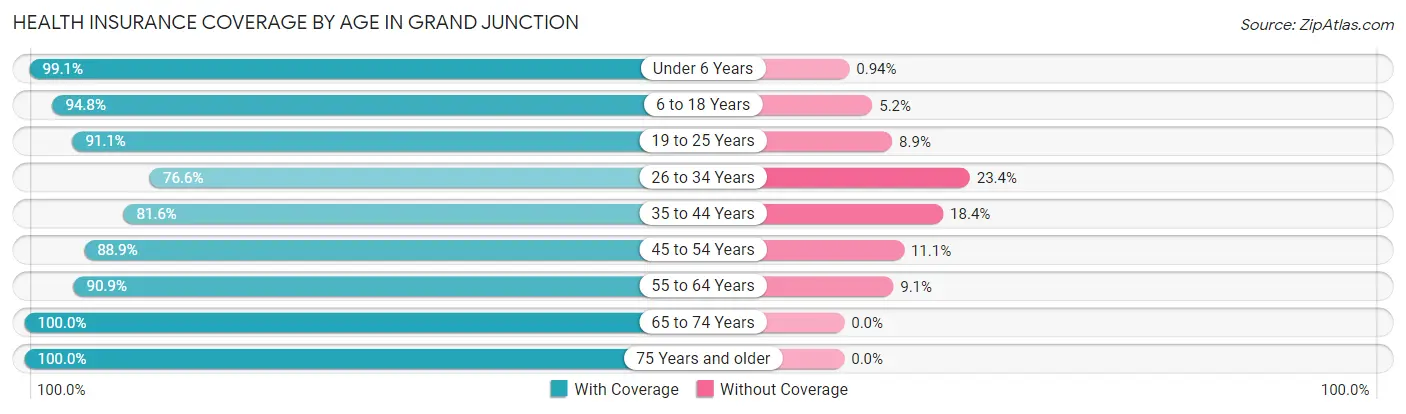
| Age Bracket | With Coverage | Without Coverage |
| Under 6 Years | 3,896 (99.1%) | 37 (0.9%) |
| 6 to 18 Years | 8,743 (94.8%) | 482 (5.2%) |
| 19 to 25 Years | 6,986 (91.1%) | 685 (8.9%) |
| 26 to 34 Years | 5,935 (76.6%) | 1,814 (23.4%) |
| 35 to 44 Years | 6,591 (81.6%) | 1,490 (18.4%) |
| 45 to 54 Years | 6,076 (88.9%) | 761 (11.1%) |
| 55 to 64 Years | 7,683 (90.9%) | 773 (9.1%) |
| 65 to 74 Years | 7,351 (100.0%) | 0 (0.0%) |
| 75 Years and older | 5,595 (100.0%) | 0 (0.0%) |
| Total | 58,856 (90.7%) | 6,042 (9.3%) |
Health Insurance Coverage by Citizenship Status in Grand Junction
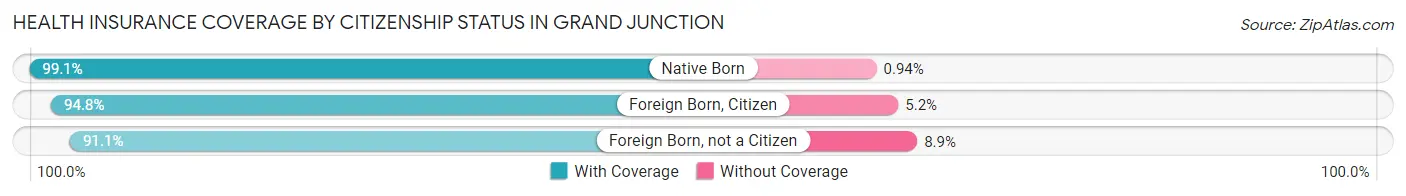
| Citizenship Status | With Coverage | Without Coverage |
| Native Born | 3,896 (99.1%) | 37 (0.9%) |
| Foreign Born, Citizen | 8,743 (94.8%) | 482 (5.2%) |
| Foreign Born, not a Citizen | 6,986 (91.1%) | 685 (8.9%) |
Health Insurance Coverage by Household Income in Grand Junction
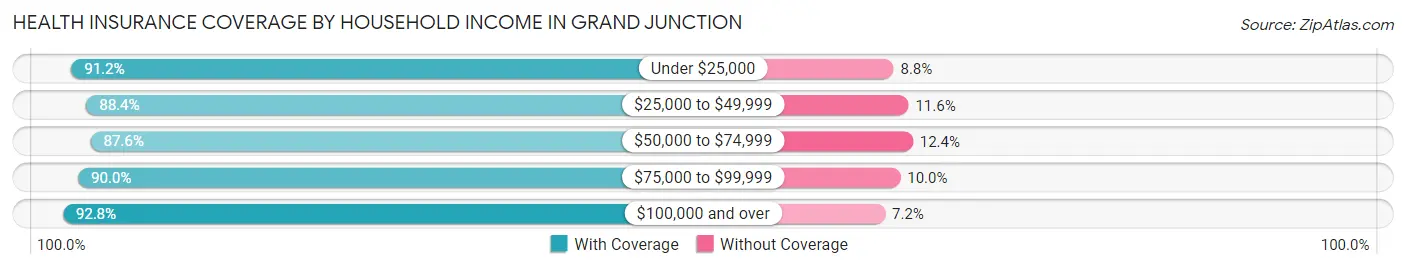
| Household Income | With Coverage | Without Coverage |
| Under $25,000 | 6,513 (91.2%) | 625 (8.8%) |
| $25,000 to $49,999 | 9,102 (88.4%) | 1,190 (11.6%) |
| $50,000 to $74,999 | 10,767 (87.6%) | 1,518 (12.4%) |
| $75,000 to $99,999 | 8,396 (90.0%) | 935 (10.0%) |
| $100,000 and over | 22,082 (92.8%) | 1,705 (7.2%) |
Public vs Private Health Insurance Coverage by Age in Grand Junction
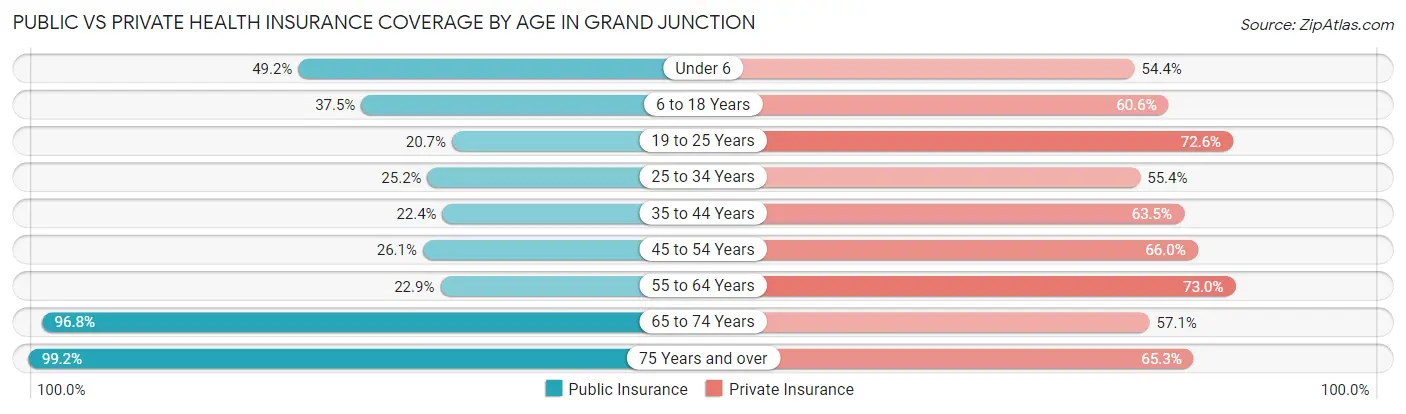
| Age Bracket | Public Insurance | Private Insurance |
| Under 6 | 1,936 (49.2%) | 2,138 (54.4%) |
| 6 to 18 Years | 3,461 (37.5%) | 5,593 (60.6%) |
| 19 to 25 Years | 1,588 (20.7%) | 5,568 (72.6%) |
| 25 to 34 Years | 1,955 (25.2%) | 4,294 (55.4%) |
| 35 to 44 Years | 1,813 (22.4%) | 5,129 (63.5%) |
| 45 to 54 Years | 1,784 (26.1%) | 4,513 (66.0%) |
| 55 to 64 Years | 1,932 (22.9%) | 6,176 (73.0%) |
| 65 to 74 Years | 7,118 (96.8%) | 4,200 (57.1%) |
| 75 Years and over | 5,551 (99.2%) | 3,653 (65.3%) |
| Total | 27,138 (41.8%) | 41,264 (63.6%) |
Disability Status by Sex by Age in Grand Junction
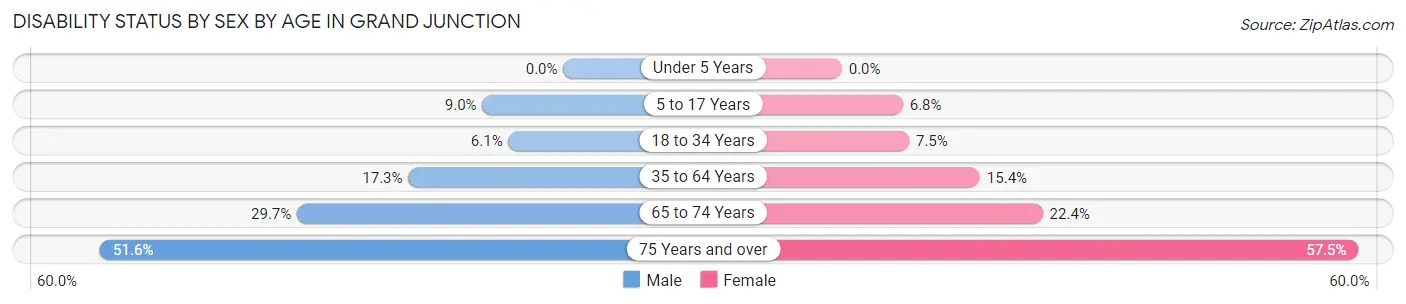
| Age Bracket | Male | Female |
| Under 5 Years | 0 (0.0%) | 0 (0.0%) |
| 5 to 17 Years | 438 (9.0%) | 249 (6.8%) |
| 18 to 34 Years | 501 (6.1%) | 627 (7.5%) |
| 35 to 64 Years | 2,078 (17.3%) | 1,743 (15.4%) |
| 65 to 74 Years | 1,037 (29.6%) | 862 (22.4%) |
| 75 Years and over | 1,208 (51.6%) | 1,871 (57.5%) |
Disability Class by Sex by Age in Grand Junction
Disability Class: Hearing Difficulty
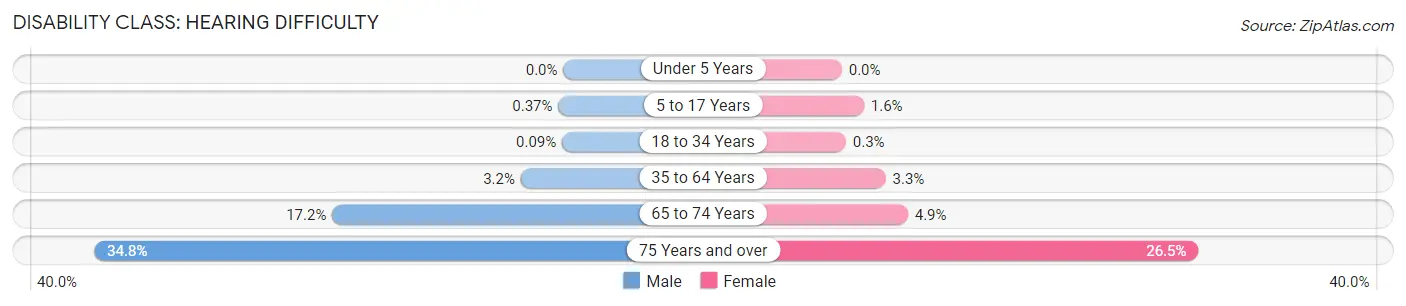
| Age Bracket | Male | Female |
| Under 5 Years | 0 (0.0%) | 0 (0.0%) |
| 5 to 17 Years | 18 (0.4%) | 60 (1.6%) |
| 18 to 34 Years | 7 (0.1%) | 25 (0.3%) |
| 35 to 64 Years | 380 (3.2%) | 368 (3.3%) |
| 65 to 74 Years | 600 (17.2%) | 189 (4.9%) |
| 75 Years and over | 816 (34.8%) | 861 (26.5%) |
Disability Class: Vision Difficulty
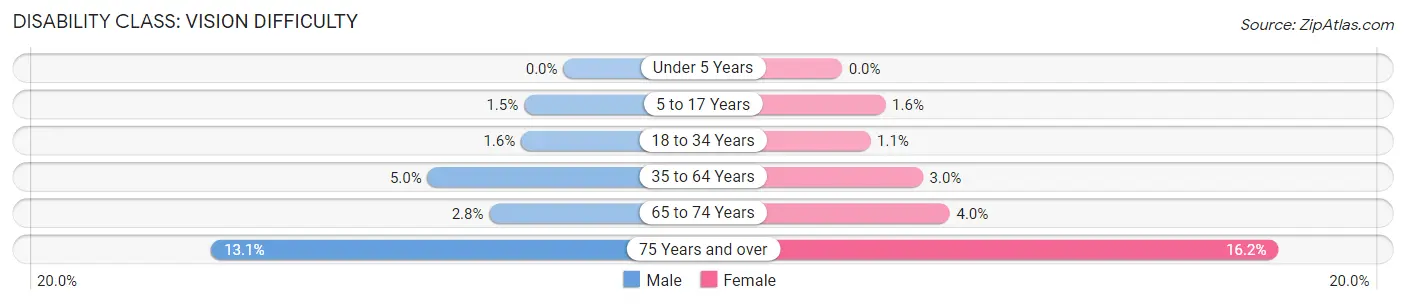
| Age Bracket | Male | Female |
| Under 5 Years | 0 (0.0%) | 0 (0.0%) |
| 5 to 17 Years | 71 (1.5%) | 59 (1.6%) |
| 18 to 34 Years | 129 (1.6%) | 88 (1.1%) |
| 35 to 64 Years | 607 (5.0%) | 340 (3.0%) |
| 65 to 74 Years | 96 (2.8%) | 154 (4.0%) |
| 75 Years and over | 306 (13.1%) | 527 (16.2%) |
Disability Class: Cognitive Difficulty
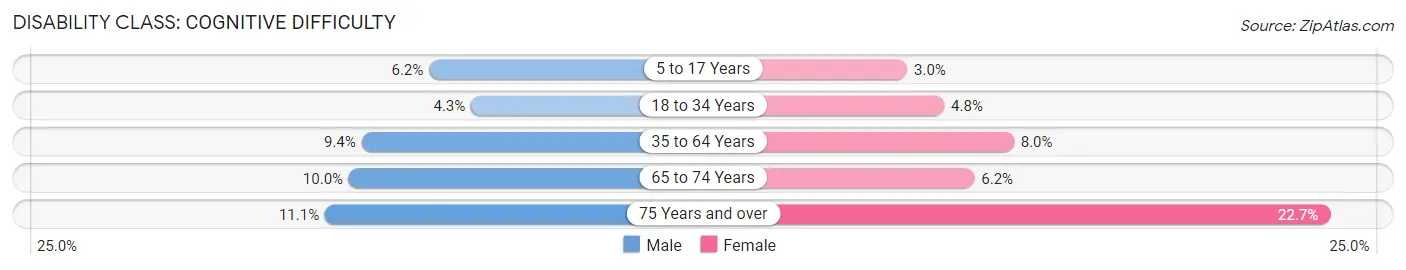
| Age Bracket | Male | Female |
| 5 to 17 Years | 303 (6.2%) | 111 (3.0%) |
| 18 to 34 Years | 351 (4.3%) | 398 (4.8%) |
| 35 to 64 Years | 1,127 (9.4%) | 904 (8.0%) |
| 65 to 74 Years | 348 (10.0%) | 237 (6.1%) |
| 75 Years and over | 259 (11.1%) | 737 (22.7%) |
Disability Class: Ambulatory Difficulty
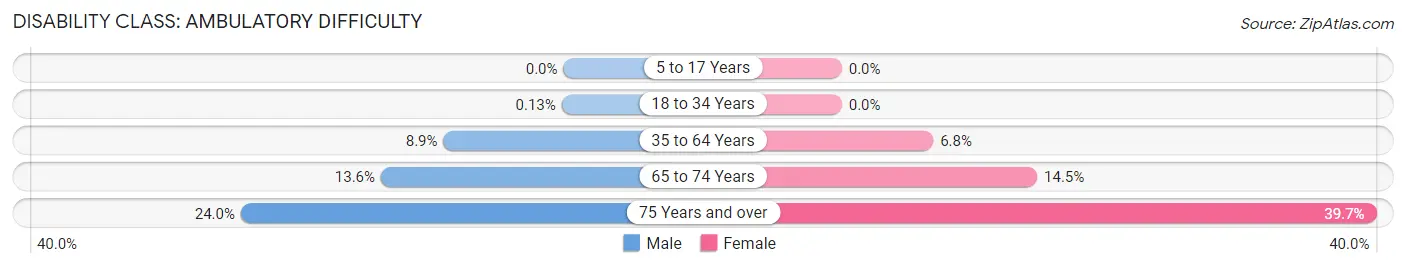
| Age Bracket | Male | Female |
| 5 to 17 Years | 0 (0.0%) | 0 (0.0%) |
| 18 to 34 Years | 11 (0.1%) | 0 (0.0%) |
| 35 to 64 Years | 1,073 (8.9%) | 770 (6.8%) |
| 65 to 74 Years | 474 (13.6%) | 559 (14.5%) |
| 75 Years and over | 561 (23.9%) | 1,291 (39.7%) |
Disability Class: Self-Care Difficulty
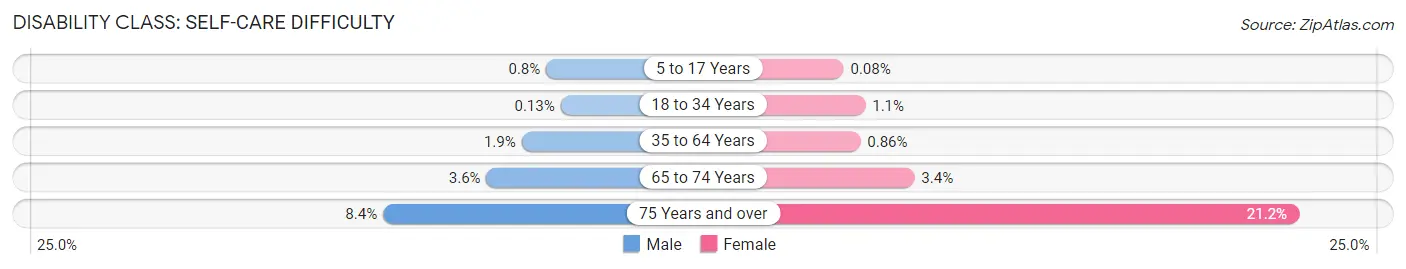
| Age Bracket | Male | Female |
| 5 to 17 Years | 39 (0.8%) | 3 (0.1%) |
| 18 to 34 Years | 11 (0.1%) | 91 (1.1%) |
| 35 to 64 Years | 234 (1.9%) | 98 (0.9%) |
| 65 to 74 Years | 125 (3.6%) | 130 (3.4%) |
| 75 Years and over | 196 (8.4%) | 690 (21.2%) |
Technology Access in Grand Junction
Computing Device Access in Grand Junction
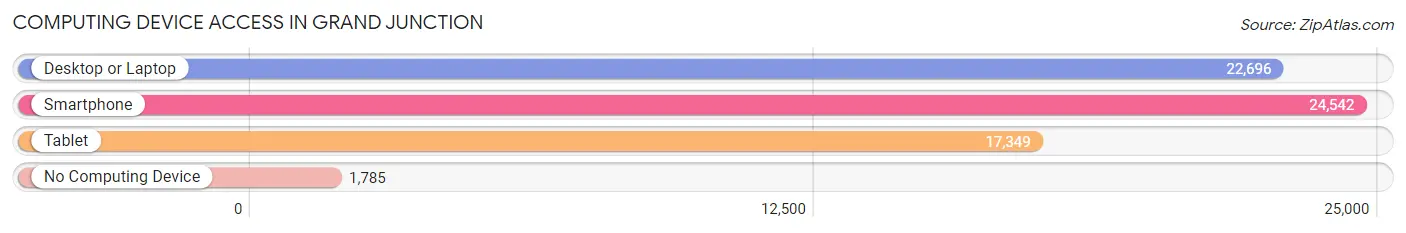
| Device Type | # Households | % Households |
| Desktop or Laptop | 22,696 | 80.8% |
| Smartphone | 24,542 | 87.4% |
| Tablet | 17,349 | 61.8% |
| No Computing Device | 1,785 | 6.4% |
| Total | 28,093 | 100.0% |
Internet Access in Grand Junction
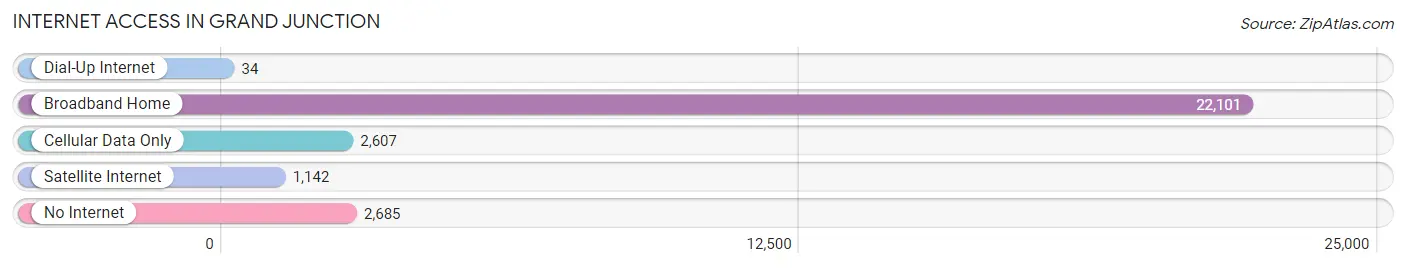
| Internet Type | # Households | % Households |
| Dial-Up Internet | 34 | 0.1% |
| Broadband Home | 22,101 | 78.7% |
| Cellular Data Only | 2,607 | 9.3% |
| Satellite Internet | 1,142 | 4.1% |
| No Internet | 2,685 | 9.6% |
| Total | 28,093 | 100.0% |
Grand Junction Summary
Geography
Grand Junction is located in western Colorado, in the Grand Valley of the Colorado River. The city is situated along the Colorado River, at the confluence of the Gunnison and the Colorado Rivers. The city is located at the base of the Grand Mesa, the largest flat-topped mountain in the world. The city is surrounded by desert and mountain terrain, with the Book Cliffs to the north and the Colorado National Monument to the south.
History
Grand Junction was founded in 1881 by George Crawford, a former prospector. The city was named after the junction of the Gunnison and Colorado Rivers. The city was originally a trading post for prospectors and ranchers, and was the first permanent settlement in the Grand Valley.
In the early 1900s, Grand Junction became a center for the fruit industry, with the first commercial orchards being planted in the area. The city also became a center for the oil and gas industry, with the first oil well being drilled in the area in 1901.
The city experienced a period of growth in the 1950s and 1960s, with the construction of Interstate 70 and the Colorado Riverfront Trail. The city also became a center for the aerospace industry, with the opening of the Grand Junction Regional Airport in the 1970s.
Economy
Grand Junction is the largest city in western Colorado and is the economic hub of the region. The city is home to a diverse economy, with a mix of industries including agriculture, energy, manufacturing, tourism, and healthcare.
Agriculture is a major part of the economy, with the Grand Valley being one of the most productive agricultural regions in the state. The city is home to a number of wineries and breweries, as well as a thriving fruit industry.
The energy industry is also a major part of the economy, with the city being home to a number of oil and gas companies. The city is also home to a number of renewable energy companies, including solar and wind energy companies.
Manufacturing is also a major part of the economy, with the city being home to a number of manufacturing companies, including aerospace and defense companies.
Tourism is also a major part of the economy, with the city being home to a number of attractions, including the Colorado National Monument, the Grand Mesa, and the Colorado Riverfront Trail.
Demographics
As of the 2010 census, the population of Grand Junction was 58,566. The city has a population that is predominantly white (86.2%), with smaller percentages of Hispanic (7.7%), African American (2.2%), and Asian (1.3%) populations. The median household income in the city is $45,837, and the median age is 36.7 years.
Conclusion
Grand Junction is a vibrant city located in western Colorado, at the base of the Grand Mesa. The city is home to a diverse economy, with a mix of industries including agriculture, energy, manufacturing, tourism, and healthcare. The city has a population that is predominantly white, with smaller percentages of Hispanic, African American, and Asian populations. Grand Junction is a great place to live and work, with a thriving economy and a variety of attractions.
Common Questions
What is Per Capita Income in Grand Junction?
Per Capita income in Grand Junction is $37,017.
What is the Median Family Income in Grand Junction?
Median Family Income in Grand Junction is $83,721.
What is the Median Household income in Grand Junction?
Median Household Income in Grand Junction is $62,993.
What is Income or Wage Gap in Grand Junction?
Income or Wage Gap in Grand Junction is 25.3%.
Women in Grand Junction earn 74.7 cents for every dollar earned by a man.
What is Family Income Deficit in Grand Junction?
Family Income Deficit in Grand Junction is $9,875.
Families that are below poverty line in Grand Junction earn $9,875 less on average than the poverty threshold level.
What is Inequality or Gini Index in Grand Junction?
Inequality or Gini Index in Grand Junction is 0.45.
What is the Total Population of Grand Junction?
Total Population of Grand Junction is 65,918.
What is the Total Male Population of Grand Junction?
Total Male Population of Grand Junction is 33,145.
What is the Total Female Population of Grand Junction?
Total Female Population of Grand Junction is 32,773.
What is the Ratio of Males per 100 Females in Grand Junction?
There are 101.14 Males per 100 Females in Grand Junction.
What is the Ratio of Females per 100 Males in Grand Junction?
There are 98.88 Females per 100 Males in Grand Junction.
What is the Median Population Age in Grand Junction?
Median Population Age in Grand Junction is 39.9 Years.
What is the Average Family Size in Grand Junction
Average Family Size in Grand Junction is 2.9 People.
What is the Average Household Size in Grand Junction
Average Household Size in Grand Junction is 2.2 People.
How Large is the Labor Force in Grand Junction?
There are 33,655 People in the Labor Forcein in Grand Junction.
What is the Percentage of People in the Labor Force in Grand Junction?
61.2% of People are in the Labor Force in Grand Junction.
What is the Unemployment Rate in Grand Junction?
Unemployment Rate in Grand Junction is 4.7%.