Redlands, CO Map & Demographics
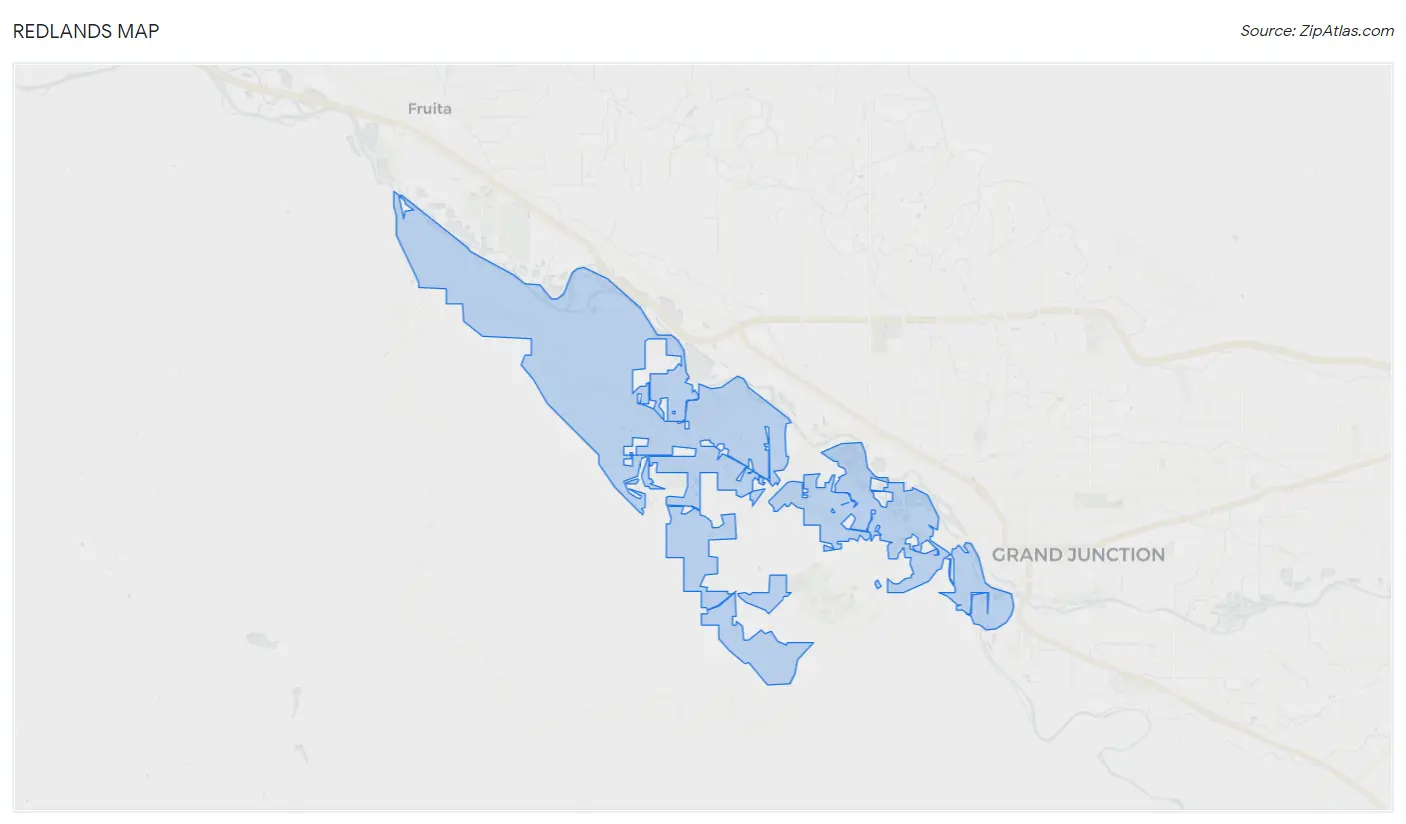
Redlands Map
Redlands Overview
$46,496
PER CAPITA INCOME
$108,814
AVG FAMILY INCOME
$93,223
AVG HOUSEHOLD INCOME
38.8%
WAGE / INCOME GAP [ % ]
61.2¢/ $1
WAGE / INCOME GAP [ $ ]
0.44
INEQUALITY / GINI INDEX
8,914
TOTAL POPULATION
4,275
MALE POPULATION
4,639
FEMALE POPULATION
92.15
MALES / 100 FEMALES
108.51
FEMALES / 100 MALES
48.5
MEDIAN AGE
3.0
AVG FAMILY SIZE
2.5
AVG HOUSEHOLD SIZE
3,921
LABOR FORCE [ PEOPLE ]
54.0%
PERCENT IN LABOR FORCE
3.6%
UNEMPLOYMENT RATE
Income in Redlands
Income Overview in Redlands
Per Capita Income in Redlands is $46,496, while median incomes of families and households are $108,814 and $93,223 respectively.
| Characteristic | Number | Measure |
| Per Capita Income | 8,914 | $46,496 |
| Median Family Income | 2,622 | $108,814 |
| Mean Family Income | 2,622 | $138,532 |
| Median Household Income | 3,474 | $93,223 |
| Mean Household Income | 3,474 | $117,614 |
| Income Deficit | 2,622 | $0 |
| Wage / Income Gap (%) | 8,914 | 38.78% |
| Wage / Income Gap ($) | 8,914 | 61.22¢ per $1 |
| Gini / Inequality Index | 8,914 | 0.44 |
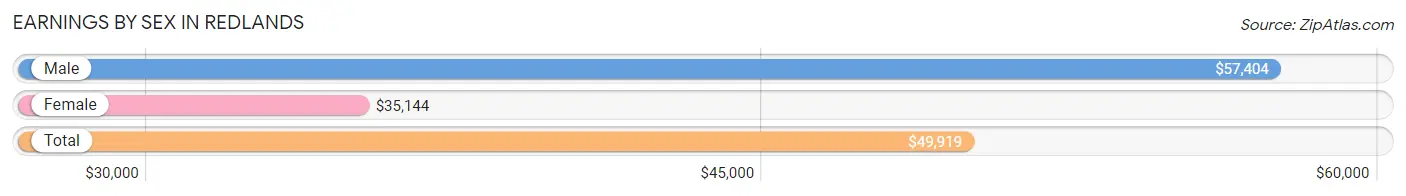
Earnings by Sex in Redlands
Average Earnings in Redlands are $49,919, $57,404 for men and $35,144 for women, a difference of 38.8%.
| Sex | Number | Average Earnings |
| Male | 2,358 (55.6%) | $57,404 |
| Female | 1,880 (44.4%) | $35,144 |
| Total | 4,238 (100.0%) | $49,919 |
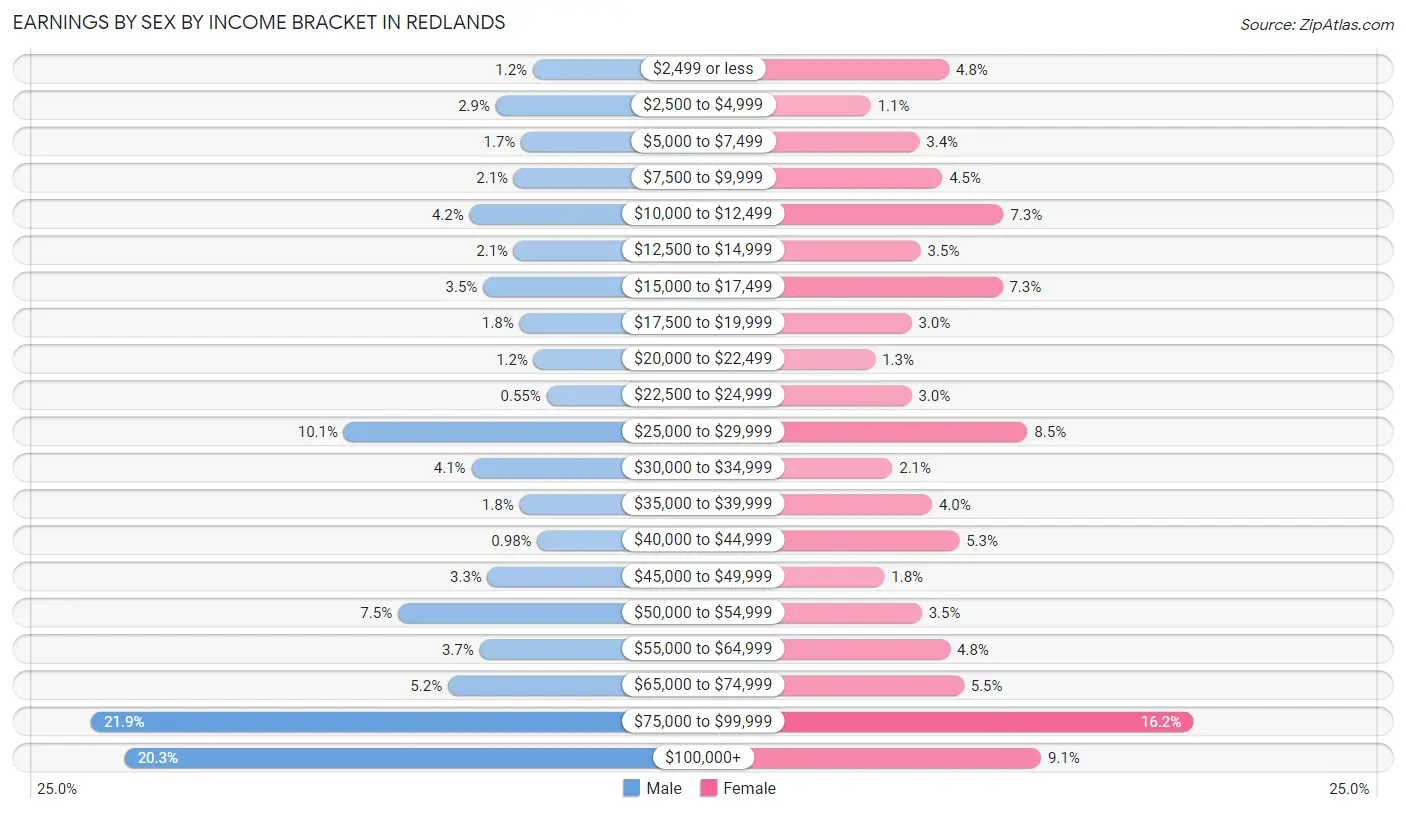
Earnings by Sex by Income Bracket in Redlands
The most common earnings brackets in Redlands are $75,000 to $99,999 for men (516 | 21.9%) and $75,000 to $99,999 for women (305 | 16.2%).
| Income | Male | Female |
| $2,499 or less | 28 (1.2%) | 90 (4.8%) |
| $2,500 to $4,999 | 69 (2.9%) | 21 (1.1%) |
| $5,000 to $7,499 | 41 (1.7%) | 64 (3.4%) |
| $7,500 to $9,999 | 49 (2.1%) | 84 (4.5%) |
| $10,000 to $12,499 | 98 (4.2%) | 138 (7.3%) |
| $12,500 to $14,999 | 49 (2.1%) | 65 (3.5%) |
| $15,000 to $17,499 | 83 (3.5%) | 137 (7.3%) |
| $17,500 to $19,999 | 43 (1.8%) | 57 (3.0%) |
| $20,000 to $22,499 | 27 (1.1%) | 25 (1.3%) |
| $22,500 to $24,999 | 13 (0.5%) | 57 (3.0%) |
| $25,000 to $29,999 | 237 (10.1%) | 159 (8.5%) |
| $30,000 to $34,999 | 96 (4.1%) | 40 (2.1%) |
| $35,000 to $39,999 | 43 (1.8%) | 75 (4.0%) |
| $40,000 to $44,999 | 23 (1.0%) | 99 (5.3%) |
| $45,000 to $49,999 | 78 (3.3%) | 33 (1.8%) |
| $50,000 to $54,999 | 177 (7.5%) | 66 (3.5%) |
| $55,000 to $64,999 | 87 (3.7%) | 91 (4.8%) |
| $65,000 to $74,999 | 122 (5.2%) | 103 (5.5%) |
| $75,000 to $99,999 | 516 (21.9%) | 305 (16.2%) |
| $100,000+ | 479 (20.3%) | 171 (9.1%) |
| Total | 2,358 (100.0%) | 1,880 (100.0%) |
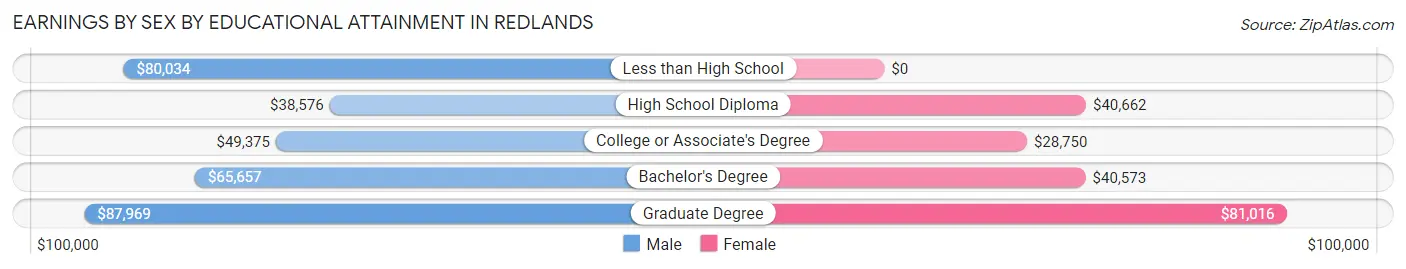
Earnings by Sex by Educational Attainment in Redlands
Average earnings in Redlands are $63,750 for men and $41,220 for women, a difference of 35.3%. Men with an educational attainment of graduate degree enjoy the highest average annual earnings of $87,969, while those with high school diploma education earn the least with $38,576. Women with an educational attainment of graduate degree earn the most with the average annual earnings of $81,016, while those with college or associate's degree education have the smallest earnings of $28,750.
| Educational Attainment | Male Income | Female Income |
| Less than High School | $80,034 | $0 |
| High School Diploma | $38,576 | $40,662 |
| College or Associate's Degree | $49,375 | $28,750 |
| Bachelor's Degree | $65,657 | $40,573 |
| Graduate Degree | $87,969 | $81,016 |
| Total | $63,750 | $41,220 |
Family Income in Redlands
Family Income Brackets in Redlands
According to the Redlands family income data, there are 711 families falling into the $100,000 to $149,999 income range, which is the most common income bracket and makes up 27.1% of all families.
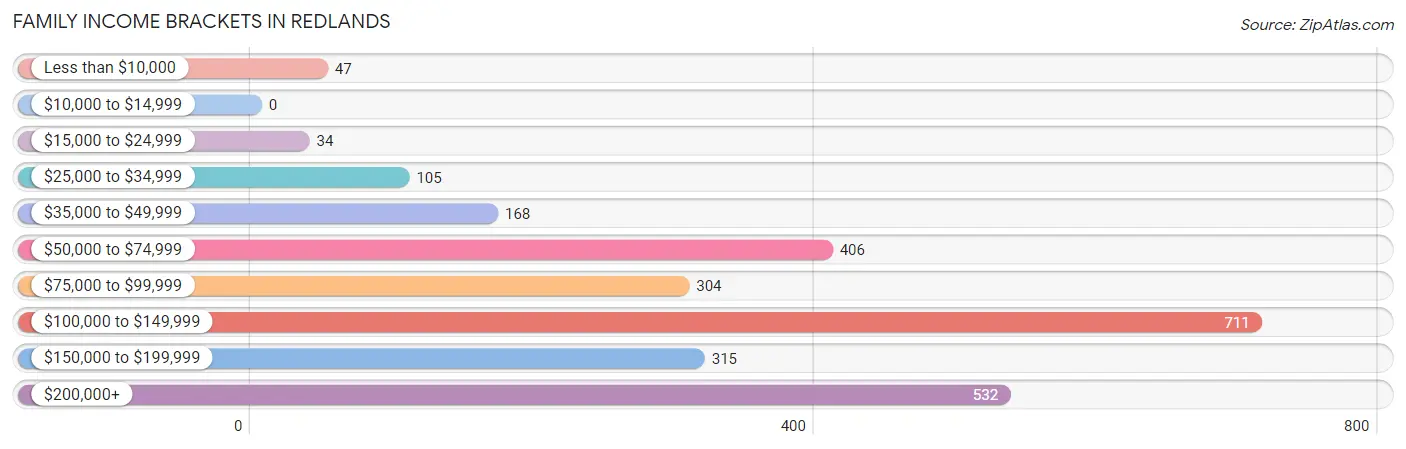
| Income Bracket | # Families | % Families |
| Less than $10,000 | 47 | 1.8% |
| $10,000 to $14,999 | 0 | 0.0% |
| $15,000 to $24,999 | 34 | 1.3% |
| $25,000 to $34,999 | 105 | 4.0% |
| $35,000 to $49,999 | 168 | 6.4% |
| $50,000 to $74,999 | 406 | 15.5% |
| $75,000 to $99,999 | 304 | 11.6% |
| $100,000 to $149,999 | 711 | 27.1% |
| $150,000 to $199,999 | 315 | 12.0% |
| $200,000+ | 532 | 20.3% |
Family Income by Famaliy Size in Redlands
6-person families (37 | 1.4%) account for the highest median family income in Redlands with $248,839 per family, while 2-person families (1,548 | 59.0%) have the highest median income of $47,763 per family member.
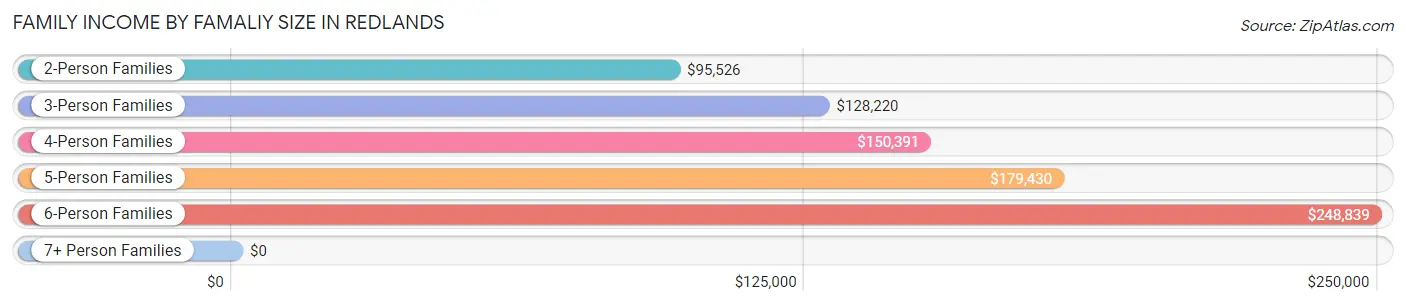
| Income Bracket | # Families | Median Income |
| 2-Person Families | 1,548 (59.0%) | $95,526 |
| 3-Person Families | 476 (18.1%) | $128,220 |
| 4-Person Families | 301 (11.5%) | $150,391 |
| 5-Person Families | 192 (7.3%) | $179,430 |
| 6-Person Families | 37 (1.4%) | $248,839 |
| 7+ Person Families | 68 (2.6%) | $0 |
| Total | 2,622 (100.0%) | $108,814 |
Family Income by Number of Earners in Redlands
The median family income in Redlands is $108,814, with families comprising 3+ earners (225) having the highest median family income of $210,795, while families with no earners (544) have the lowest median family income of $64,013, accounting for 8.6% and 20.7% of families, respectively.
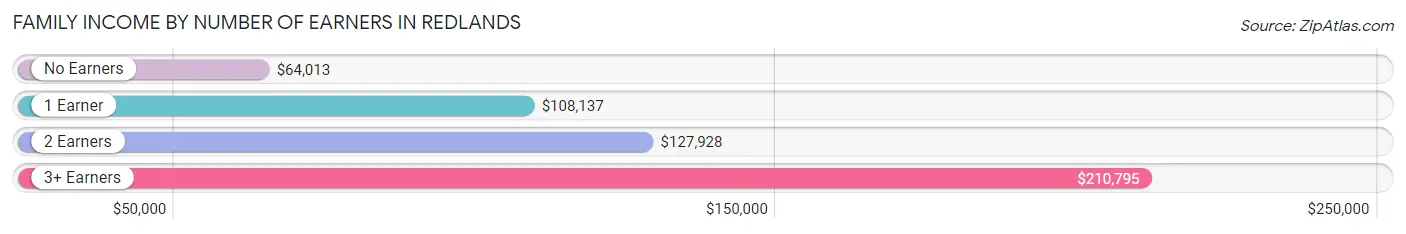
| Number of Earners | # Families | Median Income |
| No Earners | 544 (20.7%) | $64,013 |
| 1 Earner | 806 (30.7%) | $108,137 |
| 2 Earners | 1,047 (39.9%) | $127,928 |
| 3+ Earners | 225 (8.6%) | $210,795 |
| Total | 2,622 (100.0%) | $108,814 |
Household Income in Redlands
Household Income Brackets in Redlands
With 684 households falling in the category, the $100,000 to $149,999 income range is the most frequent in Redlands, accounting for 19.7% of all households. In contrast, only 66 households (1.9%) fall into the $10,000 to $14,999 income bracket, making it the least populous group.
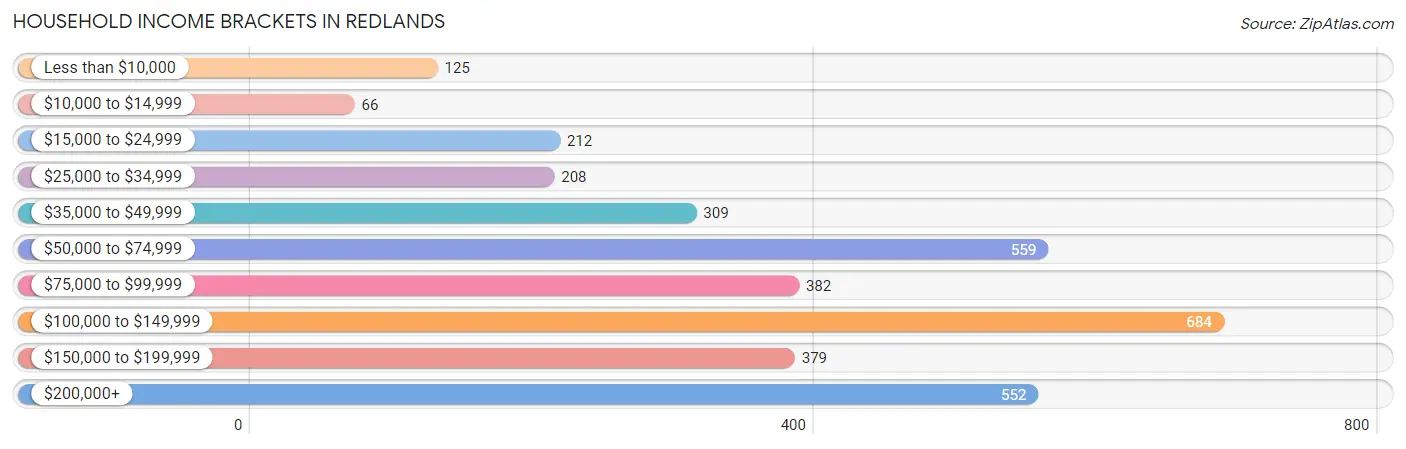
| Income Bracket | # Households | % Households |
| Less than $10,000 | 125 | 3.6% |
| $10,000 to $14,999 | 66 | 1.9% |
| $15,000 to $24,999 | 212 | 6.1% |
| $25,000 to $34,999 | 208 | 6.0% |
| $35,000 to $49,999 | 309 | 8.9% |
| $50,000 to $74,999 | 559 | 16.1% |
| $75,000 to $99,999 | 382 | 11.0% |
| $100,000 to $149,999 | 684 | 19.7% |
| $150,000 to $199,999 | 379 | 10.9% |
| $200,000+ | 552 | 15.9% |
Household Income by Householder Age in Redlands
The median household income in Redlands is $93,223, with the highest median household income of $120,000 found in the 25 to 44 years age bracket for the primary householder. A total of 810 households (23.3%) fall into this category. Meanwhile, the 15 to 24 years age bracket for the primary householder has the lowest median household income of $0, with 15 households (0.4%) in this group.
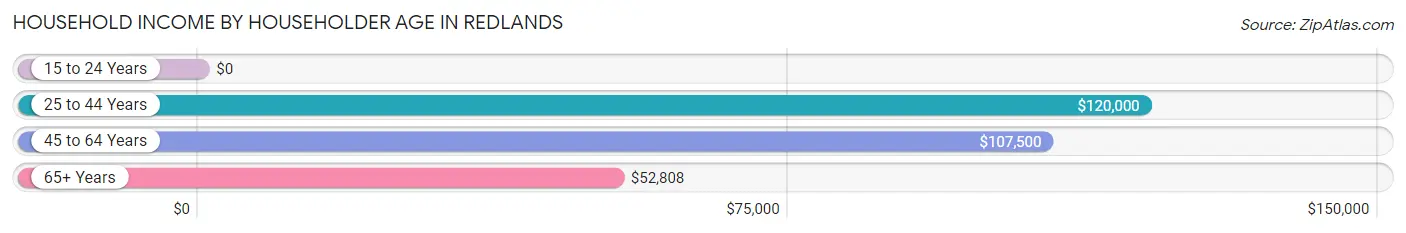
| Income Bracket | # Households | Median Income |
| 15 to 24 Years | 15 (0.4%) | $0 |
| 25 to 44 Years | 810 (23.3%) | $120,000 |
| 45 to 64 Years | 1,042 (30.0%) | $107,500 |
| 65+ Years | 1,607 (46.3%) | $52,808 |
| Total | 3,474 (100.0%) | $93,223 |
Poverty in Redlands
Income Below Poverty by Sex and Age in Redlands
With 3.4% poverty level for males and 6.3% for females among the residents of Redlands, 18 to 24 year old males and 75 year old and over females are the most vulnerable to poverty, with 17 males (13.4%) and 105 females (20.8%) in their respective age groups living below the poverty level.
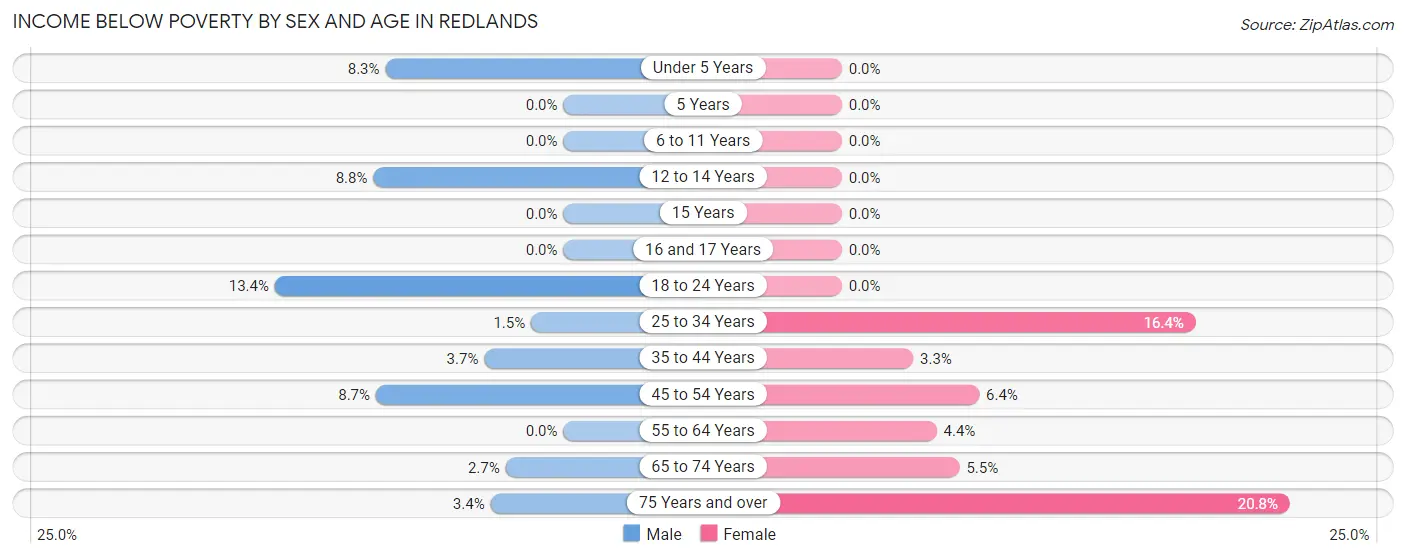
| Age Bracket | Male | Female |
| Under 5 Years | 19 (8.3%) | 0 (0.0%) |
| 5 Years | 0 (0.0%) | 0 (0.0%) |
| 6 to 11 Years | 0 (0.0%) | 0 (0.0%) |
| 12 to 14 Years | 15 (8.8%) | 0 (0.0%) |
| 15 Years | 0 (0.0%) | 0 (0.0%) |
| 16 and 17 Years | 0 (0.0%) | 0 (0.0%) |
| 18 to 24 Years | 17 (13.4%) | 0 (0.0%) |
| 25 to 34 Years | 9 (1.5%) | 56 (16.4%) |
| 35 to 44 Years | 22 (3.7%) | 16 (3.3%) |
| 45 to 54 Years | 26 (8.7%) | 24 (6.4%) |
| 55 to 64 Years | 0 (0.0%) | 32 (4.4%) |
| 65 to 74 Years | 21 (2.7%) | 58 (5.5%) |
| 75 Years and over | 16 (3.4%) | 105 (20.8%) |
| Total | 145 (3.4%) | 291 (6.3%) |
Income Above Poverty by Sex and Age in Redlands
According to the poverty statistics in Redlands, males aged 6 to 11 years and females aged under 5 years are the age groups that are most secure financially, with 100.0% of males and 100.0% of females in these age groups living above the poverty line.
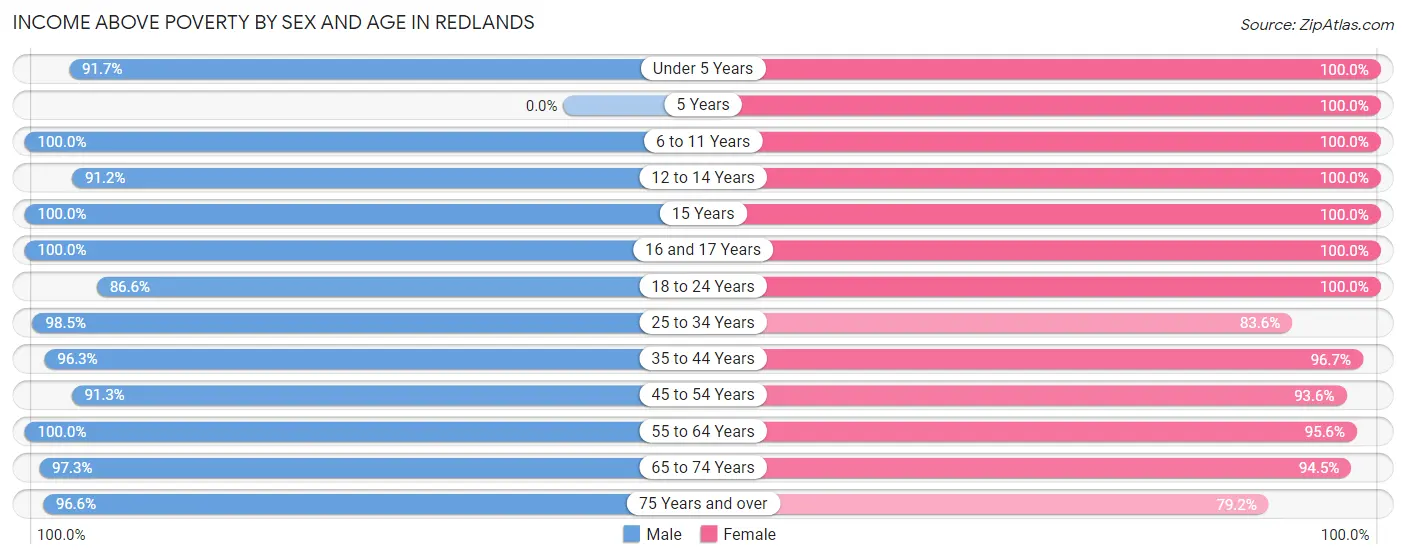
| Age Bracket | Male | Female |
| Under 5 Years | 211 (91.7%) | 149 (100.0%) |
| 5 Years | 0 (0.0%) | 91 (100.0%) |
| 6 to 11 Years | 418 (100.0%) | 390 (100.0%) |
| 12 to 14 Years | 155 (91.2%) | 144 (100.0%) |
| 15 Years | 25 (100.0%) | 35 (100.0%) |
| 16 and 17 Years | 42 (100.0%) | 134 (100.0%) |
| 18 to 24 Years | 110 (86.6%) | 200 (100.0%) |
| 25 to 34 Years | 593 (98.5%) | 285 (83.6%) |
| 35 to 44 Years | 578 (96.3%) | 467 (96.7%) |
| 45 to 54 Years | 273 (91.3%) | 353 (93.6%) |
| 55 to 64 Years | 504 (100.0%) | 695 (95.6%) |
| 65 to 74 Years | 763 (97.3%) | 1,005 (94.5%) |
| 75 Years and over | 458 (96.6%) | 400 (79.2%) |
| Total | 4,130 (96.6%) | 4,348 (93.7%) |
Income Below Poverty Among Married-Couple Families in Redlands
The poverty statistics for married-couple families in Redlands show that 0.9% or 21 of the total 2,343 families live below the poverty line. Families with no children have the highest poverty rate of 1.3%, comprising of 21 families. On the other hand, families with 1 or 2 children have the lowest poverty rate of 0.0%, which includes 0 families.
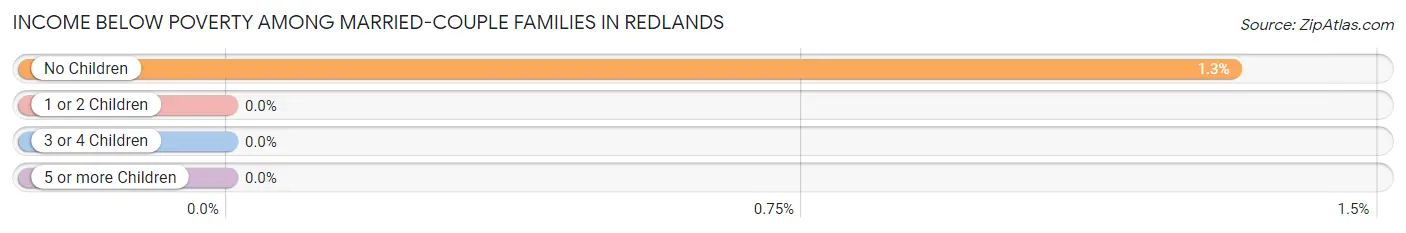
| Children | Above Poverty | Below Poverty |
| No Children | 1,581 (98.7%) | 21 (1.3%) |
| 1 or 2 Children | 528 (100.0%) | 0 (0.0%) |
| 3 or 4 Children | 213 (100.0%) | 0 (0.0%) |
| 5 or more Children | 0 (0.0%) | 0 (0.0%) |
| Total | 2,322 (99.1%) | 21 (0.9%) |
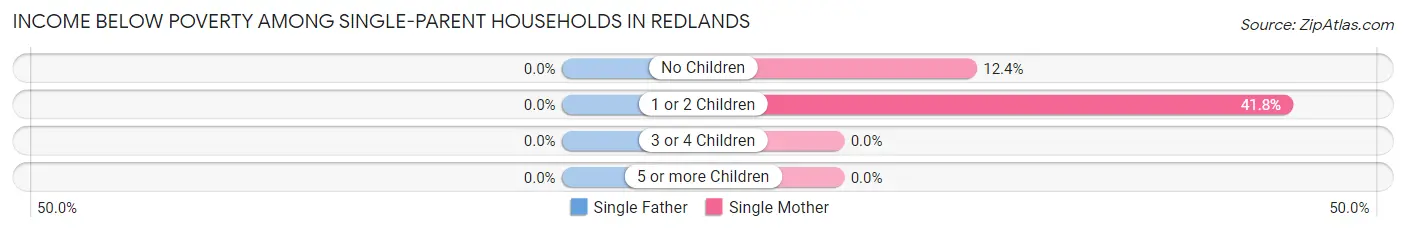
Income Below Poverty Among Single-Parent Households in Redlands
| Children | Single Father | Single Mother |
| No Children | 0 (0.0%) | 10 (12.3%) |
| 1 or 2 Children | 0 (0.0%) | 41 (41.8%) |
| 3 or 4 Children | 0 (0.0%) | 0 (0.0%) |
| 5 or more Children | 0 (0.0%) | 0 (0.0%) |
| Total | 0 (0.0%) | 51 (28.5%) |
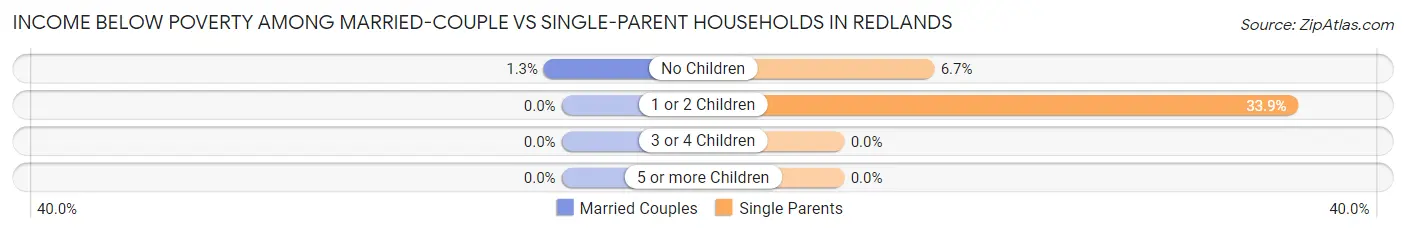
Income Below Poverty Among Married-Couple vs Single-Parent Households in Redlands
The poverty data for Redlands shows that 21 of the married-couple family households (0.9%) and 51 of the single-parent households (18.3%) are living below the poverty level. Within the married-couple family households, those with no children have the highest poverty rate, with 21 households (1.3%) falling below the poverty line. Among the single-parent households, those with 1 or 2 children have the highest poverty rate, with 41 household (33.9%) living below poverty.
| Children | Married-Couple Families | Single-Parent Households |
| No Children | 21 (1.3%) | 10 (6.7%) |
| 1 or 2 Children | 0 (0.0%) | 41 (33.9%) |
| 3 or 4 Children | 0 (0.0%) | 0 (0.0%) |
| 5 or more Children | 0 (0.0%) | 0 (0.0%) |
| Total | 21 (0.9%) | 51 (18.3%) |
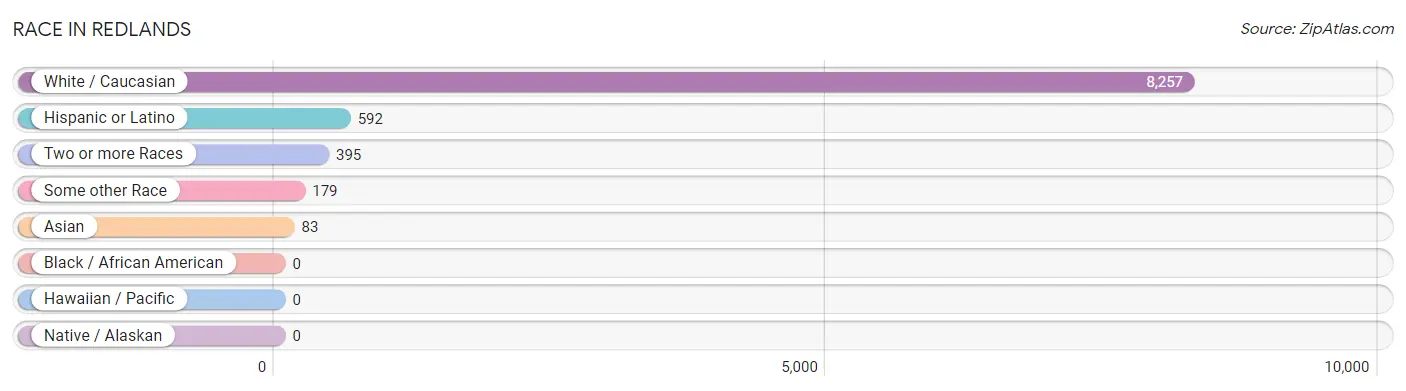
Race in Redlands
The most populous races in Redlands are White / Caucasian (8,257 | 92.6%), Hispanic or Latino (592 | 6.6%), and Two or more Races (395 | 4.4%).
| Race | # Population | % Population |
| Asian | 83 | 0.9% |
| Black / African American | 0 | 0.0% |
| Hawaiian / Pacific | 0 | 0.0% |
| Hispanic or Latino | 592 | 6.6% |
| Native / Alaskan | 0 | 0.0% |
| White / Caucasian | 8,257 | 92.6% |
| Two or more Races | 395 | 4.4% |
| Some other Race | 179 | 2.0% |
| Total | 8,914 | 100.0% |
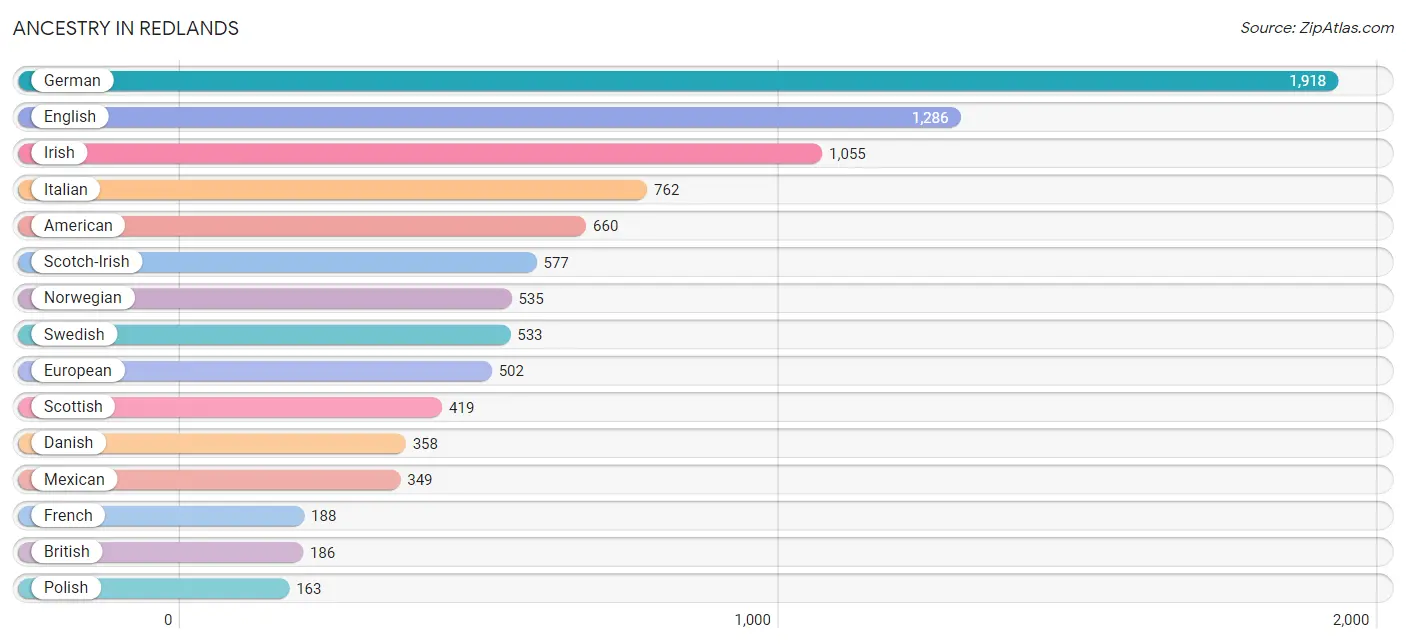
Ancestry in Redlands
The most populous ancestries reported in Redlands are German (1,918 | 21.5%), English (1,286 | 14.4%), Irish (1,055 | 11.8%), Italian (762 | 8.6%), and American (660 | 7.4%), together accounting for 63.7% of all Redlands residents.
| Ancestry | # Population | % Population |
| American | 660 | 7.4% |
| Arab | 3 | 0.0% |
| Argentinean | 128 | 1.4% |
| Austrian | 9 | 0.1% |
| Bhutanese | 117 | 1.3% |
| British | 186 | 2.1% |
| Burmese | 15 | 0.2% |
| Central American | 22 | 0.3% |
| Costa Rican | 22 | 0.3% |
| Croatian | 14 | 0.2% |
| Czech | 61 | 0.7% |
| Czechoslovakian | 45 | 0.5% |
| Danish | 358 | 4.0% |
| Dutch | 139 | 1.6% |
| Eastern European | 8 | 0.1% |
| English | 1,286 | 14.4% |
| European | 502 | 5.6% |
| Finnish | 9 | 0.1% |
| French | 188 | 2.1% |
| French Canadian | 77 | 0.9% |
| German | 1,918 | 21.5% |
| Greek | 38 | 0.4% |
| Hungarian | 20 | 0.2% |
| Indian (Asian) | 47 | 0.5% |
| Irish | 1,055 | 11.8% |
| Italian | 762 | 8.6% |
| Korean | 31 | 0.4% |
| Mexican | 349 | 3.9% |
| Northern European | 29 | 0.3% |
| Norwegian | 535 | 6.0% |
| Polish | 163 | 1.8% |
| Portuguese | 33 | 0.4% |
| Romanian | 27 | 0.3% |
| Russian | 11 | 0.1% |
| Scandinavian | 34 | 0.4% |
| Scotch-Irish | 577 | 6.5% |
| Scottish | 419 | 4.7% |
| Slovene | 18 | 0.2% |
| South American | 128 | 1.4% |
| Spanish American | 50 | 0.6% |
| Swedish | 533 | 6.0% |
| Swiss | 14 | 0.2% |
| Ukrainian | 11 | 0.1% |
| Welsh | 152 | 1.7% |
| Yugoslavian | 45 | 0.5% | View All 45 Rows |
Immigrants in Redlands
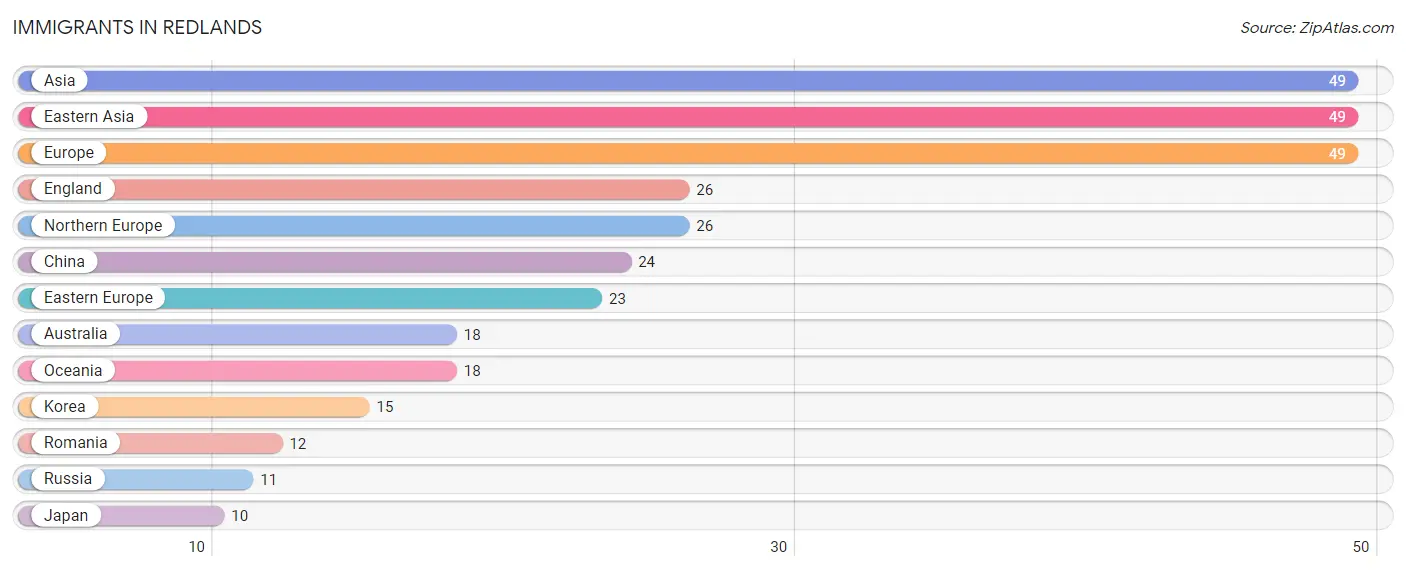
The most numerous immigrant groups reported in Redlands came from Asia (49 | 0.5%), Eastern Asia (49 | 0.5%), Europe (49 | 0.5%), England (26 | 0.3%), and Northern Europe (26 | 0.3%), together accounting for 2.2% of all Redlands residents.
| Immigration Origin | # Population | % Population |
| Asia | 49 | 0.5% |
| Australia | 18 | 0.2% |
| China | 24 | 0.3% |
| Eastern Asia | 49 | 0.5% |
| Eastern Europe | 23 | 0.3% |
| England | 26 | 0.3% |
| Europe | 49 | 0.5% |
| Japan | 10 | 0.1% |
| Korea | 15 | 0.2% |
| Northern Europe | 26 | 0.3% |
| Oceania | 18 | 0.2% |
| Romania | 12 | 0.1% |
| Russia | 11 | 0.1% | View All 13 Rows |
Sex and Age in Redlands
Sex and Age in Redlands
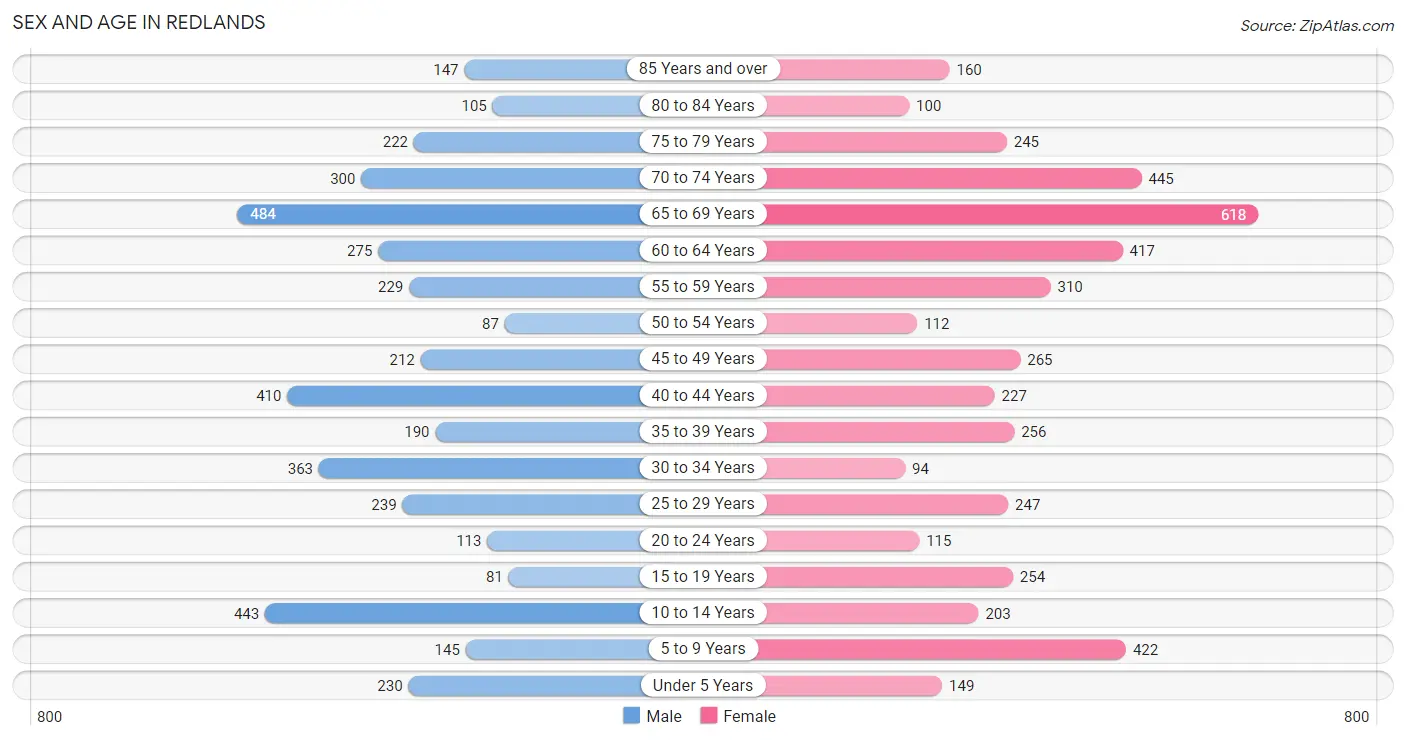
The most populous age groups in Redlands are 65 to 69 Years (484 | 11.3%) for men and 65 to 69 Years (618 | 13.3%) for women.
| Age Bracket | Male | Female |
| Under 5 Years | 230 (5.4%) | 149 (3.2%) |
| 5 to 9 Years | 145 (3.4%) | 422 (9.1%) |
| 10 to 14 Years | 443 (10.4%) | 203 (4.4%) |
| 15 to 19 Years | 81 (1.9%) | 254 (5.5%) |
| 20 to 24 Years | 113 (2.6%) | 115 (2.5%) |
| 25 to 29 Years | 239 (5.6%) | 247 (5.3%) |
| 30 to 34 Years | 363 (8.5%) | 94 (2.0%) |
| 35 to 39 Years | 190 (4.4%) | 256 (5.5%) |
| 40 to 44 Years | 410 (9.6%) | 227 (4.9%) |
| 45 to 49 Years | 212 (5.0%) | 265 (5.7%) |
| 50 to 54 Years | 87 (2.0%) | 112 (2.4%) |
| 55 to 59 Years | 229 (5.4%) | 310 (6.7%) |
| 60 to 64 Years | 275 (6.4%) | 417 (9.0%) |
| 65 to 69 Years | 484 (11.3%) | 618 (13.3%) |
| 70 to 74 Years | 300 (7.0%) | 445 (9.6%) |
| 75 to 79 Years | 222 (5.2%) | 245 (5.3%) |
| 80 to 84 Years | 105 (2.5%) | 100 (2.2%) |
| 85 Years and over | 147 (3.4%) | 160 (3.5%) |
| Total | 4,275 (100.0%) | 4,639 (100.0%) |
Families and Households in Redlands
Median Family Size in Redlands
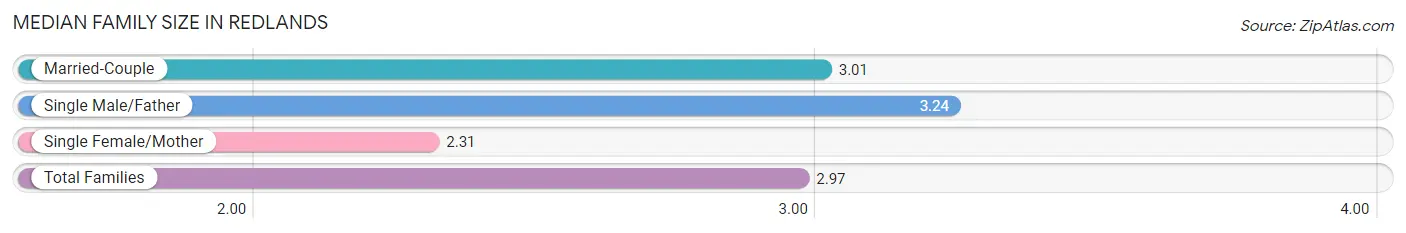
The median family size in Redlands is 2.97 persons per family, with single male/father families (100 | 3.8%) accounting for the largest median family size of 3.24 persons per family. On the other hand, single female/mother families (179 | 6.8%) represent the smallest median family size with 2.31 persons per family.
| Family Type | # Families | Family Size |
| Married-Couple | 2,343 (89.4%) | 3.01 |
| Single Male/Father | 100 (3.8%) | 3.24 |
| Single Female/Mother | 179 (6.8%) | 2.31 |
| Total Families | 2,622 (100.0%) | 2.97 |
Median Household Size in Redlands
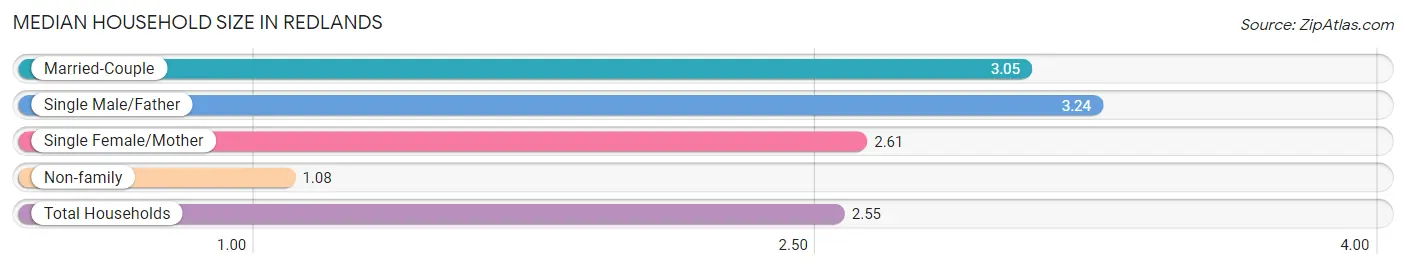
The median household size in Redlands is 2.55 persons per household, with single male/father households (100 | 2.9%) accounting for the largest median household size of 3.24 persons per household. non-family households (852 | 24.5%) represent the smallest median household size with 1.08 persons per household.
| Household Type | # Households | Household Size |
| Married-Couple | 2,343 (67.4%) | 3.05 |
| Single Male/Father | 100 (2.9%) | 3.24 |
| Single Female/Mother | 179 (5.1%) | 2.61 |
| Non-family | 852 (24.5%) | 1.08 |
| Total Households | 3,474 (100.0%) | 2.55 |
Household Size by Marriage Status in Redlands
Out of a total of 3,474 households in Redlands, 2,622 (75.5%) are family households, while 852 (24.5%) are nonfamily households. The most numerous type of family households are 2-person households, comprising 1,489, and the most common type of nonfamily households are 1-person households, comprising 796.
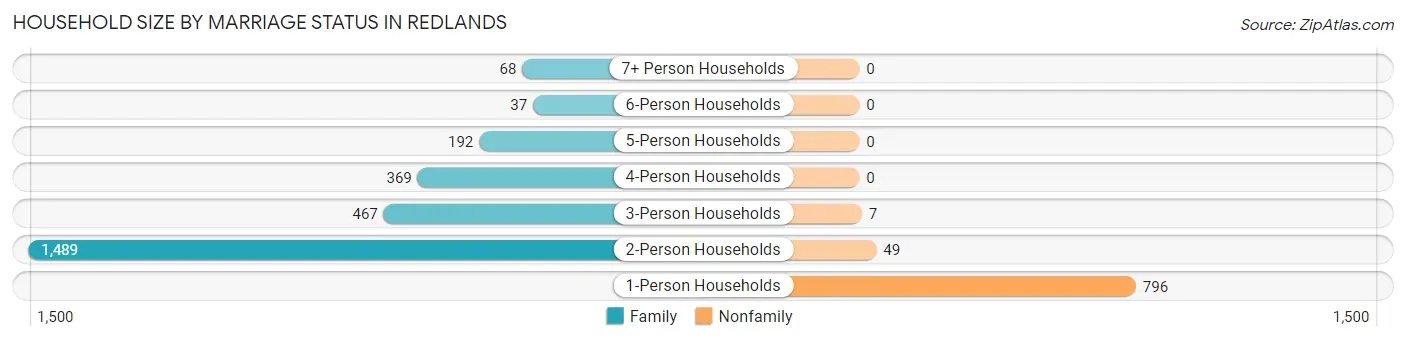
| Household Size | Family Households | Nonfamily Households |
| 1-Person Households | - | 796 (22.9%) |
| 2-Person Households | 1,489 (42.9%) | 49 (1.4%) |
| 3-Person Households | 467 (13.4%) | 7 (0.2%) |
| 4-Person Households | 369 (10.6%) | 0 (0.0%) |
| 5-Person Households | 192 (5.5%) | 0 (0.0%) |
| 6-Person Households | 37 (1.1%) | 0 (0.0%) |
| 7+ Person Households | 68 (2.0%) | 0 (0.0%) |
| Total | 2,622 (75.5%) | 852 (24.5%) |
Female Fertility in Redlands
Fertility by Age in Redlands
Average fertility rate in Redlands is 21.0 births per 1,000 women. Women in the age bracket of 20 to 34 years have the highest fertility rate with 68.0 births per 1,000 women. Women in the age bracket of 20 to 34 years acount for 100.0% of all women with births.
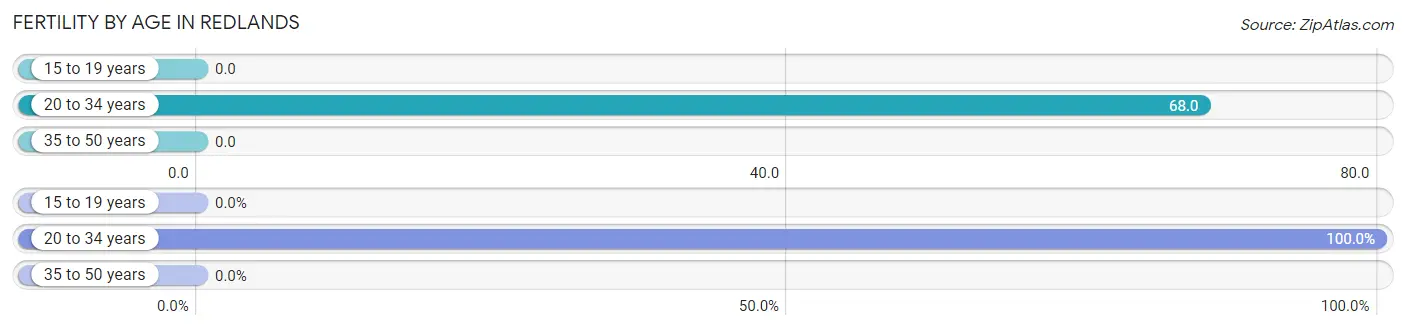
| Age Bracket | Women with Births | Births / 1,000 Women |
| 15 to 19 years | 0 (0.0%) | 0.0 |
| 20 to 34 years | 31 (100.0%) | 68.0 |
| 35 to 50 years | 0 (0.0%) | 0.0 |
| Total | 31 (100.0%) | 21.0 |
Fertility by Age by Marriage Status in Redlands
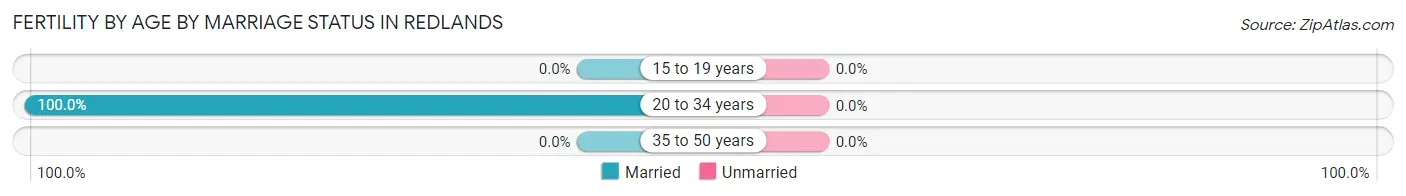
| Age Bracket | Married | Unmarried |
| 15 to 19 years | 0 (0.0%) | 0 (0.0%) |
| 20 to 34 years | 31 (100.0%) | 0 (0.0%) |
| 35 to 50 years | 0 (0.0%) | 0 (0.0%) |
| Total | 31 (100.0%) | 0 (0.0%) |
Fertility by Education in Redlands
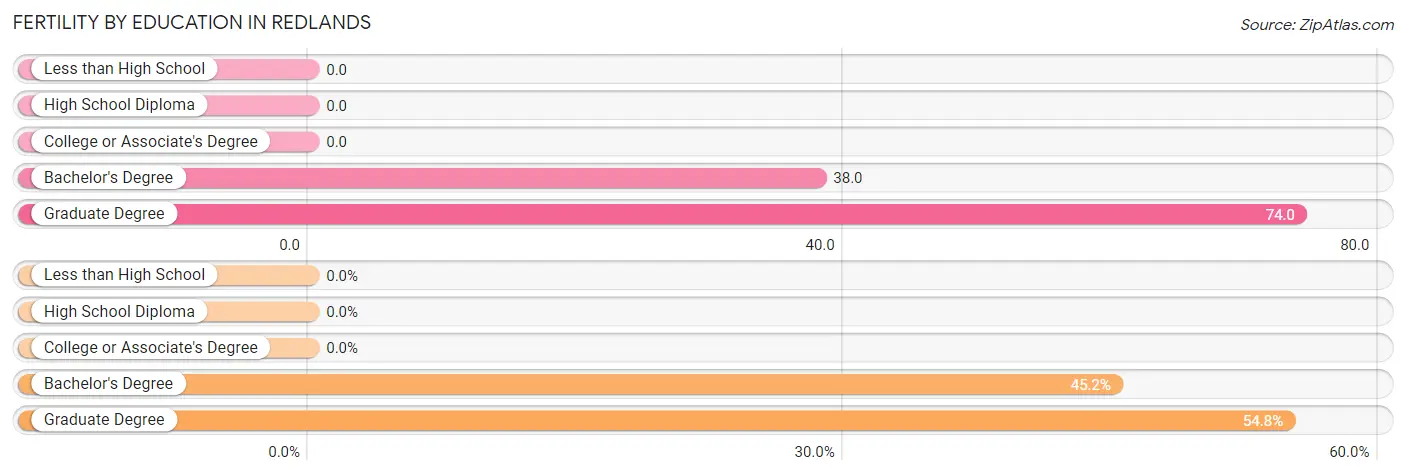
| Educational Attainment | Women with Births | Births / 1,000 Women |
| Less than High School | 0 (0.0%) | 0.0 |
| High School Diploma | 0 (0.0%) | 0.0 |
| College or Associate's Degree | 0 (0.0%) | 0.0 |
| Bachelor's Degree | 14 (45.2%) | 38.0 |
| Graduate Degree | 17 (54.8%) | 74.0 |
| Total | 31 (100.0%) | 21.0 |
Fertility by Education by Marriage Status in Redlands
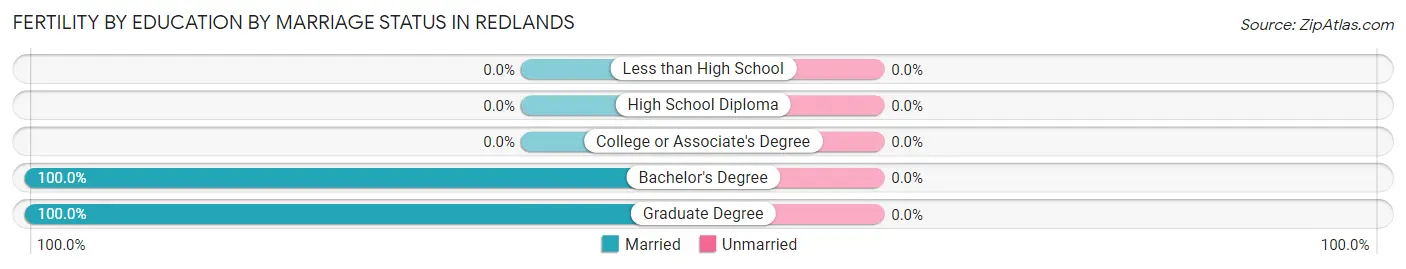
| Educational Attainment | Married | Unmarried |
| Less than High School | 0 (0.0%) | 0 (0.0%) |
| High School Diploma | 0 (0.0%) | 0 (0.0%) |
| College or Associate's Degree | 0 (0.0%) | 0 (0.0%) |
| Bachelor's Degree | 14 (100.0%) | 0 (0.0%) |
| Graduate Degree | 17 (100.0%) | 0 (0.0%) |
| Total | 31 (100.0%) | 0 (0.0%) |
Employment Characteristics in Redlands
Employment by Class of Employer in Redlands
Among the 3,780 employed individuals in Redlands, private company employees (1,900 | 50.3%), self-employed (not incorporated) (446 | 11.8%), and not-for-profit organizations (435 | 11.5%) make up the most common classes of employment.
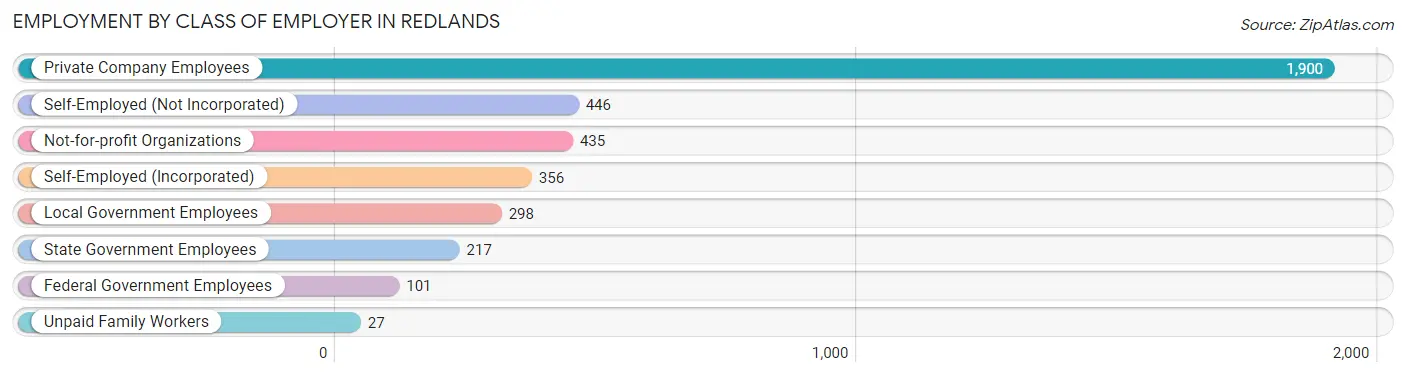
| Employer Class | # Employees | % Employees |
| Private Company Employees | 1,900 | 50.3% |
| Self-Employed (Incorporated) | 356 | 9.4% |
| Self-Employed (Not Incorporated) | 446 | 11.8% |
| Not-for-profit Organizations | 435 | 11.5% |
| Local Government Employees | 298 | 7.9% |
| State Government Employees | 217 | 5.7% |
| Federal Government Employees | 101 | 2.7% |
| Unpaid Family Workers | 27 | 0.7% |
| Total | 3,780 | 100.0% |
Employment Status by Age in Redlands
According to the labor force statistics for Redlands, out of the total population over 16 years of age (7,262), 54.0% or 3,921 individuals are in the labor force, with 3.6% or 141 of them unemployed. The age group with the highest labor force participation rate is 30 to 34 years, with 90.8% or 415 individuals in the labor force. Within the labor force, the 20 to 24 years age range has the highest percentage of unemployed individuals, with 29.1% or 59 of them being unemployed.
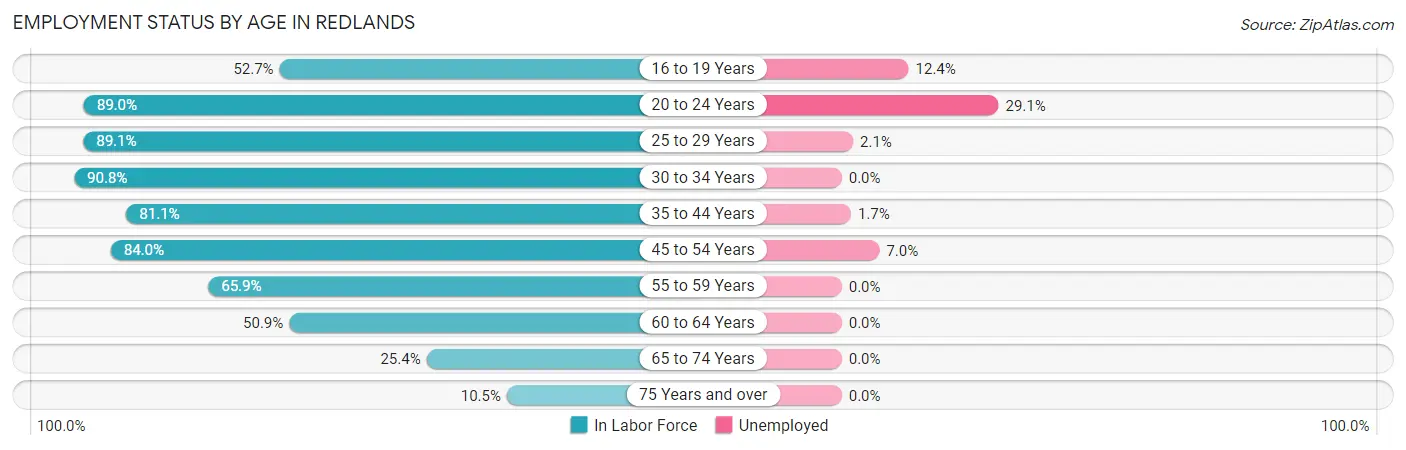
| Age Bracket | In Labor Force | Unemployed |
| 16 to 19 Years | 145 (52.7%) | 18 (12.4%) |
| 20 to 24 Years | 203 (89.0%) | 59 (29.1%) |
| 25 to 29 Years | 433 (89.1%) | 9 (2.1%) |
| 30 to 34 Years | 415 (90.8%) | 0 (0.0%) |
| 35 to 44 Years | 878 (81.1%) | 15 (1.7%) |
| 45 to 54 Years | 568 (84.0%) | 40 (7.0%) |
| 55 to 59 Years | 355 (65.9%) | 0 (0.0%) |
| 60 to 64 Years | 352 (50.9%) | 0 (0.0%) |
| 65 to 74 Years | 469 (25.4%) | 0 (0.0%) |
| 75 Years and over | 103 (10.5%) | 0 (0.0%) |
| Total | 3,921 (54.0%) | 141 (3.6%) |
Employment Status by Educational Attainment in Redlands
According to labor force statistics for Redlands, 76.3% of individuals (3,001) out of the total population between 25 and 64 years of age (3,933) are in the labor force, with 2.1% or 63 of them being unemployed. The group with the highest labor force participation rate are those with the educational attainment of bachelor's degree or higher, with 82.0% or 1,782 individuals in the labor force. Within the labor force, individuals with high school diploma education have the highest percentage of unemployment, with 4.8% or 16 of them being unemployed.
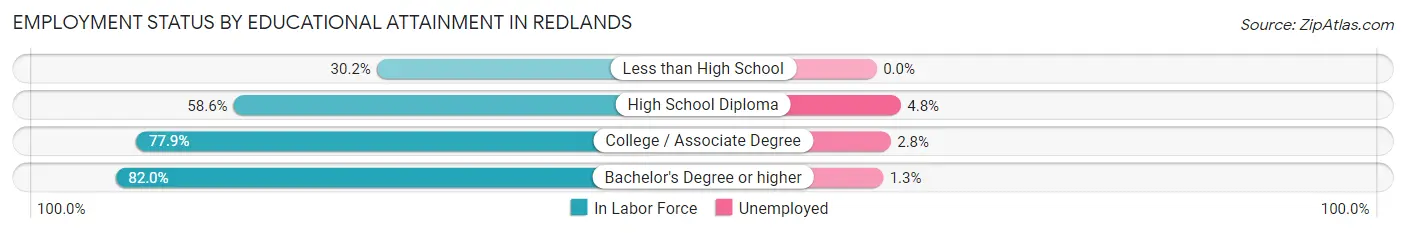
| Educational Attainment | In Labor Force | Unemployed |
| Less than High School | 26 (30.2%) | 0 (0.0%) |
| High School Diploma | 335 (58.6%) | 27 (4.8%) |
| College / Associate Degree | 858 (77.9%) | 31 (2.8%) |
| Bachelor's Degree or higher | 1,782 (82.0%) | 28 (1.3%) |
| Total | 3,001 (76.3%) | 83 (2.1%) |
Employment Occupations by Sex in Redlands
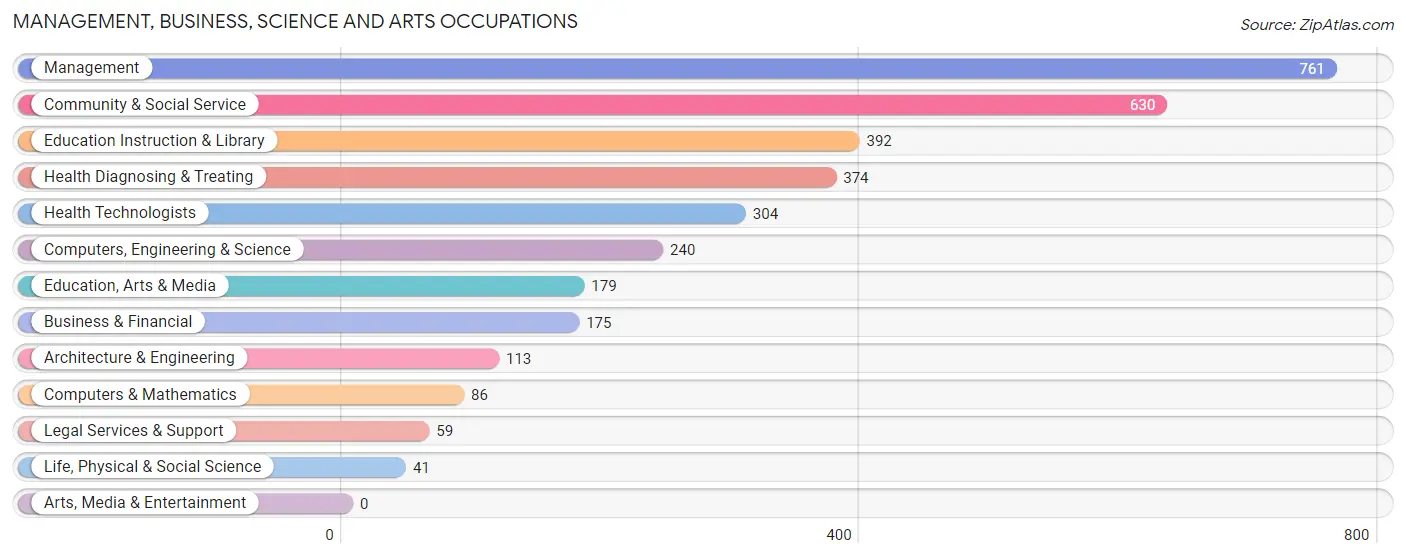
Management, Business, Science and Arts Occupations
The most common Management, Business, Science and Arts occupations in Redlands are Management (761 | 20.1%), Community & Social Service (630 | 16.7%), Education Instruction & Library (392 | 10.4%), Health Diagnosing & Treating (374 | 9.9%), and Health Technologists (304 | 8.0%).
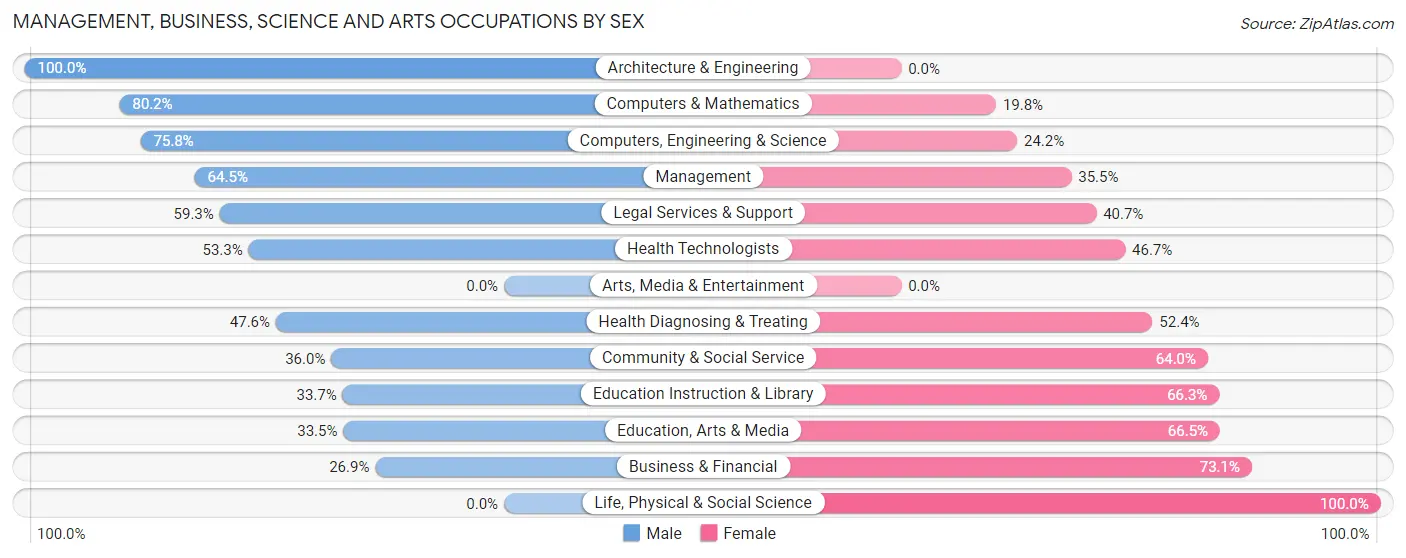
Management, Business, Science and Arts Occupations by Sex
Within the Management, Business, Science and Arts occupations in Redlands, the most male-oriented occupations are Architecture & Engineering (100.0%), Computers & Mathematics (80.2%), and Computers, Engineering & Science (75.8%), while the most female-oriented occupations are Life, Physical & Social Science (100.0%), Business & Financial (73.1%), and Education, Arts & Media (66.5%).
| Occupation | Male | Female |
| Management | 491 (64.5%) | 270 (35.5%) |
| Business & Financial | 47 (26.9%) | 128 (73.1%) |
| Computers, Engineering & Science | 182 (75.8%) | 58 (24.2%) |
| Computers & Mathematics | 69 (80.2%) | 17 (19.8%) |
| Architecture & Engineering | 113 (100.0%) | 0 (0.0%) |
| Life, Physical & Social Science | 0 (0.0%) | 41 (100.0%) |
| Community & Social Service | 227 (36.0%) | 403 (64.0%) |
| Education, Arts & Media | 60 (33.5%) | 119 (66.5%) |
| Legal Services & Support | 35 (59.3%) | 24 (40.7%) |
| Education Instruction & Library | 132 (33.7%) | 260 (66.3%) |
| Arts, Media & Entertainment | 0 (0.0%) | 0 (0.0%) |
| Health Diagnosing & Treating | 178 (47.6%) | 196 (52.4%) |
| Health Technologists | 162 (53.3%) | 142 (46.7%) |
| Total (Category) | 1,125 (51.6%) | 1,055 (48.4%) |
| Total (Overall) | 2,054 (54.3%) | 1,726 (45.7%) |
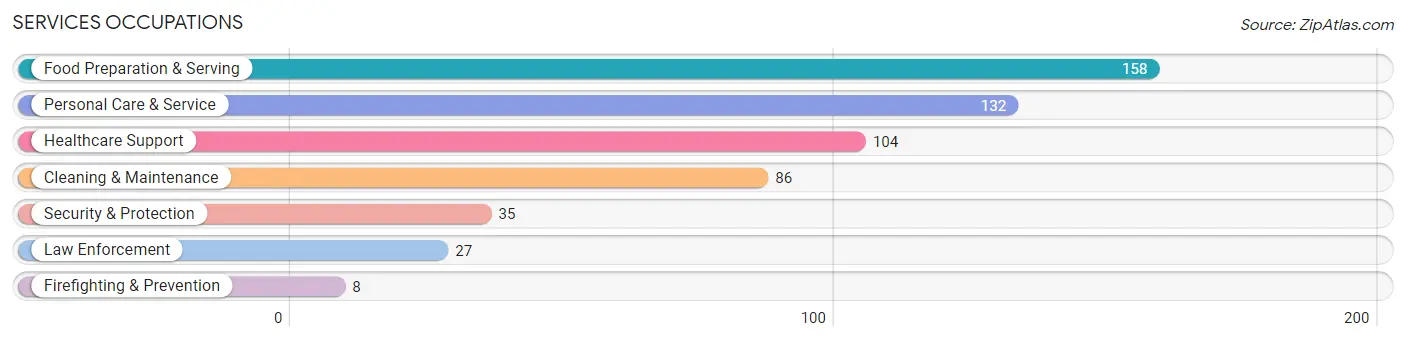
Services Occupations
The most common Services occupations in Redlands are Food Preparation & Serving (158 | 4.2%), Personal Care & Service (132 | 3.5%), Healthcare Support (104 | 2.8%), Cleaning & Maintenance (86 | 2.3%), and Security & Protection (35 | 0.9%).
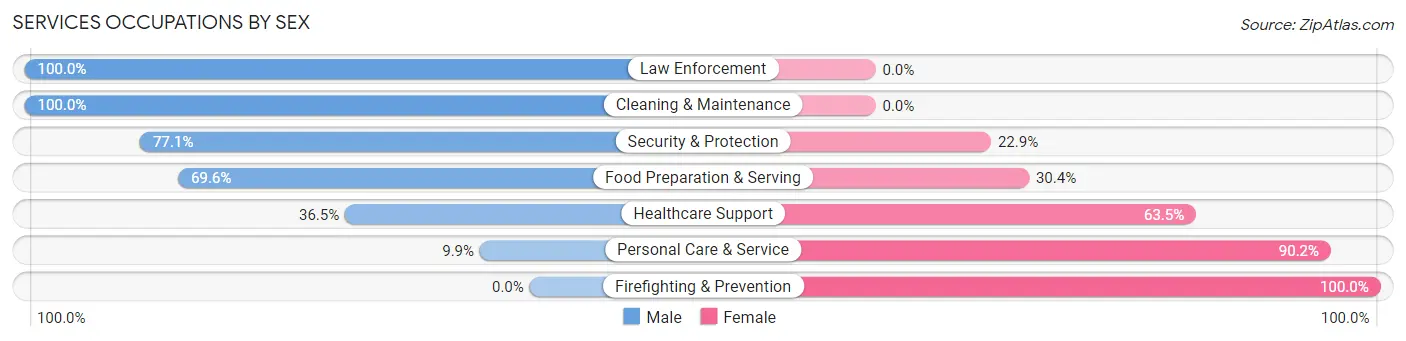
Services Occupations by Sex
Within the Services occupations in Redlands, the most male-oriented occupations are Law Enforcement (100.0%), Cleaning & Maintenance (100.0%), and Security & Protection (77.1%), while the most female-oriented occupations are Firefighting & Prevention (100.0%), Personal Care & Service (90.1%), and Healthcare Support (63.5%).
| Occupation | Male | Female |
| Healthcare Support | 38 (36.5%) | 66 (63.5%) |
| Security & Protection | 27 (77.1%) | 8 (22.9%) |
| Firefighting & Prevention | 0 (0.0%) | 8 (100.0%) |
| Law Enforcement | 27 (100.0%) | 0 (0.0%) |
| Food Preparation & Serving | 110 (69.6%) | 48 (30.4%) |
| Cleaning & Maintenance | 86 (100.0%) | 0 (0.0%) |
| Personal Care & Service | 13 (9.9%) | 119 (90.1%) |
| Total (Category) | 274 (53.2%) | 241 (46.8%) |
| Total (Overall) | 2,054 (54.3%) | 1,726 (45.7%) |
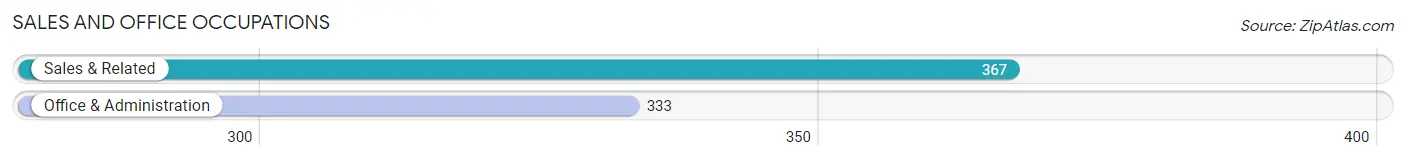
Sales and Office Occupations
The most common Sales and Office occupations in Redlands are Sales & Related (367 | 9.7%), and Office & Administration (333 | 8.8%).
Sales and Office Occupations by Sex
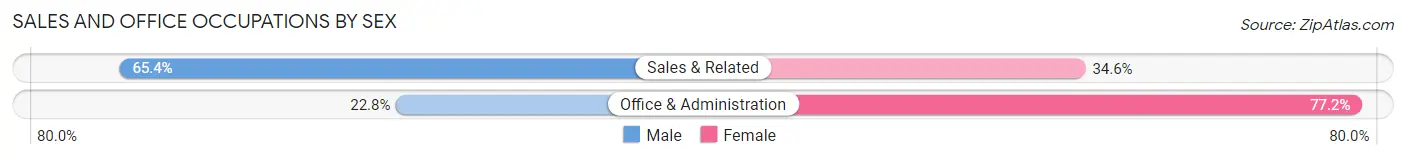
| Occupation | Male | Female |
| Sales & Related | 240 (65.4%) | 127 (34.6%) |
| Office & Administration | 76 (22.8%) | 257 (77.2%) |
| Total (Category) | 316 (45.1%) | 384 (54.9%) |
| Total (Overall) | 2,054 (54.3%) | 1,726 (45.7%) |
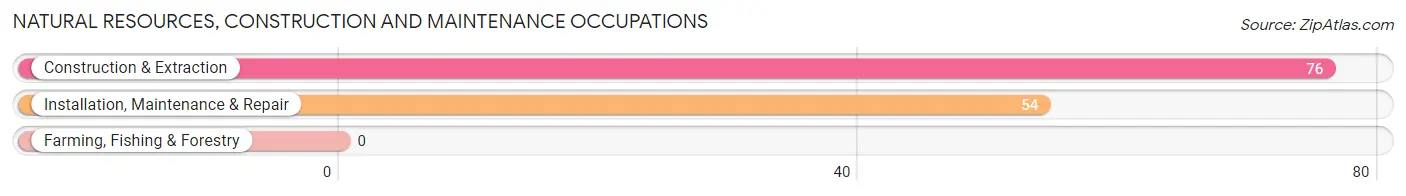
Natural Resources, Construction and Maintenance Occupations
The most common Natural Resources, Construction and Maintenance occupations in Redlands are Construction & Extraction (76 | 2.0%), and Installation, Maintenance & Repair (54 | 1.4%).
Natural Resources, Construction and Maintenance Occupations by Sex
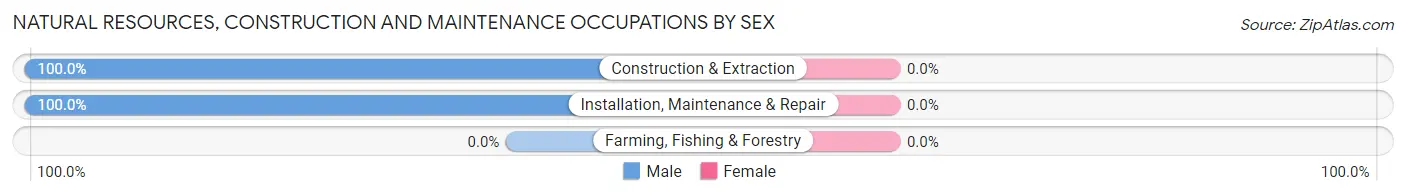
| Occupation | Male | Female |
| Farming, Fishing & Forestry | 0 (0.0%) | 0 (0.0%) |
| Construction & Extraction | 76 (100.0%) | 0 (0.0%) |
| Installation, Maintenance & Repair | 54 (100.0%) | 0 (0.0%) |
| Total (Category) | 130 (100.0%) | 0 (0.0%) |
| Total (Overall) | 2,054 (54.3%) | 1,726 (45.7%) |
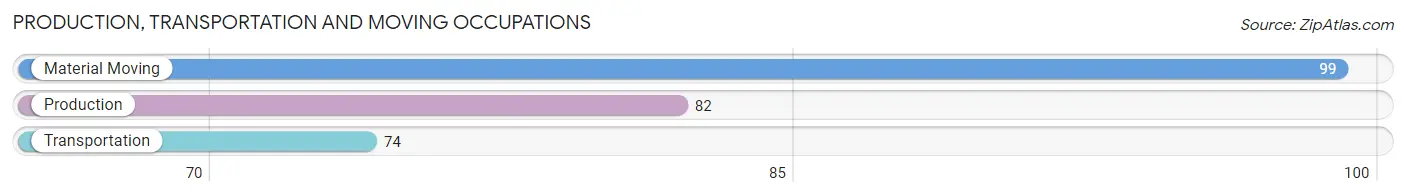
Production, Transportation and Moving Occupations
The most common Production, Transportation and Moving occupations in Redlands are Material Moving (99 | 2.6%), Production (82 | 2.2%), and Transportation (74 | 2.0%).
Production, Transportation and Moving Occupations by Sex
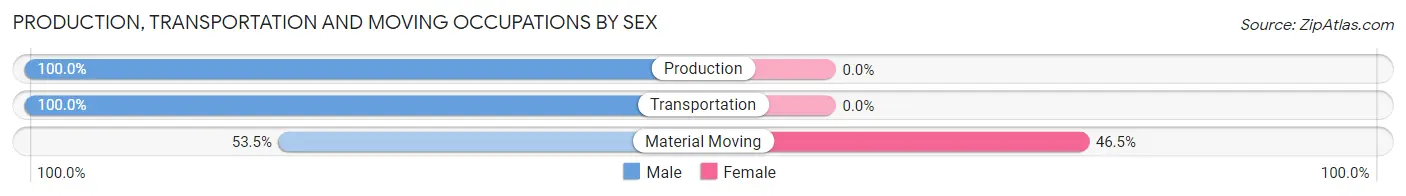
| Occupation | Male | Female |
| Production | 82 (100.0%) | 0 (0.0%) |
| Transportation | 74 (100.0%) | 0 (0.0%) |
| Material Moving | 53 (53.5%) | 46 (46.5%) |
| Total (Category) | 209 (82.0%) | 46 (18.0%) |
| Total (Overall) | 2,054 (54.3%) | 1,726 (45.7%) |
Employment Industries by Sex in Redlands
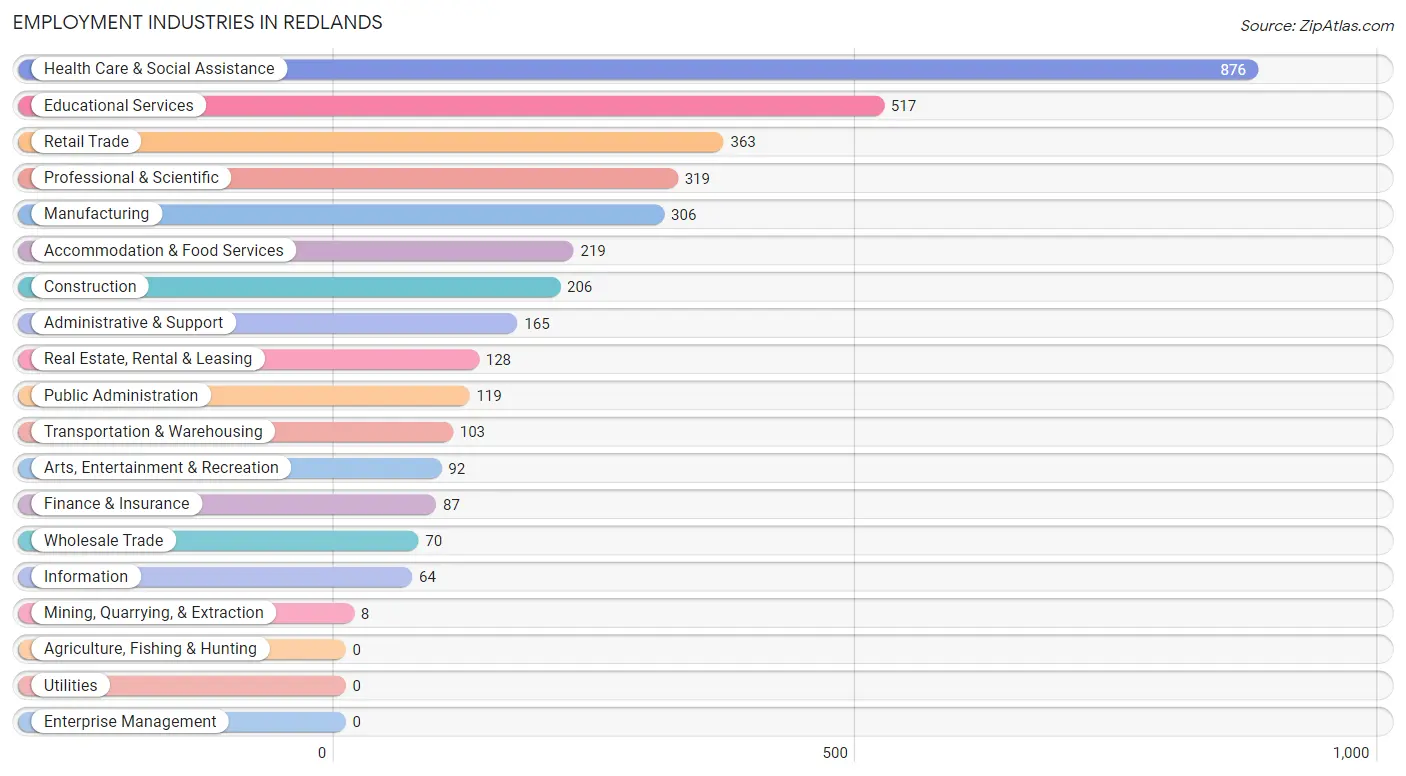
Employment Industries in Redlands
The major employment industries in Redlands include Health Care & Social Assistance (876 | 23.2%), Educational Services (517 | 13.7%), Retail Trade (363 | 9.6%), Professional & Scientific (319 | 8.4%), and Manufacturing (306 | 8.1%).
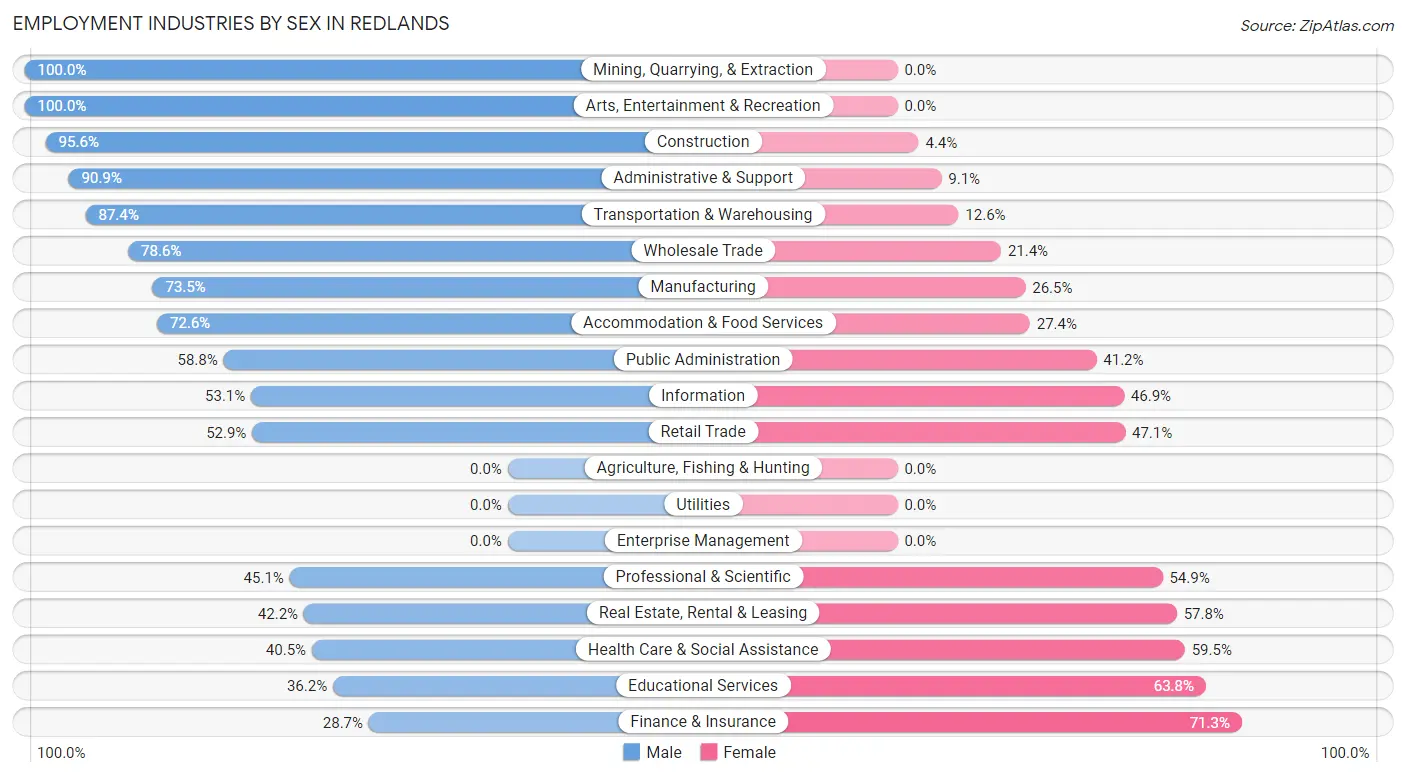
Employment Industries by Sex in Redlands
The Redlands industries that see more men than women are Mining, Quarrying, & Extraction (100.0%), Arts, Entertainment & Recreation (100.0%), and Construction (95.6%), whereas the industries that tend to have a higher number of women are Finance & Insurance (71.3%), Educational Services (63.8%), and Health Care & Social Assistance (59.5%).
| Industry | Male | Female |
| Agriculture, Fishing & Hunting | 0 (0.0%) | 0 (0.0%) |
| Mining, Quarrying, & Extraction | 8 (100.0%) | 0 (0.0%) |
| Construction | 197 (95.6%) | 9 (4.4%) |
| Manufacturing | 225 (73.5%) | 81 (26.5%) |
| Wholesale Trade | 55 (78.6%) | 15 (21.4%) |
| Retail Trade | 192 (52.9%) | 171 (47.1%) |
| Transportation & Warehousing | 90 (87.4%) | 13 (12.6%) |
| Utilities | 0 (0.0%) | 0 (0.0%) |
| Information | 34 (53.1%) | 30 (46.9%) |
| Finance & Insurance | 25 (28.7%) | 62 (71.3%) |
| Real Estate, Rental & Leasing | 54 (42.2%) | 74 (57.8%) |
| Professional & Scientific | 144 (45.1%) | 175 (54.9%) |
| Enterprise Management | 0 (0.0%) | 0 (0.0%) |
| Administrative & Support | 150 (90.9%) | 15 (9.1%) |
| Educational Services | 187 (36.2%) | 330 (63.8%) |
| Health Care & Social Assistance | 355 (40.5%) | 521 (59.5%) |
| Arts, Entertainment & Recreation | 92 (100.0%) | 0 (0.0%) |
| Accommodation & Food Services | 159 (72.6%) | 60 (27.4%) |
| Public Administration | 70 (58.8%) | 49 (41.2%) |
| Total | 2,054 (54.3%) | 1,726 (45.7%) |
Education in Redlands
School Enrollment in Redlands
The most common levels of schooling among the 1,944 students in Redlands are elementary school (504 | 25.9%), middle school (445 | 22.9%), and college / undergraduate (398 | 20.5%).
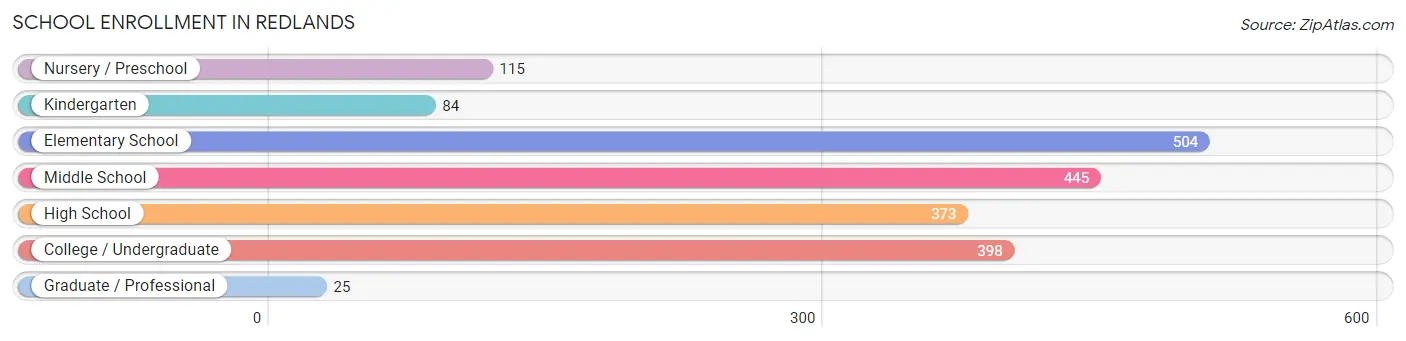
| School Level | # Students | % Students |
| Nursery / Preschool | 115 | 5.9% |
| Kindergarten | 84 | 4.3% |
| Elementary School | 504 | 25.9% |
| Middle School | 445 | 22.9% |
| High School | 373 | 19.2% |
| College / Undergraduate | 398 | 20.5% |
| Graduate / Professional | 25 | 1.3% |
| Total | 1,944 | 100.0% |
School Enrollment by Age by Funding Source in Redlands
Out of a total of 1,944 students who are enrolled in schools in Redlands, 288 (14.8%) attend a private institution, while the remaining 1,656 (85.2%) are enrolled in public schools. The age group of 3 to 4 year olds has the highest likelihood of being enrolled in private schools, with 83 (82.2% in the age bracket) enrolled. Conversely, the age group of 18 to 19 year olds has the lowest likelihood of being enrolled in a private school, with 85 (100.0% in the age bracket) attending a public institution.
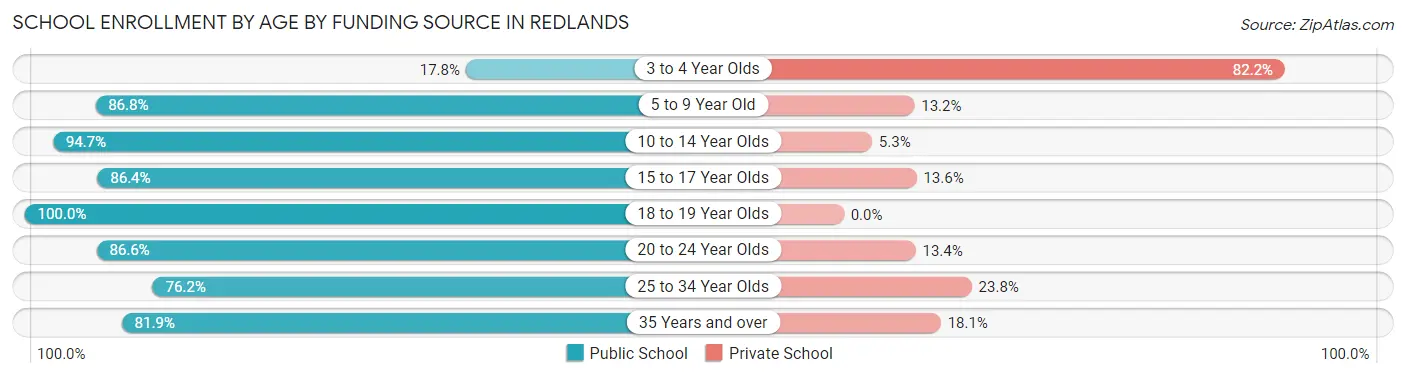
| Age Bracket | Public School | Private School |
| 3 to 4 Year Olds | 18 (17.8%) | 83 (82.2%) |
| 5 to 9 Year Old | 442 (86.8%) | 67 (13.2%) |
| 10 to 14 Year Olds | 612 (94.7%) | 34 (5.3%) |
| 15 to 17 Year Olds | 204 (86.4%) | 32 (13.6%) |
| 18 to 19 Year Olds | 85 (100.0%) | 0 (0.0%) |
| 20 to 24 Year Olds | 97 (86.6%) | 15 (13.4%) |
| 25 to 34 Year Olds | 131 (76.2%) | 41 (23.8%) |
| 35 Years and over | 68 (81.9%) | 15 (18.1%) |
| Total | 1,656 (85.2%) | 288 (14.8%) |
Educational Attainment by Field of Study in Redlands
Business (587 | 16.5%), bio, nature & agricultural (445 | 12.5%), education (408 | 11.5%), arts & humanities (362 | 10.2%), and psychology (356 | 10.0%) are the most common fields of study among 3,556 individuals in Redlands who have obtained a bachelor's degree or higher.
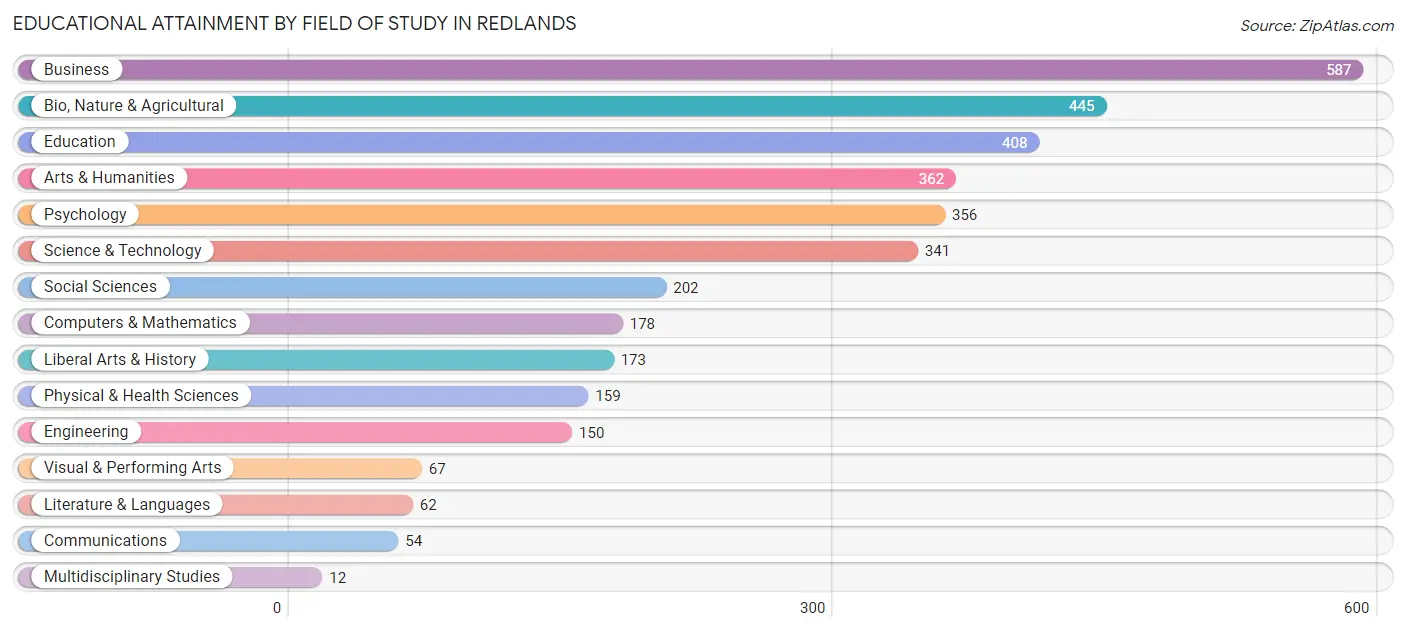
| Field of Study | # Graduates | % Graduates |
| Computers & Mathematics | 178 | 5.0% |
| Bio, Nature & Agricultural | 445 | 12.5% |
| Physical & Health Sciences | 159 | 4.5% |
| Psychology | 356 | 10.0% |
| Social Sciences | 202 | 5.7% |
| Engineering | 150 | 4.2% |
| Multidisciplinary Studies | 12 | 0.3% |
| Science & Technology | 341 | 9.6% |
| Business | 587 | 16.5% |
| Education | 408 | 11.5% |
| Literature & Languages | 62 | 1.7% |
| Liberal Arts & History | 173 | 4.9% |
| Visual & Performing Arts | 67 | 1.9% |
| Communications | 54 | 1.5% |
| Arts & Humanities | 362 | 10.2% |
| Total | 3,556 | 100.0% |
Transportation & Commute in Redlands
Vehicle Availability by Sex in Redlands
The most prevalent vehicle ownership categories in Redlands are males with 3 vehicles (702, accounting for 34.3%) and females with 3 vehicles (650, making up 40.8%).
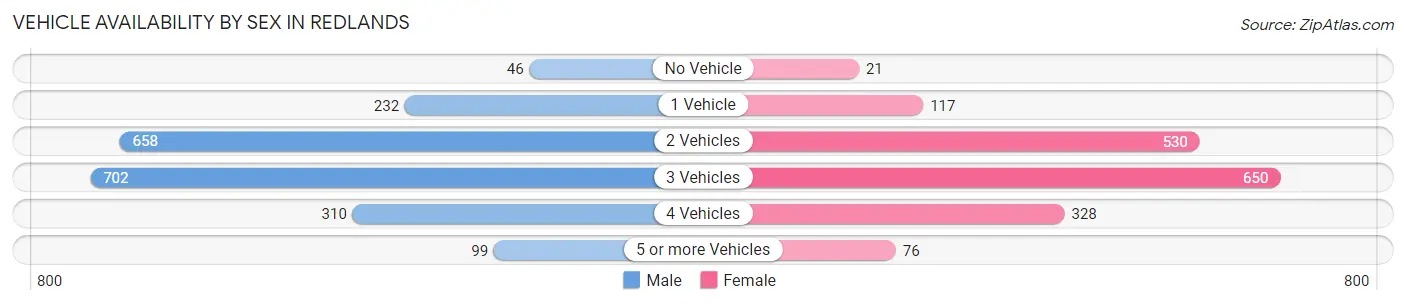
| Vehicles Available | Male | Female |
| No Vehicle | 46 (2.2%) | 21 (1.2%) |
| 1 Vehicle | 232 (11.3%) | 117 (6.8%) |
| 2 Vehicles | 658 (32.1%) | 530 (30.8%) |
| 3 Vehicles | 702 (34.3%) | 650 (37.8%) |
| 4 Vehicles | 310 (15.1%) | 328 (19.1%) |
| 5 or more Vehicles | 99 (4.8%) | 76 (4.4%) |
| Total | 2,047 (100.0%) | 1,722 (100.0%) |
Commute Time in Redlands
The most frequently occuring commute durations in Redlands are 15 to 19 minutes (1,149 commuters, 33.6%), 10 to 14 minutes (1,069 commuters, 31.2%), and 20 to 24 minutes (493 commuters, 14.4%).
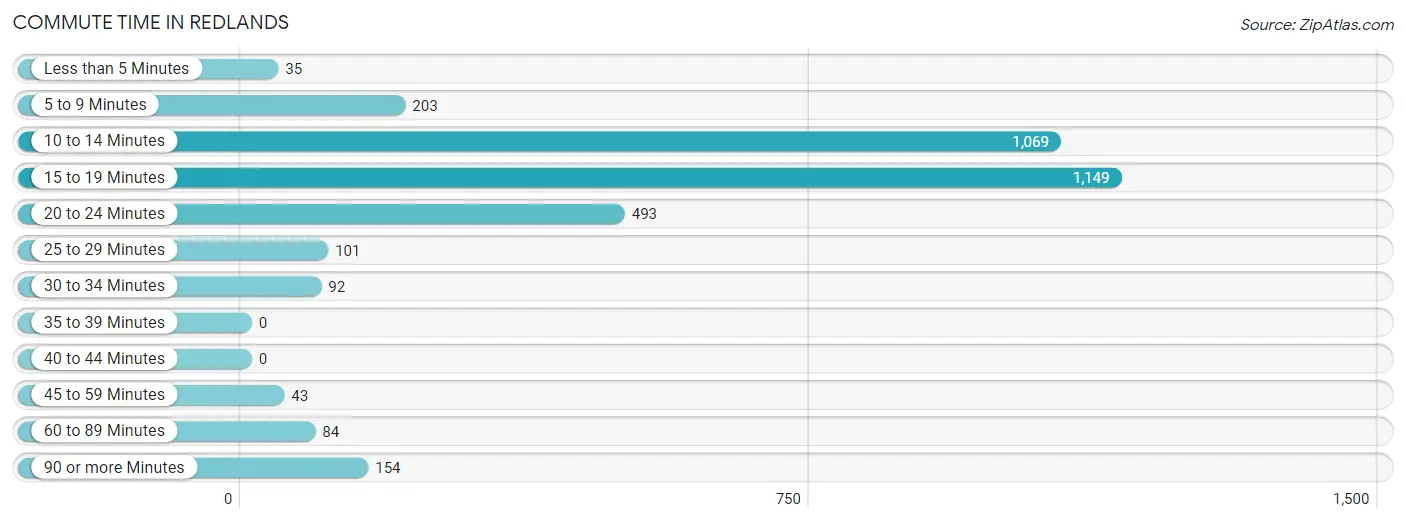
| Commute Time | # Commuters | % Commuters |
| Less than 5 Minutes | 35 | 1.0% |
| 5 to 9 Minutes | 203 | 5.9% |
| 10 to 14 Minutes | 1,069 | 31.2% |
| 15 to 19 Minutes | 1,149 | 33.6% |
| 20 to 24 Minutes | 493 | 14.4% |
| 25 to 29 Minutes | 101 | 2.9% |
| 30 to 34 Minutes | 92 | 2.7% |
| 35 to 39 Minutes | 0 | 0.0% |
| 40 to 44 Minutes | 0 | 0.0% |
| 45 to 59 Minutes | 43 | 1.3% |
| 60 to 89 Minutes | 84 | 2.5% |
| 90 or more Minutes | 154 | 4.5% |
Commute Time by Sex in Redlands
The most common commute times in Redlands are 15 to 19 minutes (598 commuters, 32.2%) for males and 15 to 19 minutes (551 commuters, 35.2%) for females.
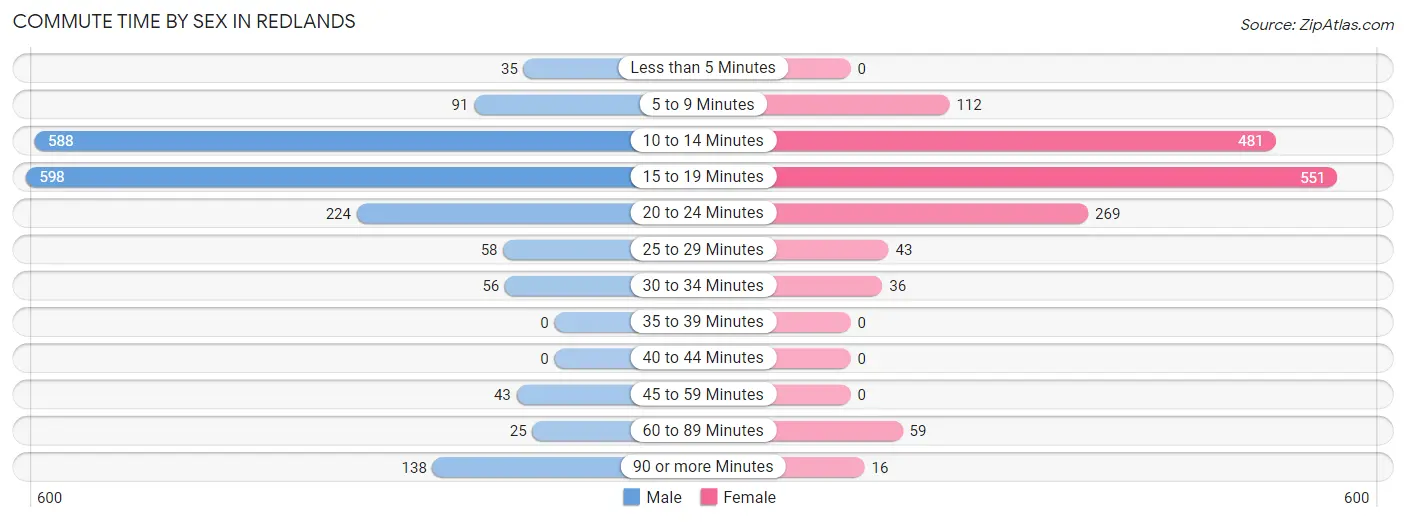
| Commute Time | Male | Female |
| Less than 5 Minutes | 35 (1.9%) | 0 (0.0%) |
| 5 to 9 Minutes | 91 (4.9%) | 112 (7.1%) |
| 10 to 14 Minutes | 588 (31.7%) | 481 (30.7%) |
| 15 to 19 Minutes | 598 (32.2%) | 551 (35.2%) |
| 20 to 24 Minutes | 224 (12.1%) | 269 (17.2%) |
| 25 to 29 Minutes | 58 (3.1%) | 43 (2.7%) |
| 30 to 34 Minutes | 56 (3.0%) | 36 (2.3%) |
| 35 to 39 Minutes | 0 (0.0%) | 0 (0.0%) |
| 40 to 44 Minutes | 0 (0.0%) | 0 (0.0%) |
| 45 to 59 Minutes | 43 (2.3%) | 0 (0.0%) |
| 60 to 89 Minutes | 25 (1.3%) | 59 (3.8%) |
| 90 or more Minutes | 138 (7.4%) | 16 (1.0%) |
Time of Departure to Work by Sex in Redlands
The most frequent times of departure to work in Redlands are 8:00 AM to 8:29 AM (308, 16.6%) for males and 7:30 AM to 7:59 AM (551, 35.2%) for females.
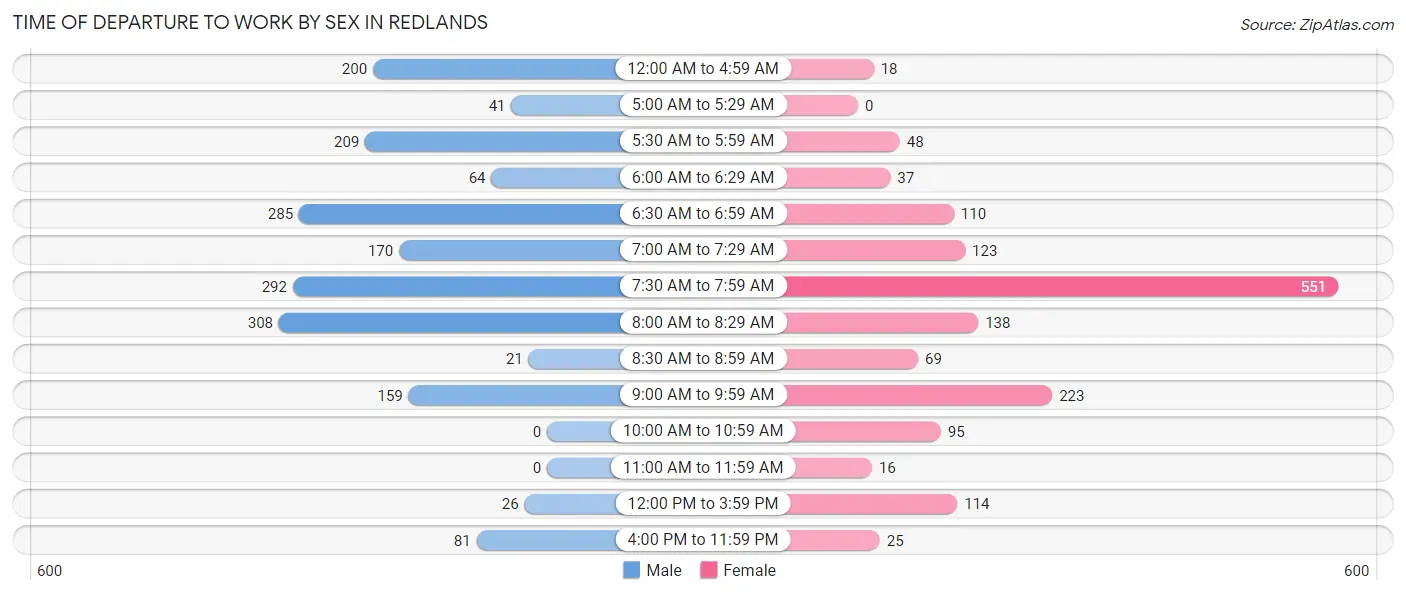
| Time of Departure | Male | Female |
| 12:00 AM to 4:59 AM | 200 (10.8%) | 18 (1.1%) |
| 5:00 AM to 5:29 AM | 41 (2.2%) | 0 (0.0%) |
| 5:30 AM to 5:59 AM | 209 (11.3%) | 48 (3.1%) |
| 6:00 AM to 6:29 AM | 64 (3.5%) | 37 (2.4%) |
| 6:30 AM to 6:59 AM | 285 (15.4%) | 110 (7.0%) |
| 7:00 AM to 7:29 AM | 170 (9.2%) | 123 (7.9%) |
| 7:30 AM to 7:59 AM | 292 (15.7%) | 551 (35.2%) |
| 8:00 AM to 8:29 AM | 308 (16.6%) | 138 (8.8%) |
| 8:30 AM to 8:59 AM | 21 (1.1%) | 69 (4.4%) |
| 9:00 AM to 9:59 AM | 159 (8.6%) | 223 (14.2%) |
| 10:00 AM to 10:59 AM | 0 (0.0%) | 95 (6.1%) |
| 11:00 AM to 11:59 AM | 0 (0.0%) | 16 (1.0%) |
| 12:00 PM to 3:59 PM | 26 (1.4%) | 114 (7.3%) |
| 4:00 PM to 11:59 PM | 81 (4.4%) | 25 (1.6%) |
| Total | 1,856 (100.0%) | 1,567 (100.0%) |
Housing Occupancy in Redlands
Occupancy by Ownership in Redlands
Of the total 3,474 dwellings in Redlands, owner-occupied units account for 3,169 (91.2%), while renter-occupied units make up 305 (8.8%).
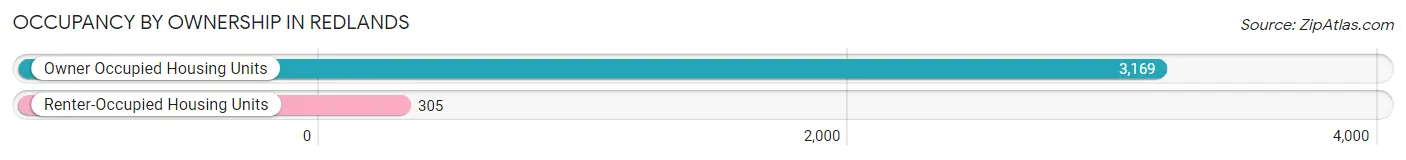
| Occupancy | # Housing Units | % Housing Units |
| Owner Occupied Housing Units | 3,169 | 91.2% |
| Renter-Occupied Housing Units | 305 | 8.8% |
| Total Occupied Housing Units | 3,474 | 100.0% |
Occupancy by Household Size in Redlands
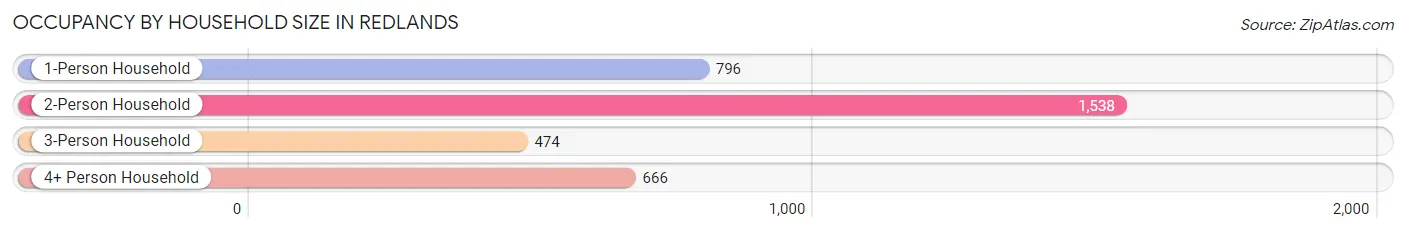
| Household Size | # Housing Units | % Housing Units |
| 1-Person Household | 796 | 22.9% |
| 2-Person Household | 1,538 | 44.3% |
| 3-Person Household | 474 | 13.6% |
| 4+ Person Household | 666 | 19.2% |
| Total Housing Units | 3,474 | 100.0% |
Occupancy by Ownership by Household Size in Redlands
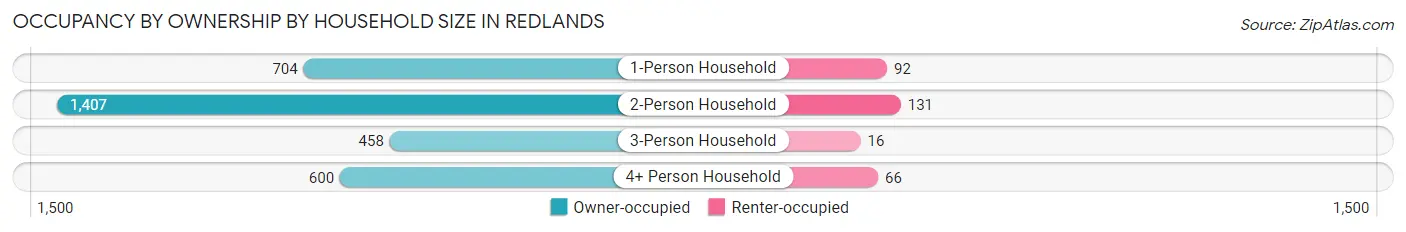
| Household Size | Owner-occupied | Renter-occupied |
| 1-Person Household | 704 (88.4%) | 92 (11.6%) |
| 2-Person Household | 1,407 (91.5%) | 131 (8.5%) |
| 3-Person Household | 458 (96.6%) | 16 (3.4%) |
| 4+ Person Household | 600 (90.1%) | 66 (9.9%) |
| Total Housing Units | 3,169 (91.2%) | 305 (8.8%) |
Occupancy by Educational Attainment in Redlands
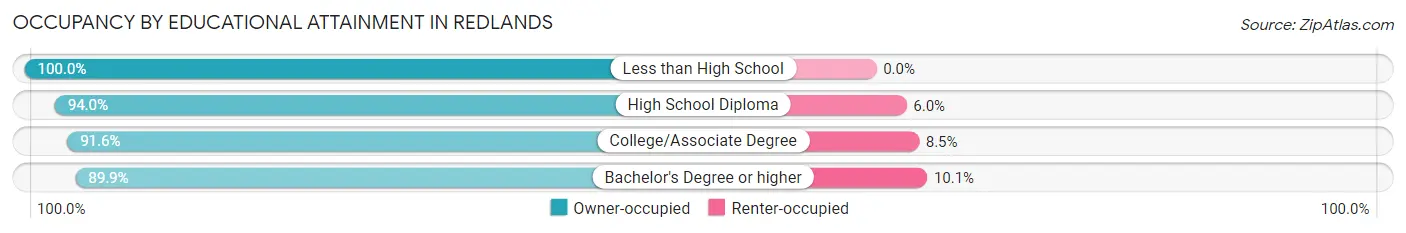
| Household Size | Owner-occupied | Renter-occupied |
| Less than High School | 25 (100.0%) | 0 (0.0%) |
| High School Diploma | 581 (94.0%) | 37 (6.0%) |
| College/Associate Degree | 964 (91.5%) | 89 (8.5%) |
| Bachelor's Degree or higher | 1,599 (89.9%) | 179 (10.1%) |
Occupancy by Age of Householder in Redlands
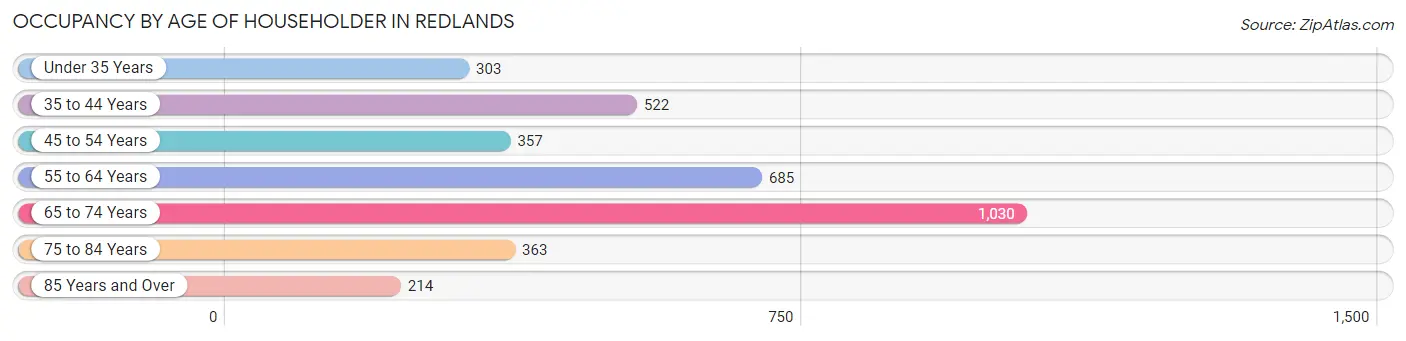
| Age Bracket | # Households | % Households |
| Under 35 Years | 303 | 8.7% |
| 35 to 44 Years | 522 | 15.0% |
| 45 to 54 Years | 357 | 10.3% |
| 55 to 64 Years | 685 | 19.7% |
| 65 to 74 Years | 1,030 | 29.6% |
| 75 to 84 Years | 363 | 10.4% |
| 85 Years and Over | 214 | 6.2% |
| Total | 3,474 | 100.0% |
Housing Finances in Redlands
Median Income by Occupancy in Redlands
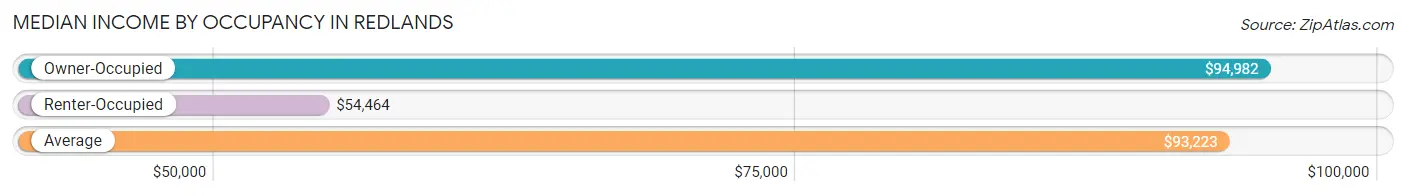
| Occupancy Type | # Households | Median Income |
| Owner-Occupied | 3,169 (91.2%) | $94,982 |
| Renter-Occupied | 305 (8.8%) | $54,464 |
| Average | 3,474 (100.0%) | $93,223 |
Occupancy by Householder Income Bracket in Redlands
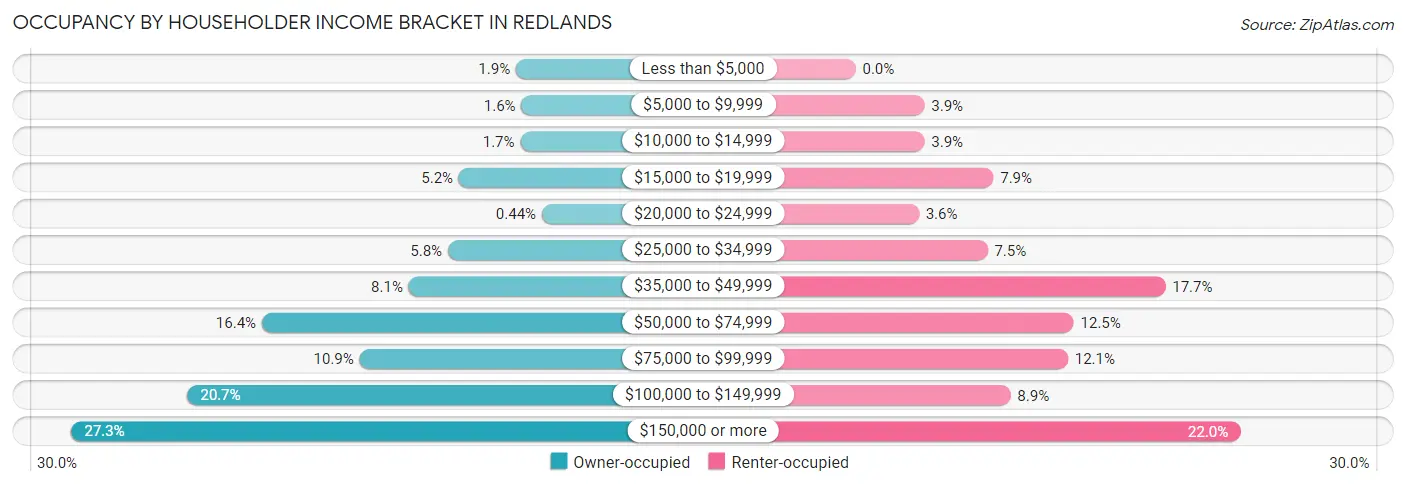
| Income Bracket | Owner-occupied | Renter-occupied |
| Less than $5,000 | 61 (1.9%) | 0 (0.0%) |
| $5,000 to $9,999 | 51 (1.6%) | 12 (3.9%) |
| $10,000 to $14,999 | 53 (1.7%) | 12 (3.9%) |
| $15,000 to $19,999 | 164 (5.2%) | 24 (7.9%) |
| $20,000 to $24,999 | 14 (0.4%) | 11 (3.6%) |
| $25,000 to $34,999 | 184 (5.8%) | 23 (7.5%) |
| $35,000 to $49,999 | 255 (8.1%) | 54 (17.7%) |
| $50,000 to $74,999 | 521 (16.4%) | 38 (12.5%) |
| $75,000 to $99,999 | 344 (10.9%) | 37 (12.1%) |
| $100,000 to $149,999 | 656 (20.7%) | 27 (8.8%) |
| $150,000 or more | 866 (27.3%) | 67 (22.0%) |
| Total | 3,169 (100.0%) | 305 (100.0%) |
Monthly Housing Cost Tiers in Redlands
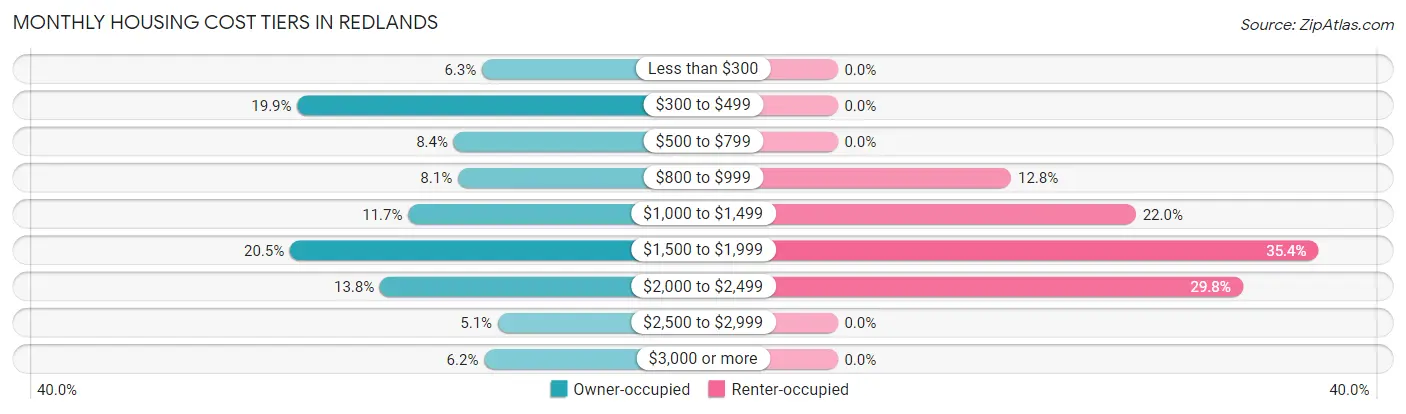
| Monthly Cost | Owner-occupied | Renter-occupied |
| Less than $300 | 200 (6.3%) | 0 (0.0%) |
| $300 to $499 | 631 (19.9%) | 0 (0.0%) |
| $500 to $799 | 266 (8.4%) | 0 (0.0%) |
| $800 to $999 | 256 (8.1%) | 39 (12.8%) |
| $1,000 to $1,499 | 372 (11.7%) | 67 (22.0%) |
| $1,500 to $1,999 | 648 (20.4%) | 108 (35.4%) |
| $2,000 to $2,499 | 438 (13.8%) | 91 (29.8%) |
| $2,500 to $2,999 | 163 (5.1%) | 0 (0.0%) |
| $3,000 or more | 195 (6.1%) | 0 (0.0%) |
| Total | 3,169 (100.0%) | 305 (100.0%) |
Physical Housing Characteristics in Redlands
Housing Structures in Redlands
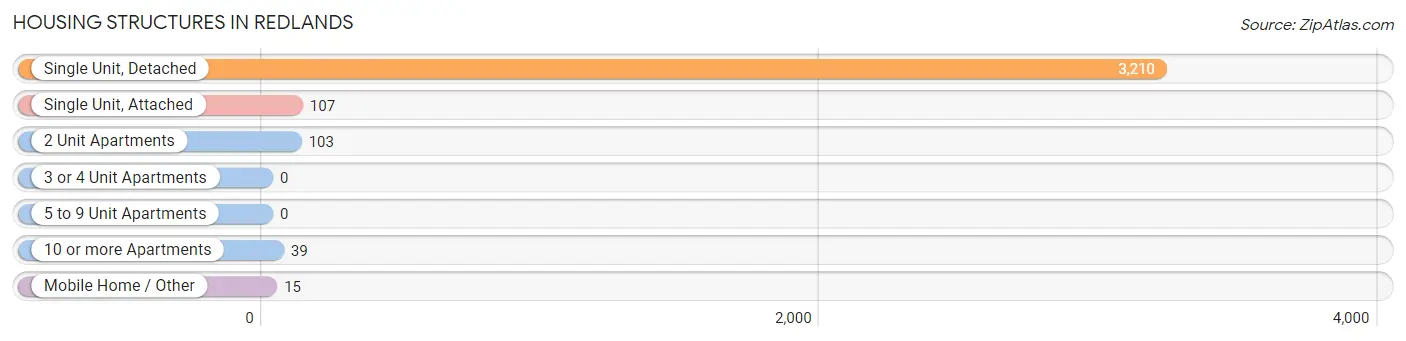
| Structure Type | # Housing Units | % Housing Units |
| Single Unit, Detached | 3,210 | 92.4% |
| Single Unit, Attached | 107 | 3.1% |
| 2 Unit Apartments | 103 | 3.0% |
| 3 or 4 Unit Apartments | 0 | 0.0% |
| 5 to 9 Unit Apartments | 0 | 0.0% |
| 10 or more Apartments | 39 | 1.1% |
| Mobile Home / Other | 15 | 0.4% |
| Total | 3,474 | 100.0% |
Housing Structures by Occupancy in Redlands
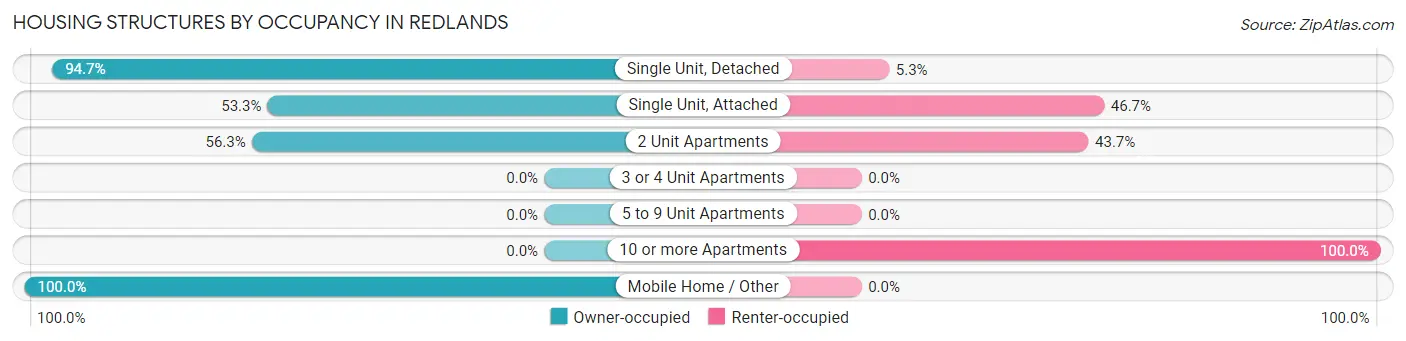
| Structure Type | Owner-occupied | Renter-occupied |
| Single Unit, Detached | 3,039 (94.7%) | 171 (5.3%) |
| Single Unit, Attached | 57 (53.3%) | 50 (46.7%) |
| 2 Unit Apartments | 58 (56.3%) | 45 (43.7%) |
| 3 or 4 Unit Apartments | 0 (0.0%) | 0 (0.0%) |
| 5 to 9 Unit Apartments | 0 (0.0%) | 0 (0.0%) |
| 10 or more Apartments | 0 (0.0%) | 39 (100.0%) |
| Mobile Home / Other | 15 (100.0%) | 0 (0.0%) |
| Total | 3,169 (91.2%) | 305 (8.8%) |
Housing Structures by Number of Rooms in Redlands
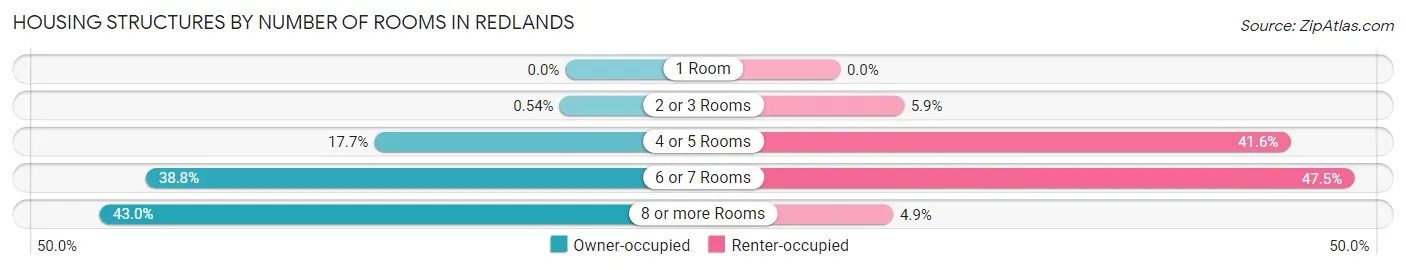
| Number of Rooms | Owner-occupied | Renter-occupied |
| 1 Room | 0 (0.0%) | 0 (0.0%) |
| 2 or 3 Rooms | 17 (0.5%) | 18 (5.9%) |
| 4 or 5 Rooms | 560 (17.7%) | 127 (41.6%) |
| 6 or 7 Rooms | 1,229 (38.8%) | 145 (47.5%) |
| 8 or more Rooms | 1,363 (43.0%) | 15 (4.9%) |
| Total | 3,169 (100.0%) | 305 (100.0%) |
Housing Structure by Heating Type in Redlands
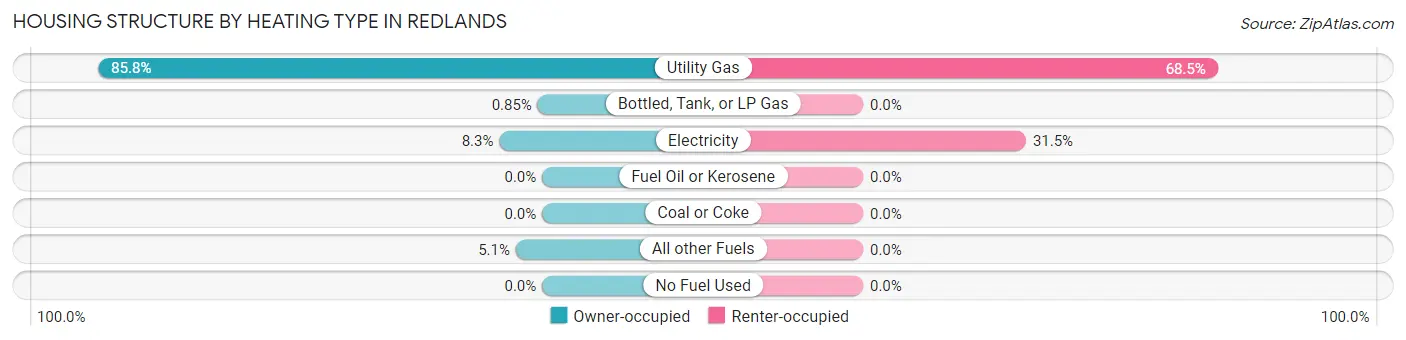
| Heating Type | Owner-occupied | Renter-occupied |
| Utility Gas | 2,719 (85.8%) | 209 (68.5%) |
| Bottled, Tank, or LP Gas | 27 (0.9%) | 0 (0.0%) |
| Electricity | 262 (8.3%) | 96 (31.5%) |
| Fuel Oil or Kerosene | 0 (0.0%) | 0 (0.0%) |
| Coal or Coke | 0 (0.0%) | 0 (0.0%) |
| All other Fuels | 161 (5.1%) | 0 (0.0%) |
| No Fuel Used | 0 (0.0%) | 0 (0.0%) |
| Total | 3,169 (100.0%) | 305 (100.0%) |
Household Vehicle Usage in Redlands
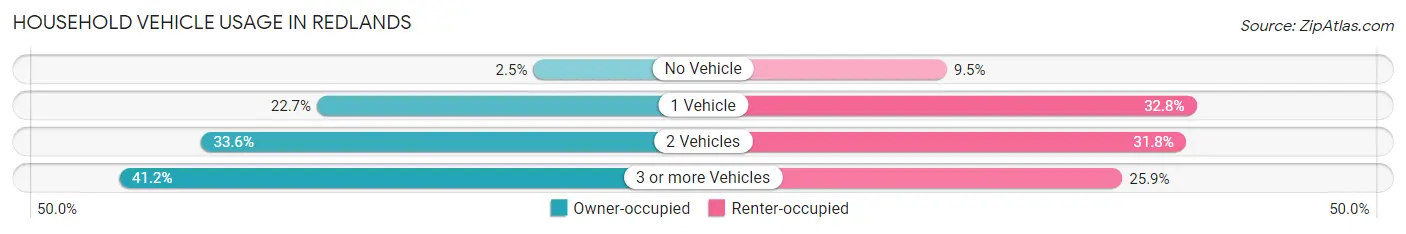
| Vehicles per Household | Owner-occupied | Renter-occupied |
| No Vehicle | 80 (2.5%) | 29 (9.5%) |
| 1 Vehicle | 720 (22.7%) | 100 (32.8%) |
| 2 Vehicles | 1,064 (33.6%) | 97 (31.8%) |
| 3 or more Vehicles | 1,305 (41.2%) | 79 (25.9%) |
| Total | 3,169 (100.0%) | 305 (100.0%) |
Real Estate & Mortgages in Redlands
Real Estate and Mortgage Overview in Redlands
| Characteristic | Without Mortgage | With Mortgage |
| Housing Units | 1,160 | 2,009 |
| Median Property Value | $468,300 | $406,200 |
| Median Household Income | $68,750 | $602 |
| Monthly Housing Costs | $392 | $195 |
| Real Estate Taxes | $1,623 | $0 |
Property Value by Mortgage Status in Redlands
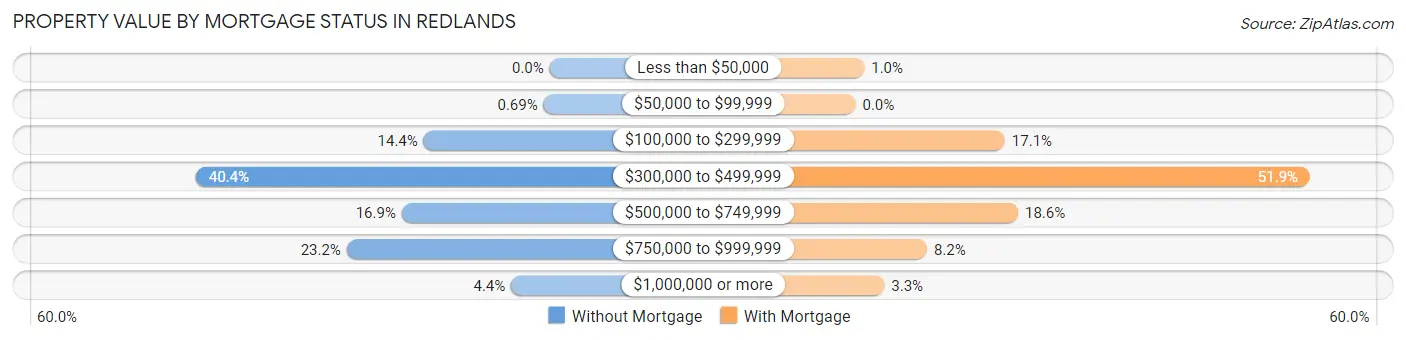
| Property Value | Without Mortgage | With Mortgage |
| Less than $50,000 | 0 (0.0%) | 20 (1.0%) |
| $50,000 to $99,999 | 8 (0.7%) | 0 (0.0%) |
| $100,000 to $299,999 | 167 (14.4%) | 343 (17.1%) |
| $300,000 to $499,999 | 469 (40.4%) | 1,043 (51.9%) |
| $500,000 to $749,999 | 196 (16.9%) | 373 (18.6%) |
| $750,000 to $999,999 | 269 (23.2%) | 164 (8.2%) |
| $1,000,000 or more | 51 (4.4%) | 66 (3.3%) |
| Total | 1,160 (100.0%) | 2,009 (100.0%) |
Household Income by Mortgage Status in Redlands
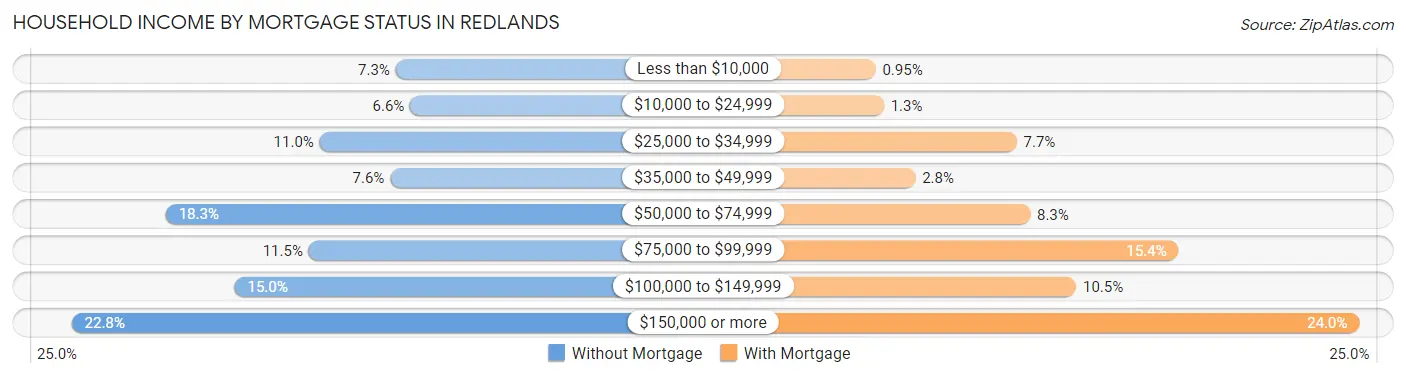
| Household Income | Without Mortgage | With Mortgage |
| Less than $10,000 | 85 (7.3%) | 19 (0.9%) |
| $10,000 to $24,999 | 77 (6.6%) | 27 (1.3%) |
| $25,000 to $34,999 | 127 (11.0%) | 154 (7.7%) |
| $35,000 to $49,999 | 88 (7.6%) | 57 (2.8%) |
| $50,000 to $74,999 | 212 (18.3%) | 167 (8.3%) |
| $75,000 to $99,999 | 133 (11.5%) | 309 (15.4%) |
| $100,000 to $149,999 | 174 (15.0%) | 211 (10.5%) |
| $150,000 or more | 264 (22.8%) | 482 (24.0%) |
| Total | 1,160 (100.0%) | 2,009 (100.0%) |
Property Value to Household Income Ratio in Redlands
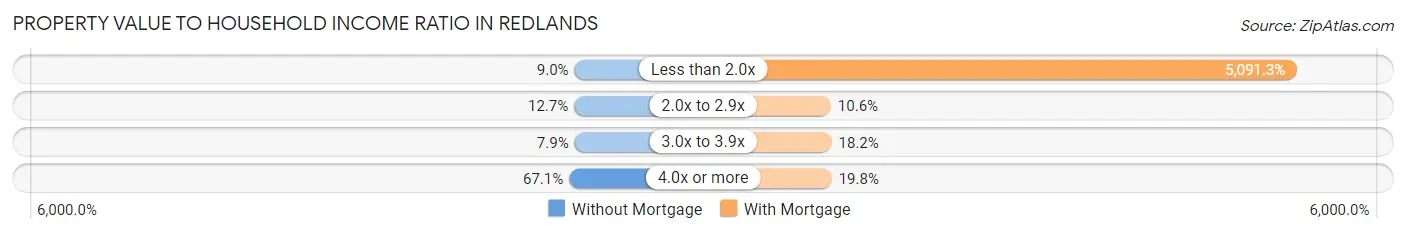
| Value-to-Income Ratio | Without Mortgage | With Mortgage |
| Less than 2.0x | 104 (9.0%) | 102,284 (5,091.3%) |
| 2.0x to 2.9x | 147 (12.7%) | 212 (10.5%) |
| 3.0x to 3.9x | 92 (7.9%) | 366 (18.2%) |
| 4.0x or more | 778 (67.1%) | 398 (19.8%) |
| Total | 1,160 (100.0%) | 2,009 (100.0%) |
Real Estate Taxes by Mortgage Status in Redlands
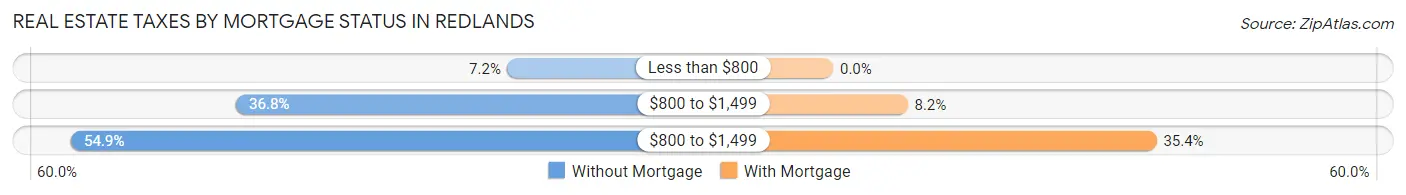
| Property Taxes | Without Mortgage | With Mortgage |
| Less than $800 | 83 (7.2%) | 0 (0.0%) |
| $800 to $1,499 | 427 (36.8%) | 164 (8.2%) |
| $800 to $1,499 | 637 (54.9%) | 712 (35.4%) |
| Total | 1,160 (100.0%) | 2,009 (100.0%) |
Health & Disability in Redlands
Health Insurance Coverage by Age in Redlands
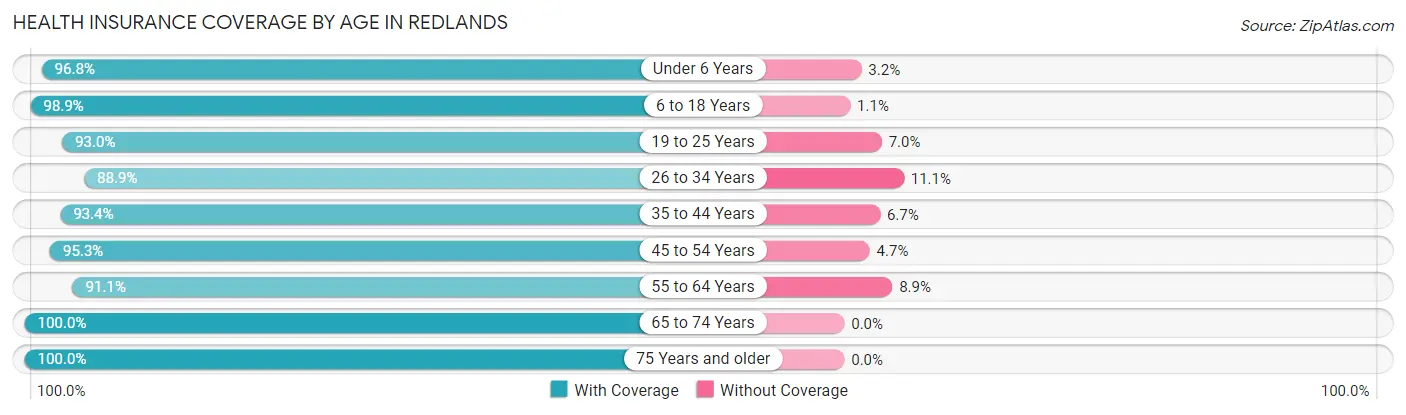
| Age Bracket | With Coverage | Without Coverage |
| Under 6 Years | 455 (96.8%) | 15 (3.2%) |
| 6 to 18 Years | 1,363 (98.9%) | 15 (1.1%) |
| 19 to 25 Years | 400 (93.0%) | 30 (7.0%) |
| 26 to 34 Years | 729 (88.9%) | 91 (11.1%) |
| 35 to 44 Years | 1,011 (93.3%) | 72 (6.7%) |
| 45 to 54 Years | 644 (95.3%) | 32 (4.7%) |
| 55 to 64 Years | 1,121 (91.1%) | 110 (8.9%) |
| 65 to 74 Years | 1,847 (100.0%) | 0 (0.0%) |
| 75 Years and older | 979 (100.0%) | 0 (0.0%) |
| Total | 8,549 (95.9%) | 365 (4.1%) |
Health Insurance Coverage by Citizenship Status in Redlands
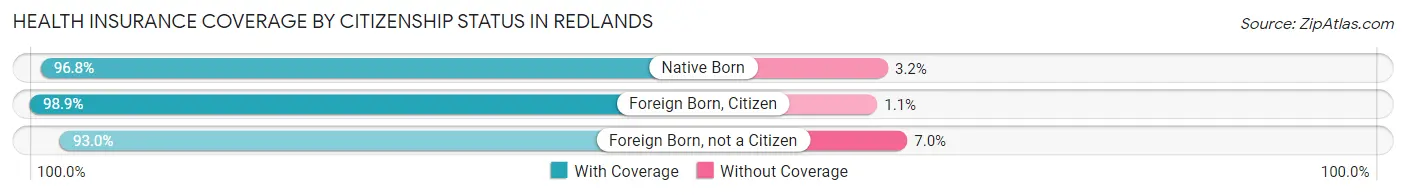
| Citizenship Status | With Coverage | Without Coverage |
| Native Born | 455 (96.8%) | 15 (3.2%) |
| Foreign Born, Citizen | 1,363 (98.9%) | 15 (1.1%) |
| Foreign Born, not a Citizen | 400 (93.0%) | 30 (7.0%) |
Health Insurance Coverage by Household Income in Redlands
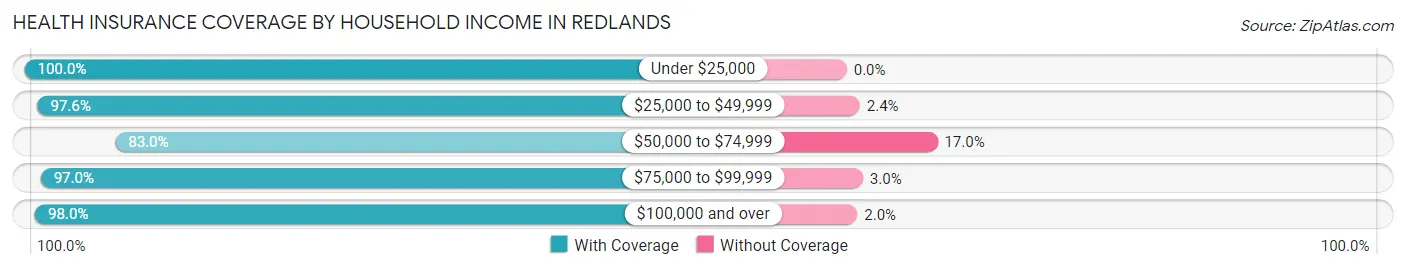
| Household Income | With Coverage | Without Coverage |
| Under $25,000 | 512 (100.0%) | 0 (0.0%) |
| $25,000 to $49,999 | 881 (97.6%) | 22 (2.4%) |
| $50,000 to $74,999 | 1,031 (83.0%) | 211 (17.0%) |
| $75,000 to $99,999 | 868 (97.0%) | 27 (3.0%) |
| $100,000 and over | 5,208 (98.0%) | 105 (2.0%) |
Public vs Private Health Insurance Coverage by Age in Redlands
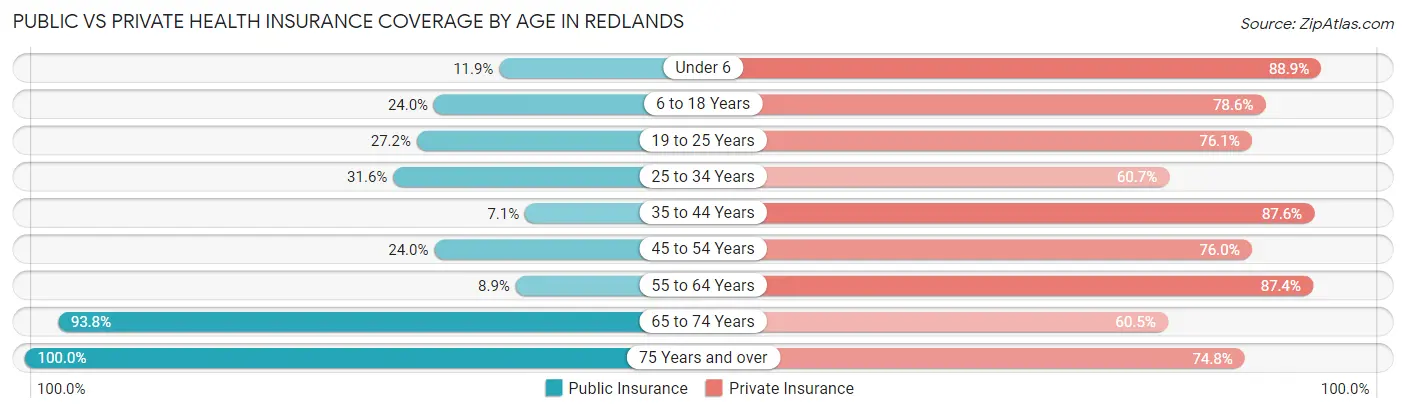
| Age Bracket | Public Insurance | Private Insurance |
| Under 6 | 56 (11.9%) | 418 (88.9%) |
| 6 to 18 Years | 331 (24.0%) | 1,083 (78.6%) |
| 19 to 25 Years | 117 (27.2%) | 327 (76.0%) |
| 25 to 34 Years | 259 (31.6%) | 498 (60.7%) |
| 35 to 44 Years | 77 (7.1%) | 949 (87.6%) |
| 45 to 54 Years | 162 (24.0%) | 514 (76.0%) |
| 55 to 64 Years | 109 (8.8%) | 1,076 (87.4%) |
| 65 to 74 Years | 1,733 (93.8%) | 1,117 (60.5%) |
| 75 Years and over | 979 (100.0%) | 732 (74.8%) |
| Total | 3,823 (42.9%) | 6,714 (75.3%) |
Disability Status by Sex by Age in Redlands
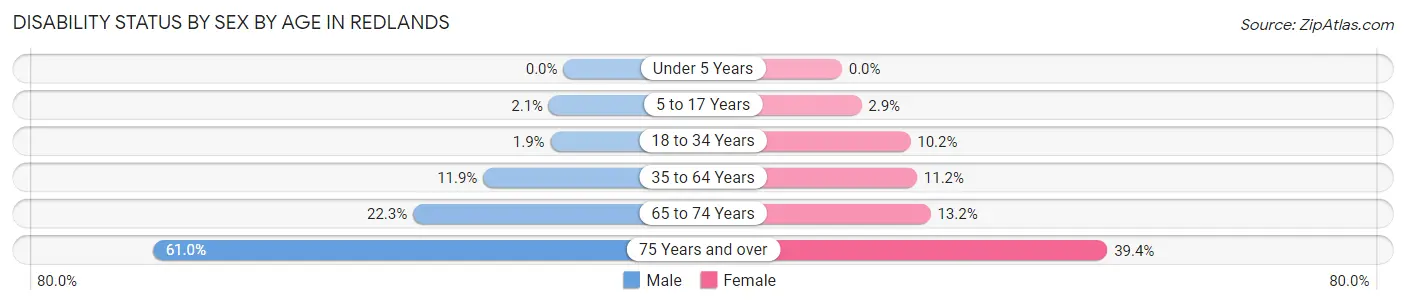
| Age Bracket | Male | Female |
| Under 5 Years | 0 (0.0%) | 0 (0.0%) |
| 5 to 17 Years | 14 (2.1%) | 23 (2.9%) |
| 18 to 34 Years | 14 (1.9%) | 55 (10.2%) |
| 35 to 64 Years | 167 (11.9%) | 177 (11.2%) |
| 65 to 74 Years | 175 (22.3%) | 140 (13.2%) |
| 75 Years and over | 289 (61.0%) | 199 (39.4%) |
Disability Class by Sex by Age in Redlands
Disability Class: Hearing Difficulty
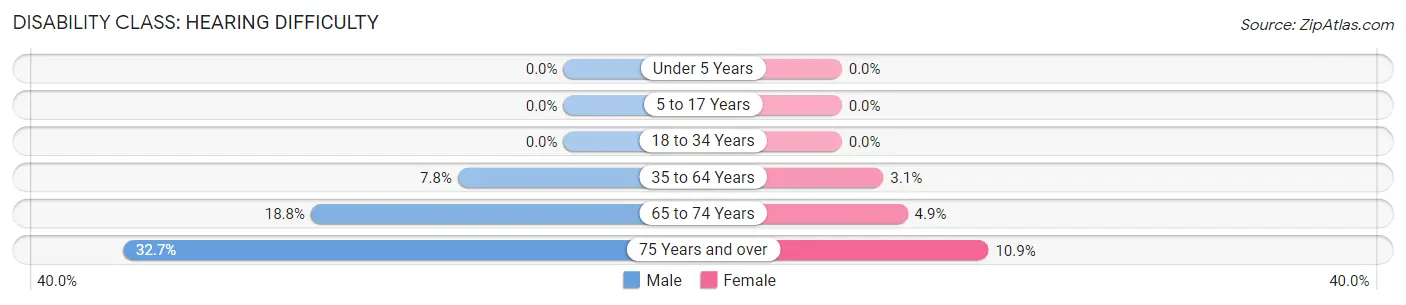
| Age Bracket | Male | Female |
| Under 5 Years | 0 (0.0%) | 0 (0.0%) |
| 5 to 17 Years | 0 (0.0%) | 0 (0.0%) |
| 18 to 34 Years | 0 (0.0%) | 0 (0.0%) |
| 35 to 64 Years | 110 (7.8%) | 49 (3.1%) |
| 65 to 74 Years | 147 (18.8%) | 52 (4.9%) |
| 75 Years and over | 155 (32.7%) | 55 (10.9%) |
Disability Class: Vision Difficulty
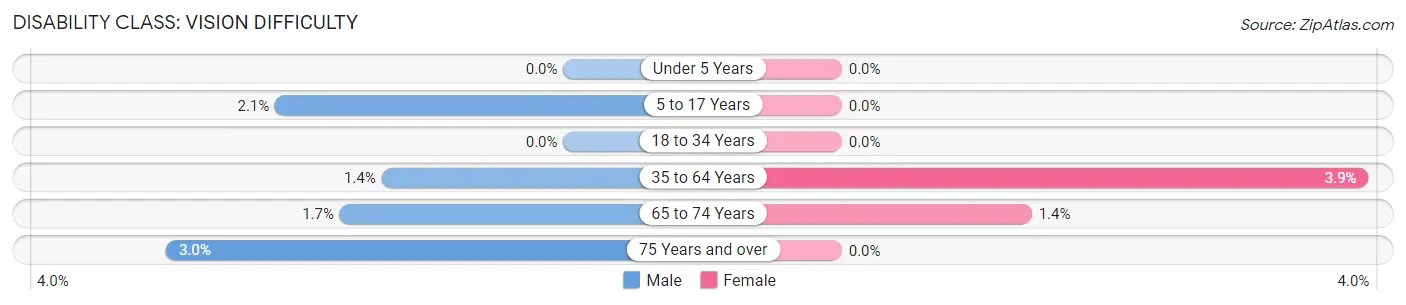
| Age Bracket | Male | Female |
| Under 5 Years | 0 (0.0%) | 0 (0.0%) |
| 5 to 17 Years | 14 (2.1%) | 0 (0.0%) |
| 18 to 34 Years | 0 (0.0%) | 0 (0.0%) |
| 35 to 64 Years | 19 (1.3%) | 62 (3.9%) |
| 65 to 74 Years | 13 (1.7%) | 15 (1.4%) |
| 75 Years and over | 14 (2.9%) | 0 (0.0%) |
Disability Class: Cognitive Difficulty
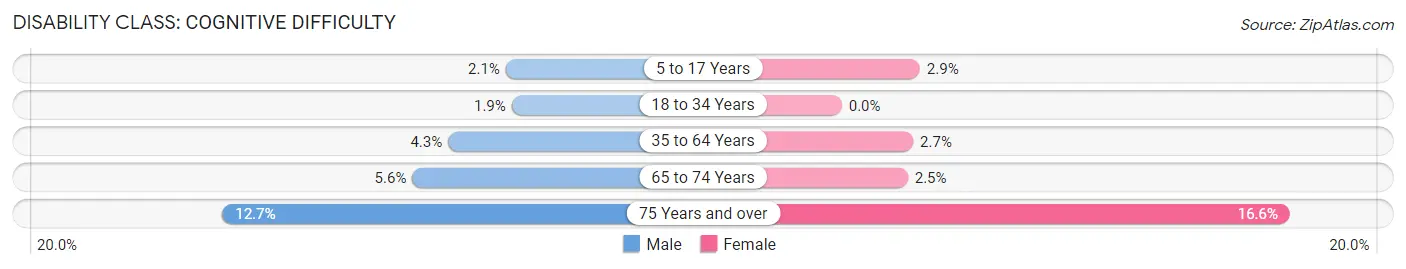
| Age Bracket | Male | Female |
| 5 to 17 Years | 14 (2.1%) | 23 (2.9%) |
| 18 to 34 Years | 14 (1.9%) | 0 (0.0%) |
| 35 to 64 Years | 60 (4.3%) | 42 (2.6%) |
| 65 to 74 Years | 44 (5.6%) | 26 (2.5%) |
| 75 Years and over | 60 (12.7%) | 84 (16.6%) |
Disability Class: Ambulatory Difficulty
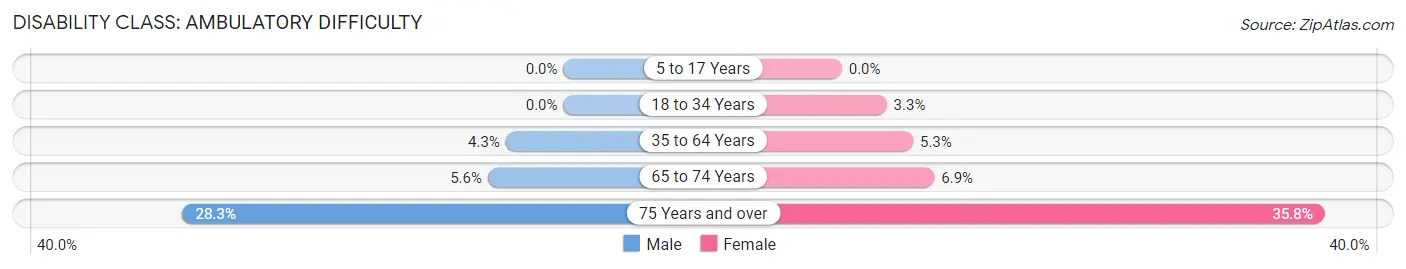
| Age Bracket | Male | Female |
| 5 to 17 Years | 0 (0.0%) | 0 (0.0%) |
| 18 to 34 Years | 0 (0.0%) | 18 (3.3%) |
| 35 to 64 Years | 60 (4.3%) | 84 (5.3%) |
| 65 to 74 Years | 44 (5.6%) | 73 (6.9%) |
| 75 Years and over | 134 (28.3%) | 181 (35.8%) |
Disability Class: Self-Care Difficulty
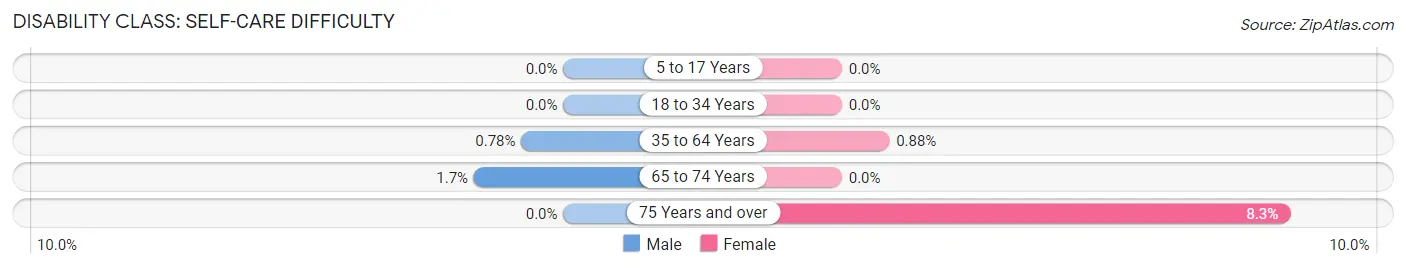
| Age Bracket | Male | Female |
| 5 to 17 Years | 0 (0.0%) | 0 (0.0%) |
| 18 to 34 Years | 0 (0.0%) | 0 (0.0%) |
| 35 to 64 Years | 11 (0.8%) | 14 (0.9%) |
| 65 to 74 Years | 13 (1.7%) | 0 (0.0%) |
| 75 Years and over | 0 (0.0%) | 42 (8.3%) |
Technology Access in Redlands
Computing Device Access in Redlands
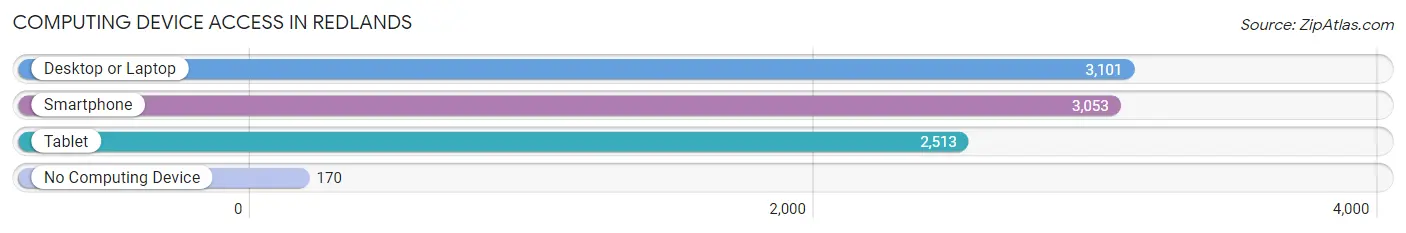
| Device Type | # Households | % Households |
| Desktop or Laptop | 3,101 | 89.3% |
| Smartphone | 3,053 | 87.9% |
| Tablet | 2,513 | 72.3% |
| No Computing Device | 170 | 4.9% |
| Total | 3,474 | 100.0% |
Internet Access in Redlands
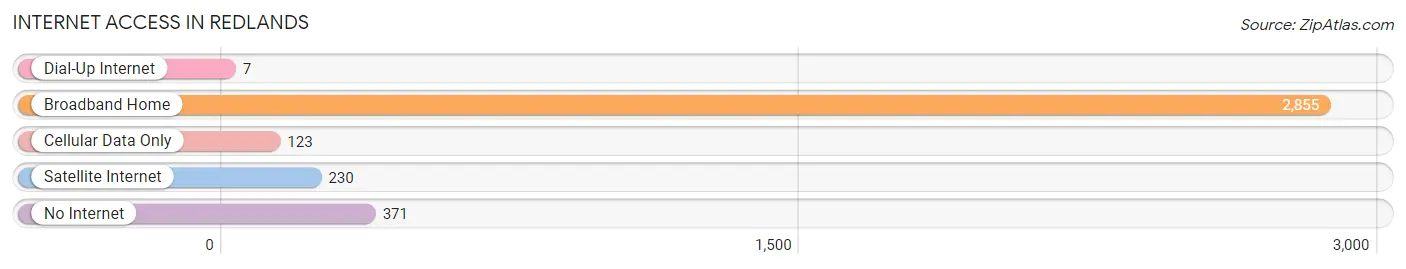
| Internet Type | # Households | % Households |
| Dial-Up Internet | 7 | 0.2% |
| Broadband Home | 2,855 | 82.2% |
| Cellular Data Only | 123 | 3.5% |
| Satellite Internet | 230 | 6.6% |
| No Internet | 371 | 10.7% |
| Total | 3,474 | 100.0% |
Redlands Summary
Redlands, Colorado is a small town located in Mesa County, Colorado. It is situated in the Grand Valley, which is a large agricultural area in western Colorado. The town is located about 10 miles east of Grand Junction, the largest city in the area. Redlands is a rural community with a population of about 8,000 people.
History
The area that is now Redlands was first settled in the late 1800s by homesteaders. The town was originally called Redland, but the name was changed to Redlands in the early 1900s. The town was incorporated in 1906.
The town was originally an agricultural community, with many of the residents working in the nearby orchards and farms. In the 1950s, the town began to grow as the nearby oil and gas industry began to expand. This led to an influx of new residents and businesses.
Geography
Redlands is located in the Grand Valley of western Colorado. The town is situated at an elevation of 4,890 feet above sea level. The town is surrounded by the Bookcliffs to the north and the Grand Mesa to the south. The Colorado River runs through the town, providing a source of irrigation for the local farms and orchards.
The climate in Redlands is semi-arid, with hot summers and cold winters. The average annual temperature is around 50 degrees Fahrenheit. The average annual precipitation is around 11 inches.
Economy
The economy of Redlands is largely based on agriculture. The town is home to several large farms and orchards, which produce a variety of fruits and vegetables. The nearby oil and gas industry also provides jobs for many of the town’s residents.
In addition to agriculture and oil and gas, Redlands is also home to several small businesses. These include restaurants, retail stores, and other services. The town is also home to a number of tourist attractions, including the Colorado National Monument and the Grand Mesa National Forest.
Demographics
As of the 2010 census, the population of Redlands was 8,000. The town is predominantly white, with about 85% of the population identifying as such. The remaining 15% of the population is made up of other races, including Hispanic, African American, and Native American.
The median household income in Redlands is around $50,000. The median home value is around $200,000. The town has a low unemployment rate, with only about 4% of the population out of work.
Redlands is a small town with a rich history and a vibrant economy. The town is home to a diverse population and is a great place to live and work.
Common Questions
What is Per Capita Income in Redlands?
Per Capita income in Redlands is $46,496.
What is the Median Family Income in Redlands?
Median Family Income in Redlands is $108,814.
What is the Median Household income in Redlands?
Median Household Income in Redlands is $93,223.
What is Income or Wage Gap in Redlands?
Income or Wage Gap in Redlands is 38.8%.
Women in Redlands earn 61.2 cents for every dollar earned by a man.
What is Inequality or Gini Index in Redlands?
Inequality or Gini Index in Redlands is 0.44.
What is the Total Population of Redlands?
Total Population of Redlands is 8,914.
What is the Total Male Population of Redlands?
Total Male Population of Redlands is 4,275.
What is the Total Female Population of Redlands?
Total Female Population of Redlands is 4,639.
What is the Ratio of Males per 100 Females in Redlands?
There are 92.15 Males per 100 Females in Redlands.
What is the Ratio of Females per 100 Males in Redlands?
There are 108.51 Females per 100 Males in Redlands.
What is the Median Population Age in Redlands?
Median Population Age in Redlands is 48.5 Years.
What is the Average Family Size in Redlands
Average Family Size in Redlands is 3.0 People.
What is the Average Household Size in Redlands
Average Household Size in Redlands is 2.5 People.
How Large is the Labor Force in Redlands?
There are 3,921 People in the Labor Forcein in Redlands.
What is the Percentage of People in the Labor Force in Redlands?
54.0% of People are in the Labor Force in Redlands.
What is the Unemployment Rate in Redlands?
Unemployment Rate in Redlands is 3.6%.