Erie, CO Map & Demographics
Erie Map
Erie Overview
$60,172
PER CAPITA INCOME
$171,533
AVG FAMILY INCOME
$154,509
AVG HOUSEHOLD INCOME
45.7%
WAGE / INCOME GAP [ % ]
54.3¢/ $1
WAGE / INCOME GAP [ $ ]
0.35
INEQUALITY / GINI INDEX
30,447
TOTAL POPULATION
14,929
MALE POPULATION
15,518
FEMALE POPULATION
96.20
MALES / 100 FEMALES
103.95
FEMALES / 100 MALES
37.4
MEDIAN AGE
3.2
AVG FAMILY SIZE
2.9
AVG HOUSEHOLD SIZE
16,852
LABOR FORCE [ PEOPLE ]
76.4%
PERCENT IN LABOR FORCE
4.0%
UNEMPLOYMENT RATE
Erie Zip Codes
Income in Erie
Income Overview in Erie
Per Capita Income in Erie is $60,172, while median incomes of families and households are $171,533 and $154,509 respectively.
| Characteristic | Number | Measure |
| Per Capita Income | 30,447 | $60,172 |
| Median Family Income | 8,454 | $171,533 |
| Mean Family Income | 8,454 | $187,113 |
| Median Household Income | 10,585 | $154,509 |
| Mean Household Income | 10,585 | $171,580 |
| Income Deficit | 8,454 | $0 |
| Wage / Income Gap (%) | 30,447 | 45.65% |
| Wage / Income Gap ($) | 30,447 | 54.35¢ per $1 |
| Gini / Inequality Index | 30,447 | 0.35 |
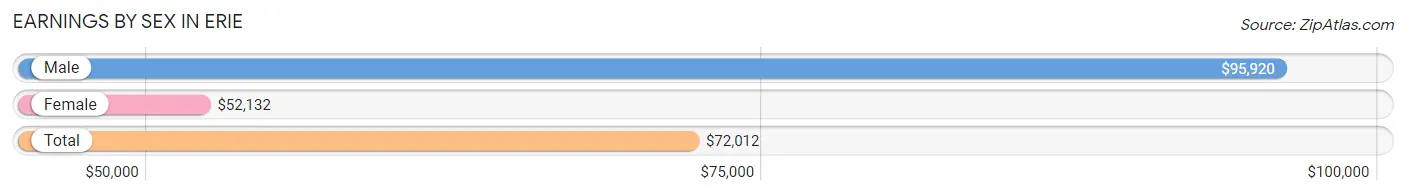
Earnings by Sex in Erie
Average Earnings in Erie are $72,012, $95,920 for men and $52,132 for women, a difference of 45.7%.
| Sex | Number | Average Earnings |
| Male | 9,015 (51.9%) | $95,920 |
| Female | 8,337 (48.0%) | $52,132 |
| Total | 17,352 (100.0%) | $72,012 |
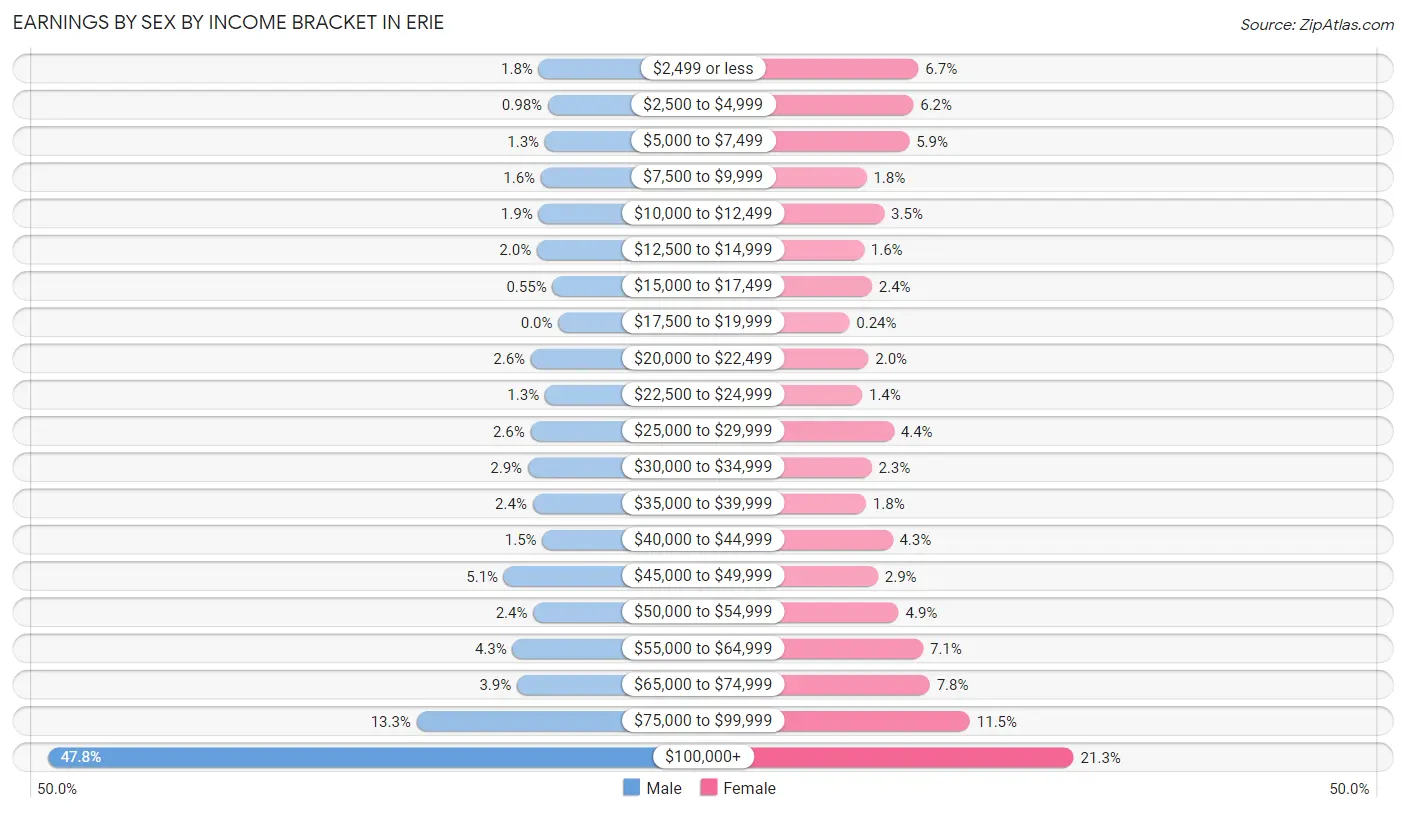
Earnings by Sex by Income Bracket in Erie
The most common earnings brackets in Erie are $100,000+ for men (4,312 | 47.8%) and $100,000+ for women (1,772 | 21.2%).
| Income | Male | Female |
| $2,499 or less | 166 (1.8%) | 559 (6.7%) |
| $2,500 to $4,999 | 88 (1.0%) | 519 (6.2%) |
| $5,000 to $7,499 | 114 (1.3%) | 488 (5.9%) |
| $7,500 to $9,999 | 147 (1.6%) | 153 (1.8%) |
| $10,000 to $12,499 | 168 (1.9%) | 292 (3.5%) |
| $12,500 to $14,999 | 180 (2.0%) | 133 (1.6%) |
| $15,000 to $17,499 | 50 (0.5%) | 196 (2.4%) |
| $17,500 to $19,999 | 0 (0.0%) | 20 (0.2%) |
| $20,000 to $22,499 | 232 (2.6%) | 168 (2.0%) |
| $22,500 to $24,999 | 113 (1.3%) | 119 (1.4%) |
| $25,000 to $29,999 | 234 (2.6%) | 368 (4.4%) |
| $30,000 to $34,999 | 257 (2.9%) | 193 (2.3%) |
| $35,000 to $39,999 | 216 (2.4%) | 149 (1.8%) |
| $40,000 to $44,999 | 134 (1.5%) | 357 (4.3%) |
| $45,000 to $49,999 | 460 (5.1%) | 243 (2.9%) |
| $50,000 to $54,999 | 212 (2.4%) | 404 (4.9%) |
| $55,000 to $64,999 | 387 (4.3%) | 595 (7.1%) |
| $65,000 to $74,999 | 349 (3.9%) | 648 (7.8%) |
| $75,000 to $99,999 | 1,196 (13.3%) | 961 (11.5%) |
| $100,000+ | 4,312 (47.8%) | 1,772 (21.2%) |
| Total | 9,015 (100.0%) | 8,337 (100.0%) |
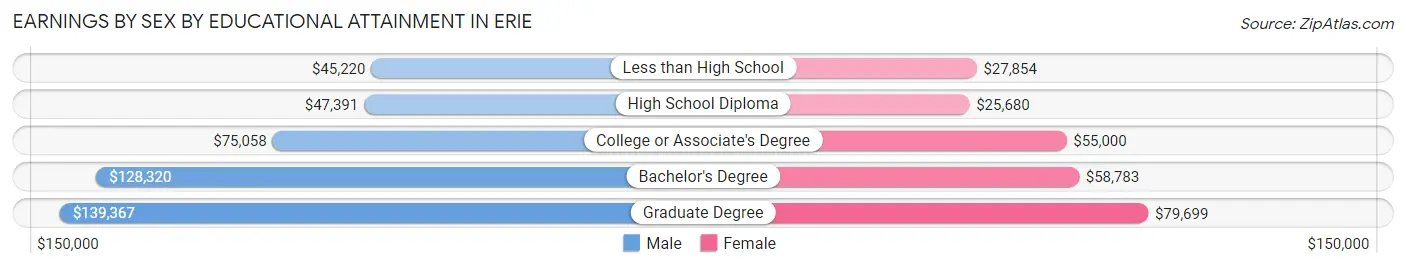
Earnings by Sex by Educational Attainment in Erie
Average earnings in Erie are $109,477 for men and $58,250 for women, a difference of 46.8%. Men with an educational attainment of graduate degree enjoy the highest average annual earnings of $139,367, while those with less than high school education earn the least with $45,220. Women with an educational attainment of graduate degree earn the most with the average annual earnings of $79,699, while those with high school diploma education have the smallest earnings of $25,680.
| Educational Attainment | Male Income | Female Income |
| Less than High School | $45,220 | $27,854 |
| High School Diploma | $47,391 | $25,680 |
| College or Associate's Degree | $75,058 | $55,000 |
| Bachelor's Degree | $128,320 | $58,783 |
| Graduate Degree | $139,367 | $79,699 |
| Total | $109,477 | $58,250 |
Family Income in Erie
Family Income Brackets in Erie
According to the Erie family income data, there are 2,925 families falling into the $200,000+ income range, which is the most common income bracket and makes up 34.6% of all families. Conversely, the $10,000 to $14,999 income bracket is the least frequent group with only 59 families (0.7%) belonging to this category.
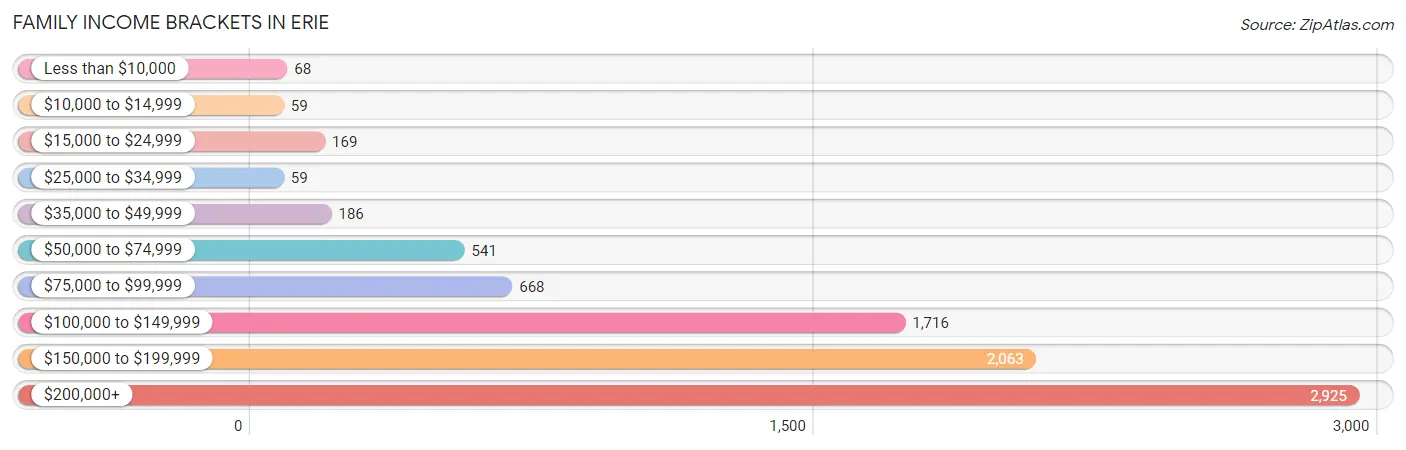
| Income Bracket | # Families | % Families |
| Less than $10,000 | 68 | 0.8% |
| $10,000 to $14,999 | 59 | 0.7% |
| $15,000 to $24,999 | 169 | 2.0% |
| $25,000 to $34,999 | 59 | 0.7% |
| $35,000 to $49,999 | 186 | 2.2% |
| $50,000 to $74,999 | 541 | 6.4% |
| $75,000 to $99,999 | 668 | 7.9% |
| $100,000 to $149,999 | 1,716 | 20.3% |
| $150,000 to $199,999 | 2,063 | 24.4% |
| $200,000+ | 2,925 | 34.6% |
Family Income by Famaliy Size in Erie
5-person families (805 | 9.5%) account for the highest median family income in Erie with $198,281 per family, while 2-person families (3,398 | 40.2%) have the highest median income of $69,774 per family member.
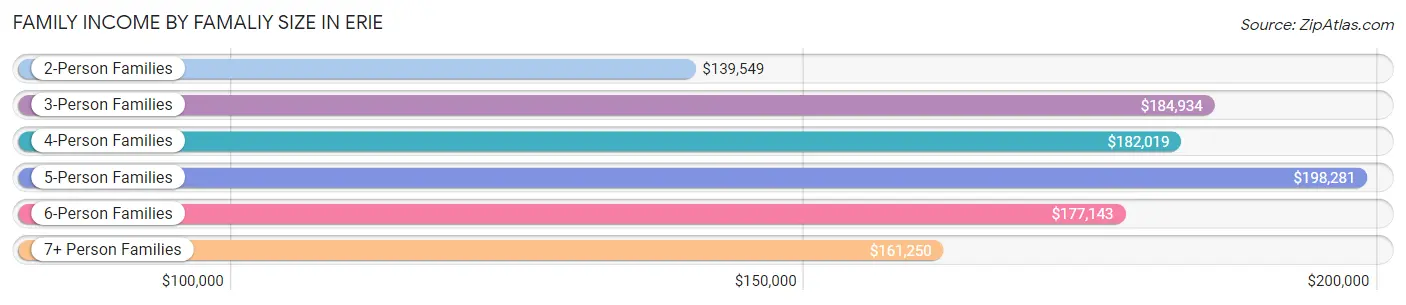
| Income Bracket | # Families | Median Income |
| 2-Person Families | 3,398 (40.2%) | $139,549 |
| 3-Person Families | 1,597 (18.9%) | $184,934 |
| 4-Person Families | 2,307 (27.3%) | $182,019 |
| 5-Person Families | 805 (9.5%) | $198,281 |
| 6-Person Families | 312 (3.7%) | $177,143 |
| 7+ Person Families | 35 (0.4%) | $161,250 |
| Total | 8,454 (100.0%) | $171,533 |
Family Income by Number of Earners in Erie
The median family income in Erie is $171,533, with families comprising 3+ earners (880) having the highest median family income of $206,667, while families with no earners (645) have the lowest median family income of $107,557, accounting for 10.4% and 7.6% of families, respectively.
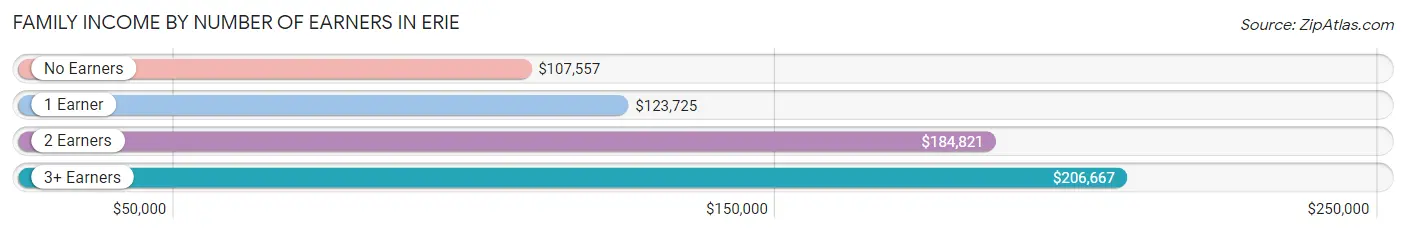
| Number of Earners | # Families | Median Income |
| No Earners | 645 (7.6%) | $107,557 |
| 1 Earner | 2,082 (24.6%) | $123,725 |
| 2 Earners | 4,847 (57.3%) | $184,821 |
| 3+ Earners | 880 (10.4%) | $206,667 |
| Total | 8,454 (100.0%) | $171,533 |
Household Income in Erie
Household Income Brackets in Erie
With 3,207 households falling in the category, the $200,000+ income range is the most frequent in Erie, accounting for 30.3% of all households. In contrast, only 53 households (0.5%) fall into the less than $10,000 income bracket, making it the least populous group.
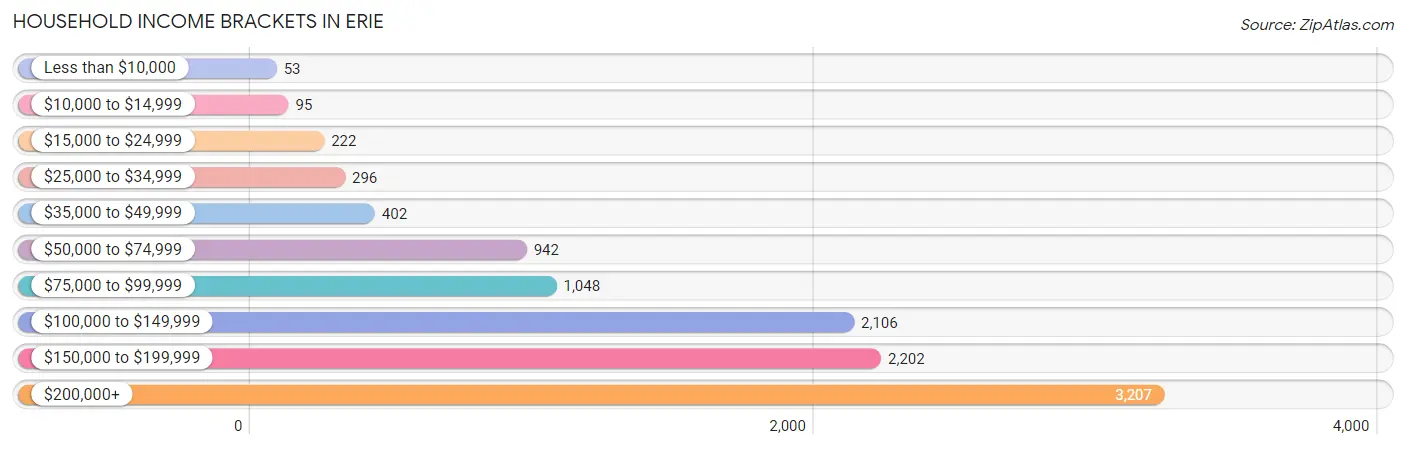
| Income Bracket | # Households | % Households |
| Less than $10,000 | 53 | 0.5% |
| $10,000 to $14,999 | 95 | 0.9% |
| $15,000 to $24,999 | 222 | 2.1% |
| $25,000 to $34,999 | 296 | 2.8% |
| $35,000 to $49,999 | 402 | 3.8% |
| $50,000 to $74,999 | 942 | 8.9% |
| $75,000 to $99,999 | 1,048 | 9.9% |
| $100,000 to $149,999 | 2,106 | 19.9% |
| $150,000 to $199,999 | 2,202 | 20.8% |
| $200,000+ | 3,207 | 30.3% |
Household Income by Householder Age in Erie
The median household income in Erie is $154,509, with the highest median household income of $176,522 found in the 45 to 64 years age bracket for the primary householder. A total of 4,674 households (44.2%) fall into this category. Meanwhile, the 15 to 24 years age bracket for the primary householder has the lowest median household income of $60,848, with 188 households (1.8%) in this group.
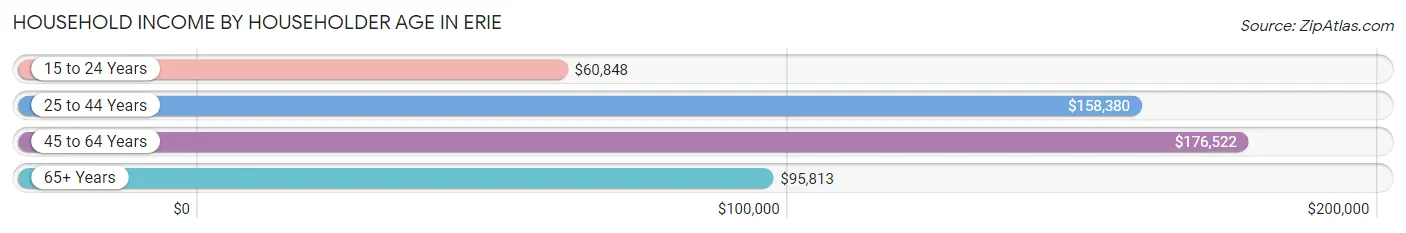
| Income Bracket | # Households | Median Income |
| 15 to 24 Years | 188 (1.8%) | $60,848 |
| 25 to 44 Years | 4,005 (37.8%) | $158,380 |
| 45 to 64 Years | 4,674 (44.2%) | $176,522 |
| 65+ Years | 1,718 (16.2%) | $95,813 |
| Total | 10,585 (100.0%) | $154,509 |
Poverty in Erie
Income Below Poverty by Sex and Age in Erie
With 2.5% poverty level for males and 3.9% for females among the residents of Erie, 18 to 24 year old males and 18 to 24 year old females are the most vulnerable to poverty, with 58 males (7.4%) and 109 females (13.3%) in their respective age groups living below the poverty level.
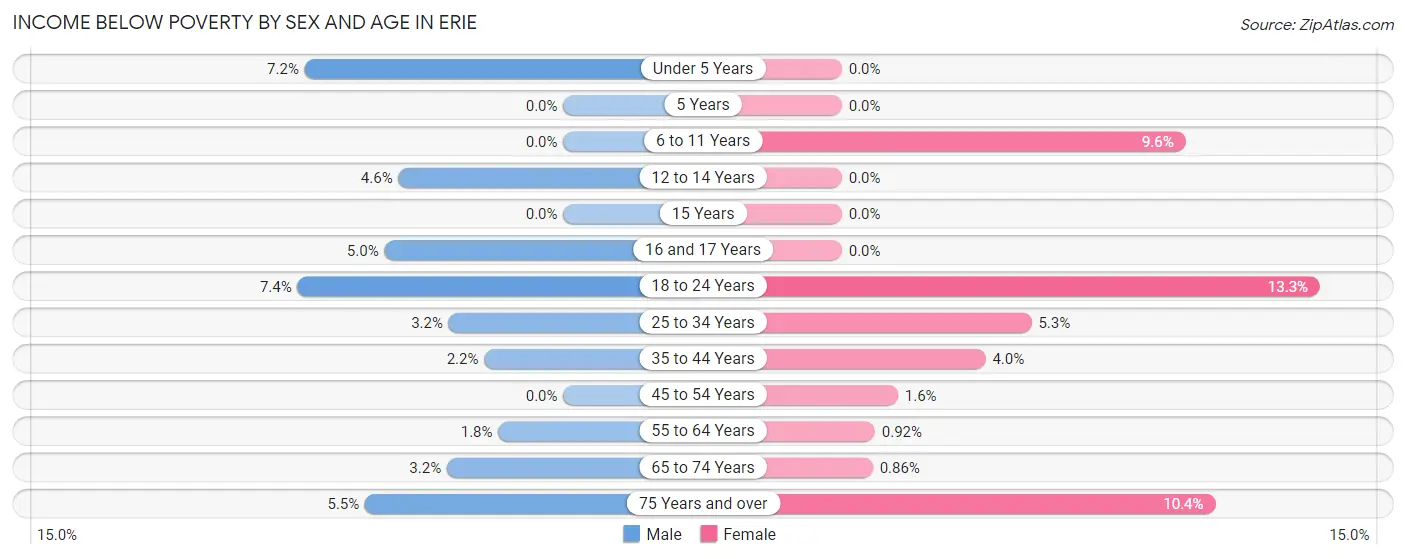
| Age Bracket | Male | Female |
| Under 5 Years | 56 (7.2%) | 0 (0.0%) |
| 5 Years | 0 (0.0%) | 0 (0.0%) |
| 6 to 11 Years | 0 (0.0%) | 173 (9.6%) |
| 12 to 14 Years | 48 (4.6%) | 0 (0.0%) |
| 15 Years | 0 (0.0%) | 0 (0.0%) |
| 16 and 17 Years | 24 (5.0%) | 0 (0.0%) |
| 18 to 24 Years | 58 (7.4%) | 109 (13.3%) |
| 25 to 34 Years | 47 (3.2%) | 83 (5.3%) |
| 35 to 44 Years | 55 (2.2%) | 121 (4.0%) |
| 45 to 54 Years | 0 (0.0%) | 34 (1.6%) |
| 55 to 64 Years | 30 (1.8%) | 15 (0.9%) |
| 65 to 74 Years | 29 (3.2%) | 9 (0.9%) |
| 75 Years and over | 27 (5.5%) | 54 (10.4%) |
| Total | 374 (2.5%) | 598 (3.9%) |
Income Above Poverty by Sex and Age in Erie
According to the poverty statistics in Erie, males aged 5 years and females aged under 5 years are the age groups that are most secure financially, with 100.0% of males and 100.0% of females in these age groups living above the poverty line.
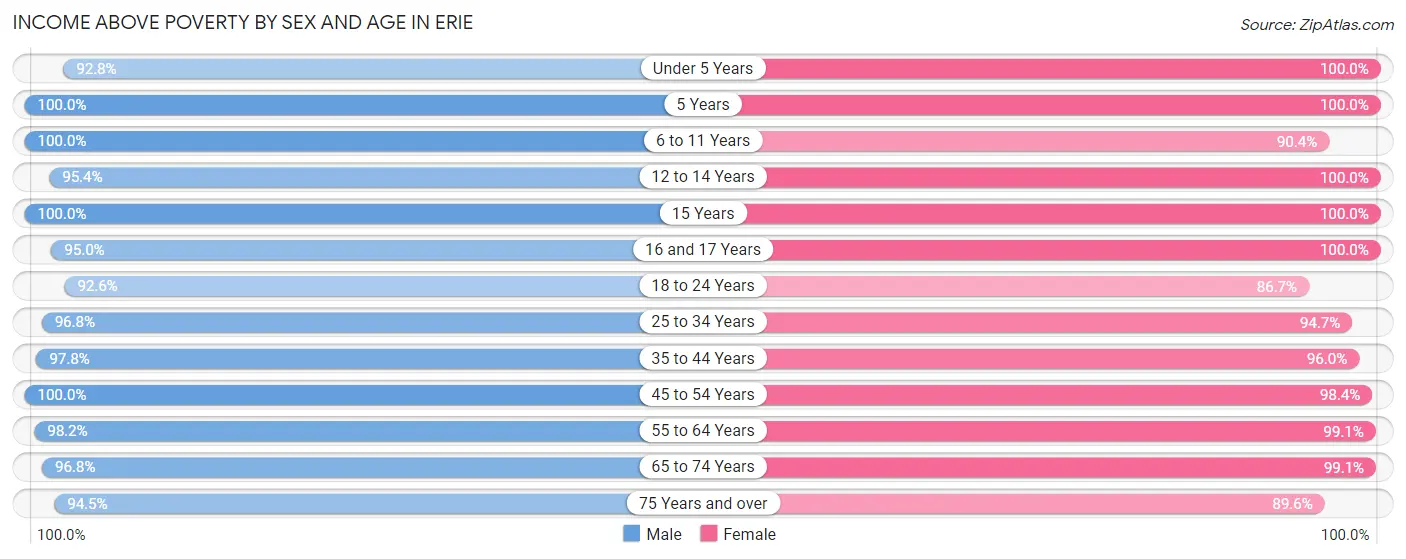
| Age Bracket | Male | Female |
| Under 5 Years | 722 (92.8%) | 1,316 (100.0%) |
| 5 Years | 316 (100.0%) | 300 (100.0%) |
| 6 to 11 Years | 1,560 (100.0%) | 1,635 (90.4%) |
| 12 to 14 Years | 998 (95.4%) | 704 (100.0%) |
| 15 Years | 323 (100.0%) | 226 (100.0%) |
| 16 and 17 Years | 458 (95.0%) | 347 (100.0%) |
| 18 to 24 Years | 726 (92.6%) | 710 (86.7%) |
| 25 to 34 Years | 1,427 (96.8%) | 1,490 (94.7%) |
| 35 to 44 Years | 2,442 (97.8%) | 2,907 (96.0%) |
| 45 to 54 Years | 2,597 (100.0%) | 2,152 (98.4%) |
| 55 to 64 Years | 1,629 (98.2%) | 1,609 (99.1%) |
| 65 to 74 Years | 866 (96.8%) | 1,034 (99.1%) |
| 75 Years and over | 462 (94.5%) | 465 (89.6%) |
| Total | 14,526 (97.5%) | 14,895 (96.1%) |
Income Below Poverty Among Married-Couple Families in Erie
The poverty statistics for married-couple families in Erie show that 1.3% or 93 of the total 7,236 families live below the poverty line. Families with 1 or 2 children have the highest poverty rate of 1.5%, comprising of 51 families. On the other hand, families with 3 or 4 children have the lowest poverty rate of 0.0%, which includes 0 families.
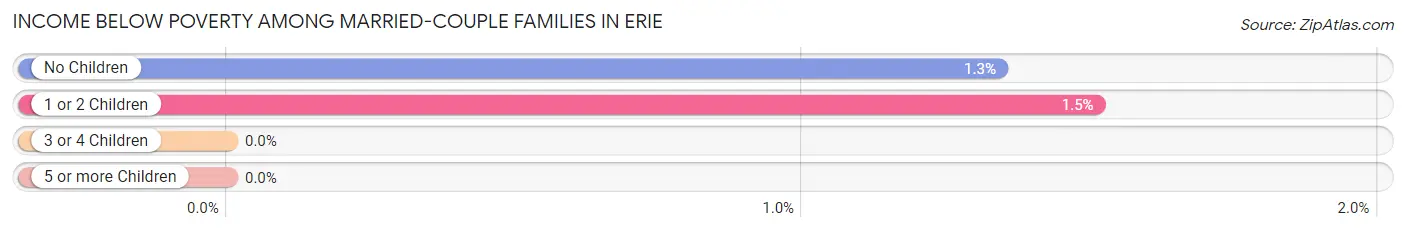
| Children | Above Poverty | Below Poverty |
| No Children | 3,087 (98.7%) | 42 (1.3%) |
| 1 or 2 Children | 3,317 (98.5%) | 51 (1.5%) |
| 3 or 4 Children | 724 (100.0%) | 0 (0.0%) |
| 5 or more Children | 15 (100.0%) | 0 (0.0%) |
| Total | 7,143 (98.7%) | 93 (1.3%) |
Income Below Poverty Among Single-Parent Households in Erie
According to the poverty data in Erie, 3.6% or 13 single-father households and 12.5% or 107 single-mother households are living below the poverty line. Among single-father households, those with 1 or 2 children have the highest poverty rate, with 13 households (10.9%) experiencing poverty. Likewise, among single-mother households, those with 1 or 2 children have the highest poverty rate, with 107 households (18.5%) falling below the poverty line.
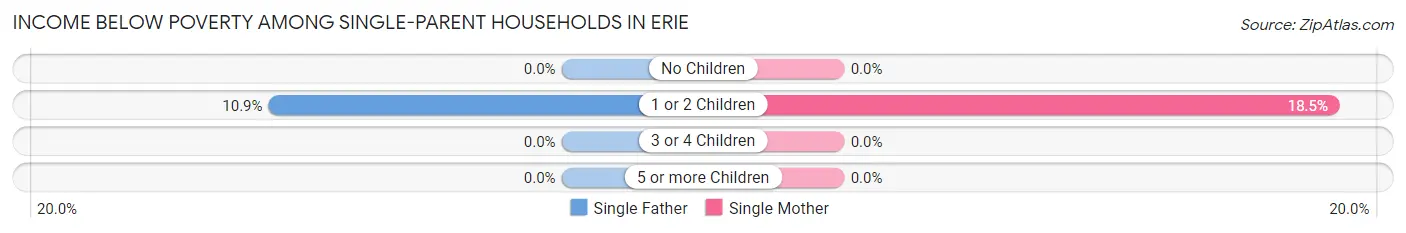
| Children | Single Father | Single Mother |
| No Children | 0 (0.0%) | 0 (0.0%) |
| 1 or 2 Children | 13 (10.9%) | 107 (18.5%) |
| 3 or 4 Children | 0 (0.0%) | 0 (0.0%) |
| 5 or more Children | 0 (0.0%) | 0 (0.0%) |
| Total | 13 (3.6%) | 107 (12.5%) |
Income Below Poverty Among Married-Couple vs Single-Parent Households in Erie
The poverty data for Erie shows that 93 of the married-couple family households (1.3%) and 120 of the single-parent households (9.9%) are living below the poverty level. Within the married-couple family households, those with 1 or 2 children have the highest poverty rate, with 51 households (1.5%) falling below the poverty line. Among the single-parent households, those with 1 or 2 children have the highest poverty rate, with 120 household (17.2%) living below poverty.
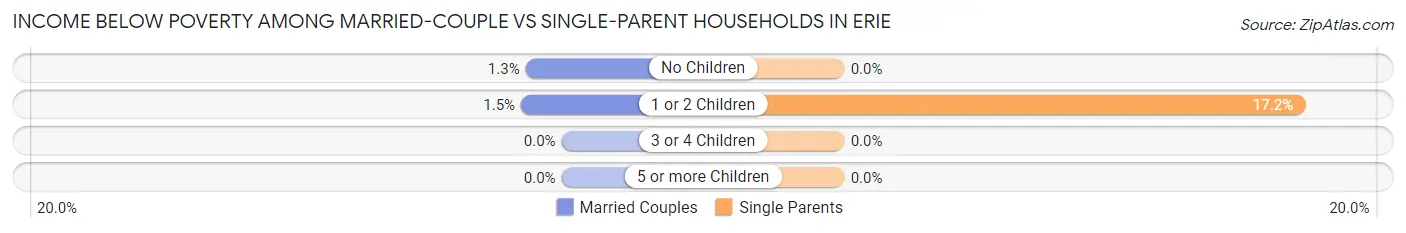
| Children | Married-Couple Families | Single-Parent Households |
| No Children | 42 (1.3%) | 0 (0.0%) |
| 1 or 2 Children | 51 (1.5%) | 120 (17.2%) |
| 3 or 4 Children | 0 (0.0%) | 0 (0.0%) |
| 5 or more Children | 0 (0.0%) | 0 (0.0%) |
| Total | 93 (1.3%) | 120 (9.9%) |
Race in Erie
The most populous races in Erie are White / Caucasian (25,835 | 84.9%), Hispanic or Latino (3,261 | 10.7%), and Two or more Races (2,424 | 8.0%).
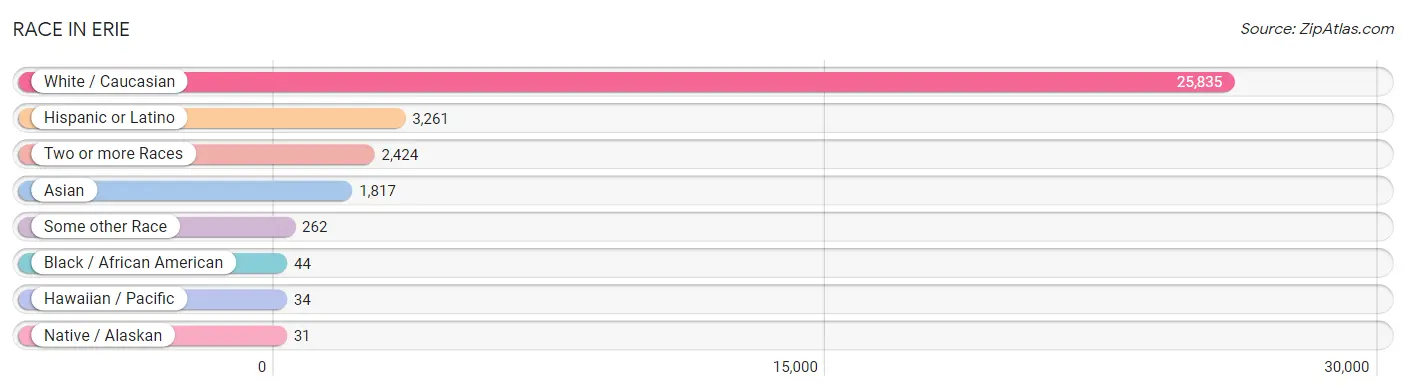
| Race | # Population | % Population |
| Asian | 1,817 | 6.0% |
| Black / African American | 44 | 0.1% |
| Hawaiian / Pacific | 34 | 0.1% |
| Hispanic or Latino | 3,261 | 10.7% |
| Native / Alaskan | 31 | 0.1% |
| White / Caucasian | 25,835 | 84.9% |
| Two or more Races | 2,424 | 8.0% |
| Some other Race | 262 | 0.9% |
| Total | 30,447 | 100.0% |
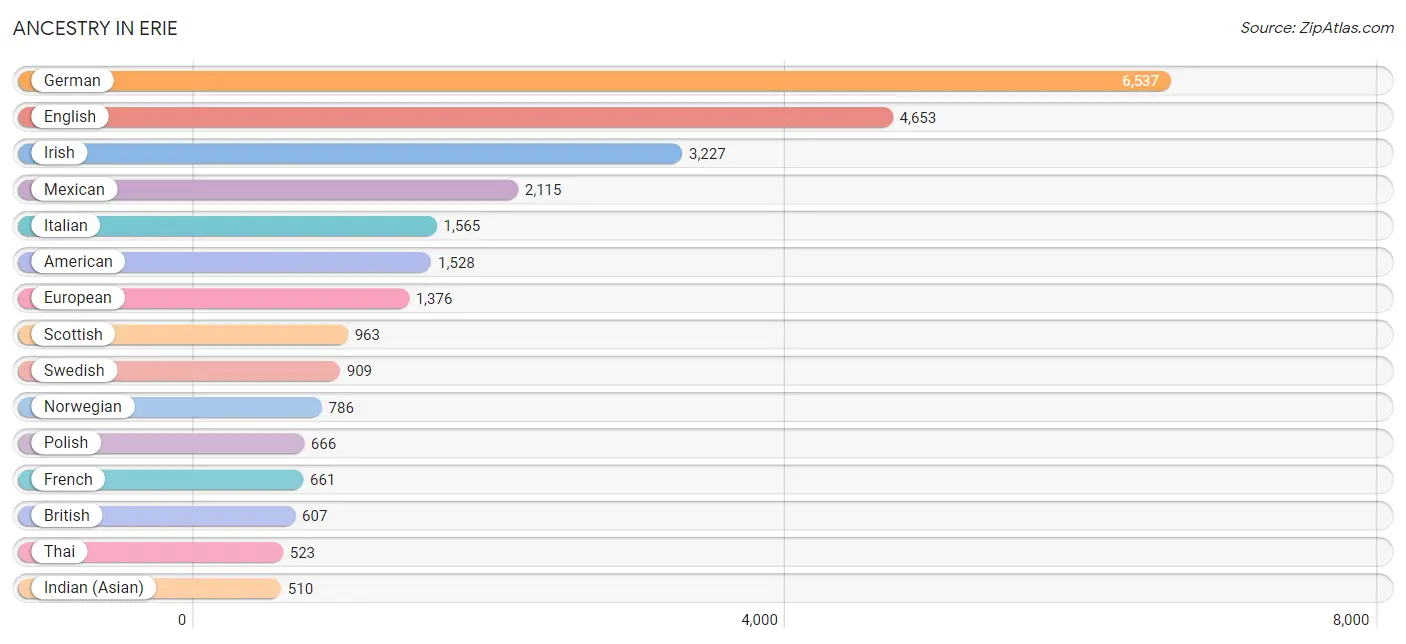
Ancestry in Erie
The most populous ancestries reported in Erie are German (6,537 | 21.5%), English (4,653 | 15.3%), Irish (3,227 | 10.6%), Mexican (2,115 | 7.0%), and Italian (1,565 | 5.1%), together accounting for 59.4% of all Erie residents.
| Ancestry | # Population | % Population |
| African | 32 | 0.1% |
| American | 1,528 | 5.0% |
| Apache | 59 | 0.2% |
| Arab | 24 | 0.1% |
| Argentinean | 125 | 0.4% |
| Armenian | 75 | 0.3% |
| Australian | 13 | 0.0% |
| Austrian | 310 | 1.0% |
| Bangladeshi | 358 | 1.2% |
| Belgian | 115 | 0.4% |
| Bhutanese | 193 | 0.6% |
| British | 607 | 2.0% |
| Burmese | 198 | 0.6% |
| Canadian | 57 | 0.2% |
| Central American | 104 | 0.3% |
| Cherokee | 41 | 0.1% |
| Colombian | 74 | 0.2% |
| Costa Rican | 11 | 0.0% |
| Croatian | 81 | 0.3% |
| Cuban | 91 | 0.3% |
| Czech | 463 | 1.5% |
| Czechoslovakian | 15 | 0.1% |
| Danish | 320 | 1.1% |
| Dutch | 333 | 1.1% |
| Eastern European | 224 | 0.7% |
| Ecuadorian | 121 | 0.4% |
| English | 4,653 | 15.3% |
| Estonian | 26 | 0.1% |
| European | 1,376 | 4.5% |
| Filipino | 20 | 0.1% |
| Finnish | 88 | 0.3% |
| French | 661 | 2.2% |
| French Canadian | 257 | 0.8% |
| German | 6,537 | 21.5% |
| Greek | 70 | 0.2% |
| Guamanian / Chamorro | 34 | 0.1% |
| Guatemalan | 13 | 0.0% |
| Honduran | 11 | 0.0% |
| Hungarian | 224 | 0.7% |
| Indian (Asian) | 510 | 1.7% |
| Iranian | 43 | 0.1% |
| Irish | 3,227 | 10.6% |
| Italian | 1,565 | 5.1% |
| Jamaican | 10 | 0.0% |
| Japanese | 36 | 0.1% |
| Korean | 206 | 0.7% |
| Latvian | 12 | 0.0% |
| Lebanese | 7 | 0.0% |
| Lithuanian | 136 | 0.4% |
| Malaysian | 25 | 0.1% |
| Mexican | 2,115 | 7.0% |
| Native Hawaiian | 10 | 0.0% |
| Northern European | 118 | 0.4% |
| Norwegian | 786 | 2.6% |
| Pakistani | 17 | 0.1% |
| Polish | 666 | 2.2% |
| Portuguese | 11 | 0.0% |
| Puerto Rican | 215 | 0.7% |
| Romanian | 47 | 0.2% |
| Russian | 420 | 1.4% |
| Salvadoran | 69 | 0.2% |
| Scandinavian | 178 | 0.6% |
| Scotch-Irish | 315 | 1.0% |
| Scottish | 963 | 3.2% |
| Seminole | 14 | 0.1% |
| Serbian | 61 | 0.2% |
| Slavic | 11 | 0.0% |
| Slovak | 58 | 0.2% |
| Slovene | 15 | 0.1% |
| South American | 337 | 1.1% |
| Spaniard | 101 | 0.3% |
| Spanish | 206 | 0.7% |
| Sri Lankan | 322 | 1.1% |
| Subsaharan African | 32 | 0.1% |
| Swedish | 909 | 3.0% |
| Swiss | 32 | 0.1% |
| Thai | 523 | 1.7% |
| Ukrainian | 161 | 0.5% |
| Venezuelan | 17 | 0.1% |
| Welsh | 460 | 1.5% | View All 80 Rows |
Immigrants in Erie
The most numerous immigrant groups reported in Erie came from Asia (1,330 | 4.4%), Europe (804 | 2.6%), South Central Asia (648 | 2.1%), India (573 | 1.9%), and Latin America (382 | 1.3%), together accounting for 12.3% of all Erie residents.
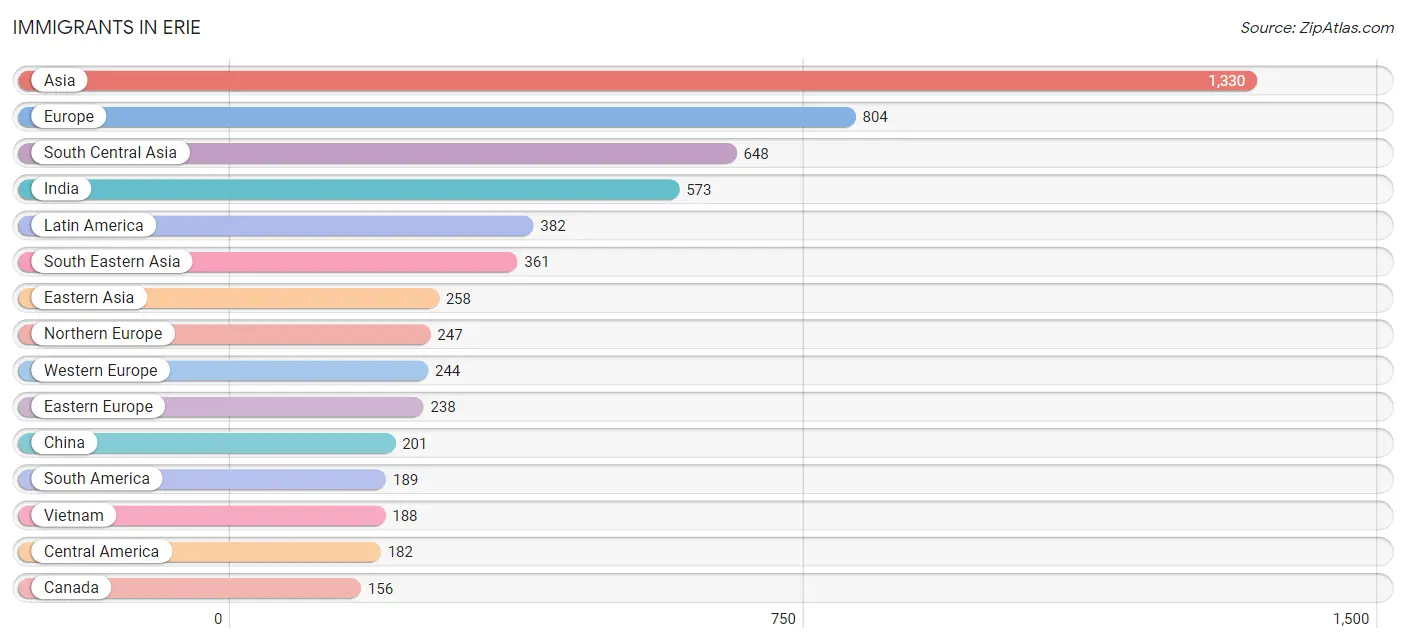
| Immigration Origin | # Population | % Population |
| Africa | 7 | 0.0% |
| Argentina | 125 | 0.4% |
| Asia | 1,330 | 4.4% |
| Australia | 10 | 0.0% |
| Austria | 31 | 0.1% |
| Belarus | 4 | 0.0% |
| Belgium | 66 | 0.2% |
| Cambodia | 36 | 0.1% |
| Canada | 156 | 0.5% |
| Caribbean | 11 | 0.0% |
| Central America | 182 | 0.6% |
| China | 201 | 0.7% |
| Colombia | 47 | 0.2% |
| Costa Rica | 11 | 0.0% |
| Cuba | 1 | 0.0% |
| Czechoslovakia | 14 | 0.1% |
| Eastern Africa | 7 | 0.0% |
| Eastern Asia | 258 | 0.9% |
| Eastern Europe | 238 | 0.8% |
| El Salvador | 34 | 0.1% |
| England | 115 | 0.4% |
| Europe | 804 | 2.6% |
| Germany | 131 | 0.4% |
| Greece | 16 | 0.1% |
| Guatemala | 13 | 0.0% |
| Hungary | 6 | 0.0% |
| India | 573 | 1.9% |
| Iran | 43 | 0.1% |
| Israel | 30 | 0.1% |
| Italy | 11 | 0.0% |
| Jamaica | 10 | 0.0% |
| Japan | 5 | 0.0% |
| Korea | 52 | 0.2% |
| Laos | 45 | 0.2% |
| Latin America | 382 | 1.3% |
| Mexico | 124 | 0.4% |
| Netherlands | 16 | 0.1% |
| Northern Europe | 247 | 0.8% |
| Oceania | 10 | 0.0% |
| Philippines | 92 | 0.3% |
| Poland | 61 | 0.2% |
| Russia | 104 | 0.3% |
| Serbia | 19 | 0.1% |
| South America | 189 | 0.6% |
| South Central Asia | 648 | 2.1% |
| South Eastern Asia | 361 | 1.2% |
| Southern Europe | 75 | 0.3% |
| Spain | 48 | 0.2% |
| Sri Lanka | 32 | 0.1% |
| Syria | 15 | 0.1% |
| Taiwan | 20 | 0.1% |
| Turkey | 18 | 0.1% |
| Venezuela | 17 | 0.1% |
| Vietnam | 188 | 0.6% |
| Western Asia | 63 | 0.2% |
| Western Europe | 244 | 0.8% | View All 56 Rows |
Sex and Age in Erie
Sex and Age in Erie
The most populous age groups in Erie are 10 to 14 Years (1,724 | 11.6%) for men and 40 to 44 Years (1,599 | 10.3%) for women.
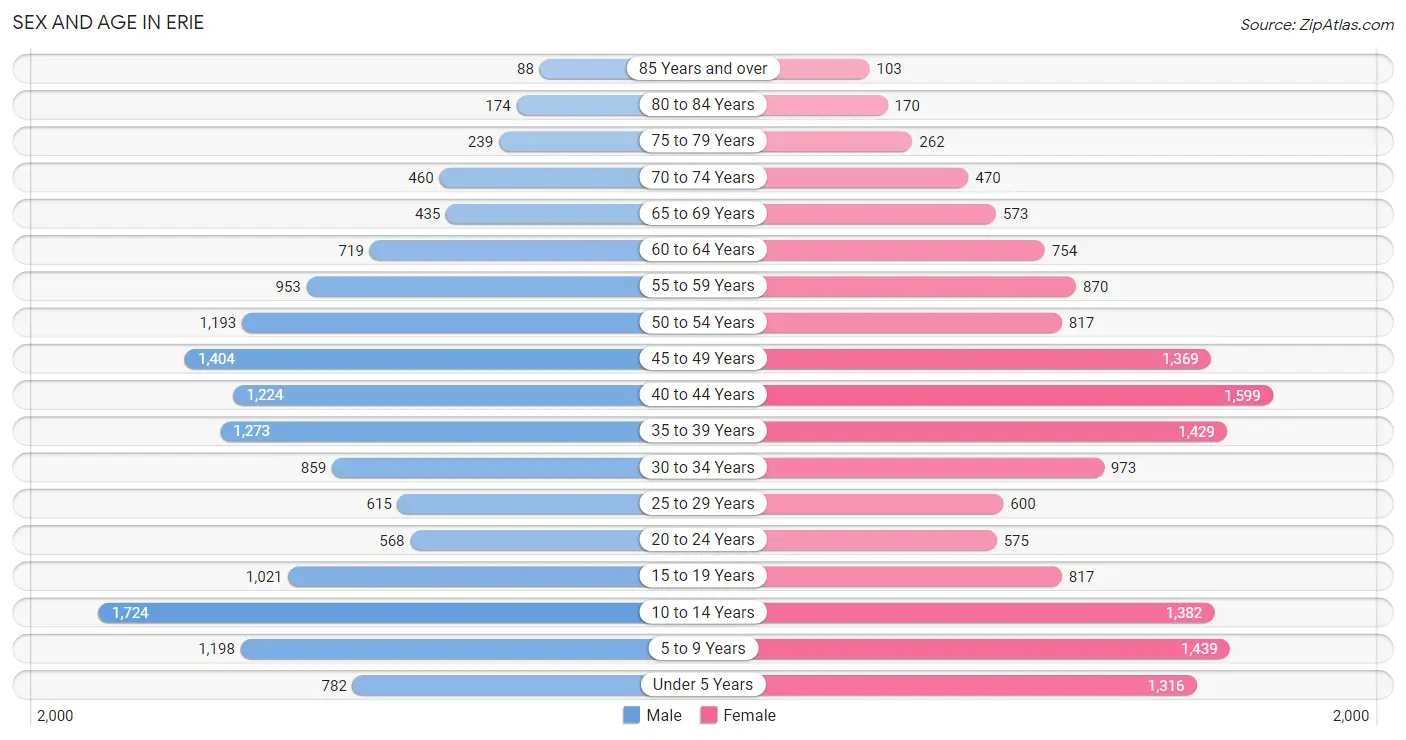
| Age Bracket | Male | Female |
| Under 5 Years | 782 (5.2%) | 1,316 (8.5%) |
| 5 to 9 Years | 1,198 (8.0%) | 1,439 (9.3%) |
| 10 to 14 Years | 1,724 (11.6%) | 1,382 (8.9%) |
| 15 to 19 Years | 1,021 (6.8%) | 817 (5.3%) |
| 20 to 24 Years | 568 (3.8%) | 575 (3.7%) |
| 25 to 29 Years | 615 (4.1%) | 600 (3.9%) |
| 30 to 34 Years | 859 (5.8%) | 973 (6.3%) |
| 35 to 39 Years | 1,273 (8.5%) | 1,429 (9.2%) |
| 40 to 44 Years | 1,224 (8.2%) | 1,599 (10.3%) |
| 45 to 49 Years | 1,404 (9.4%) | 1,369 (8.8%) |
| 50 to 54 Years | 1,193 (8.0%) | 817 (5.3%) |
| 55 to 59 Years | 953 (6.4%) | 870 (5.6%) |
| 60 to 64 Years | 719 (4.8%) | 754 (4.9%) |
| 65 to 69 Years | 435 (2.9%) | 573 (3.7%) |
| 70 to 74 Years | 460 (3.1%) | 470 (3.0%) |
| 75 to 79 Years | 239 (1.6%) | 262 (1.7%) |
| 80 to 84 Years | 174 (1.2%) | 170 (1.1%) |
| 85 Years and over | 88 (0.6%) | 103 (0.7%) |
| Total | 14,929 (100.0%) | 15,518 (100.0%) |
Families and Households in Erie
Median Family Size in Erie
The median family size in Erie is 3.21 persons per family, with married-couple families (7,236 | 85.6%) accounting for the largest median family size of 3.3 persons per family. On the other hand, single male/father families (360 | 4.3%) represent the smallest median family size with 2.45 persons per family.
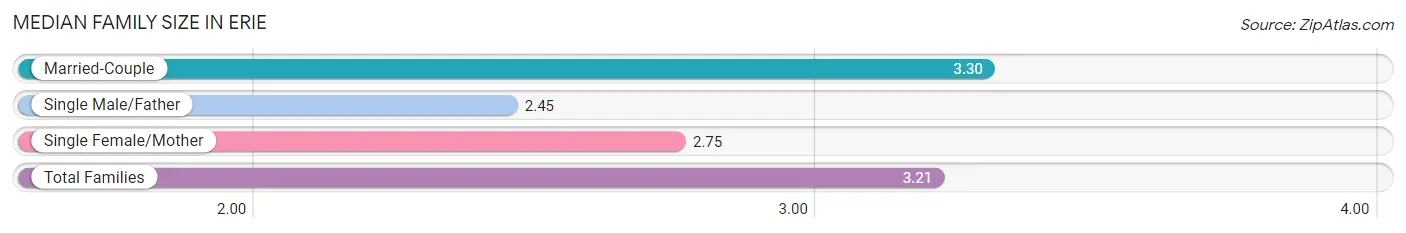
| Family Type | # Families | Family Size |
| Married-Couple | 7,236 (85.6%) | 3.30 |
| Single Male/Father | 360 (4.3%) | 2.45 |
| Single Female/Mother | 858 (10.2%) | 2.75 |
| Total Families | 8,454 (100.0%) | 3.21 |
Median Household Size in Erie
The median household size in Erie is 2.87 persons per household, with married-couple households (7,236 | 68.4%) accounting for the largest median household size of 3.31 persons per household. non-family households (2,131 | 20.1%) represent the smallest median household size with 1.37 persons per household.
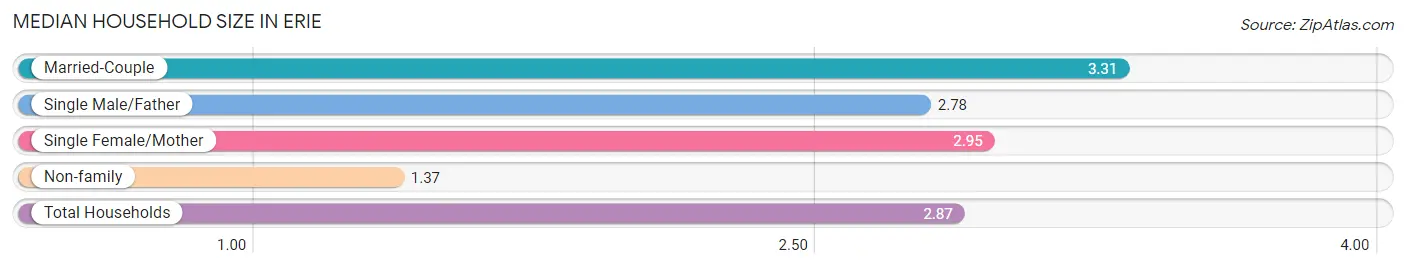
| Household Type | # Households | Household Size |
| Married-Couple | 7,236 (68.4%) | 3.31 |
| Single Male/Father | 360 (3.4%) | 2.78 |
| Single Female/Mother | 858 (8.1%) | 2.95 |
| Non-family | 2,131 (20.1%) | 1.37 |
| Total Households | 10,585 (100.0%) | 2.87 |
Household Size by Marriage Status in Erie
Out of a total of 10,585 households in Erie, 8,454 (79.9%) are family households, while 2,131 (20.1%) are nonfamily households. The most numerous type of family households are 2-person households, comprising 3,190, and the most common type of nonfamily households are 1-person households, comprising 1,592.
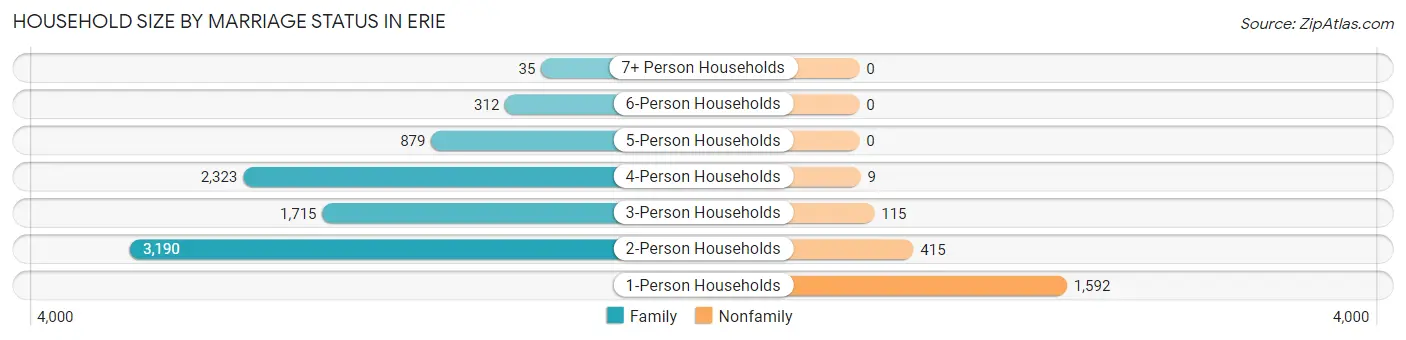
| Household Size | Family Households | Nonfamily Households |
| 1-Person Households | - | 1,592 (15.0%) |
| 2-Person Households | 3,190 (30.1%) | 415 (3.9%) |
| 3-Person Households | 1,715 (16.2%) | 115 (1.1%) |
| 4-Person Households | 2,323 (22.0%) | 9 (0.1%) |
| 5-Person Households | 879 (8.3%) | 0 (0.0%) |
| 6-Person Households | 312 (2.9%) | 0 (0.0%) |
| 7+ Person Households | 35 (0.3%) | 0 (0.0%) |
| Total | 8,454 (79.9%) | 2,131 (20.1%) |
Female Fertility in Erie
Fertility by Age in Erie
Average fertility rate in Erie is 38.0 births per 1,000 women. Women in the age bracket of 20 to 34 years have the highest fertility rate with 98.0 births per 1,000 women. Women in the age bracket of 20 to 34 years acount for 73.2% of all women with births.
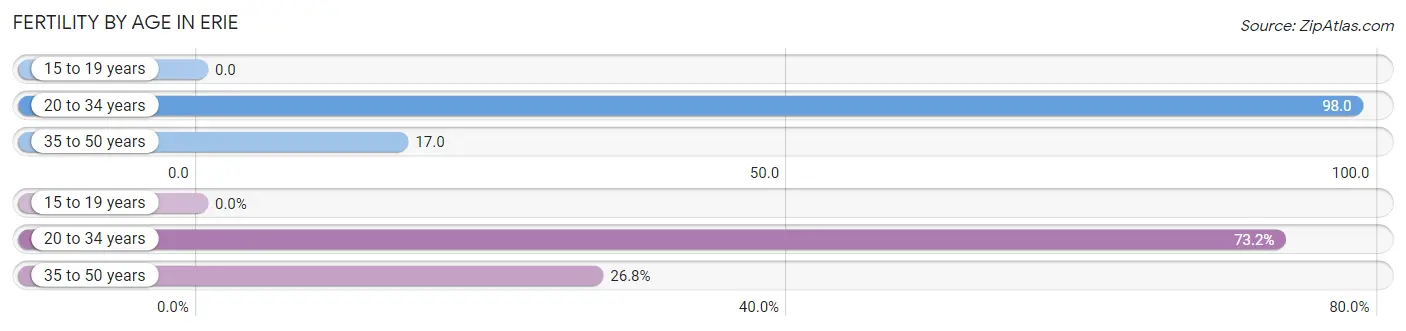
| Age Bracket | Women with Births | Births / 1,000 Women |
| 15 to 19 years | 0 (0.0%) | 0.0 |
| 20 to 34 years | 210 (73.2%) | 98.0 |
| 35 to 50 years | 77 (26.8%) | 17.0 |
| Total | 287 (100.0%) | 38.0 |
Fertility by Age by Marriage Status in Erie
95.8% of women with births (287) in Erie are married. The highest percentage of unmarried women with births falls into 20 to 34 years age bracket with 5.7% of them unmarried at the time of birth, while the lowest percentage of unmarried women with births belong to 35 to 50 years age bracket with 0.0% of them unmarried.
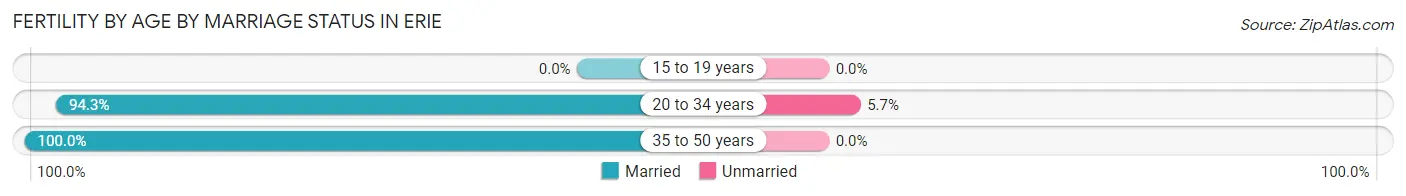
| Age Bracket | Married | Unmarried |
| 15 to 19 years | 0 (0.0%) | 0 (0.0%) |
| 20 to 34 years | 198 (94.3%) | 12 (5.7%) |
| 35 to 50 years | 77 (100.0%) | 0 (0.0%) |
| Total | 275 (95.8%) | 12 (4.2%) |
Fertility by Education in Erie
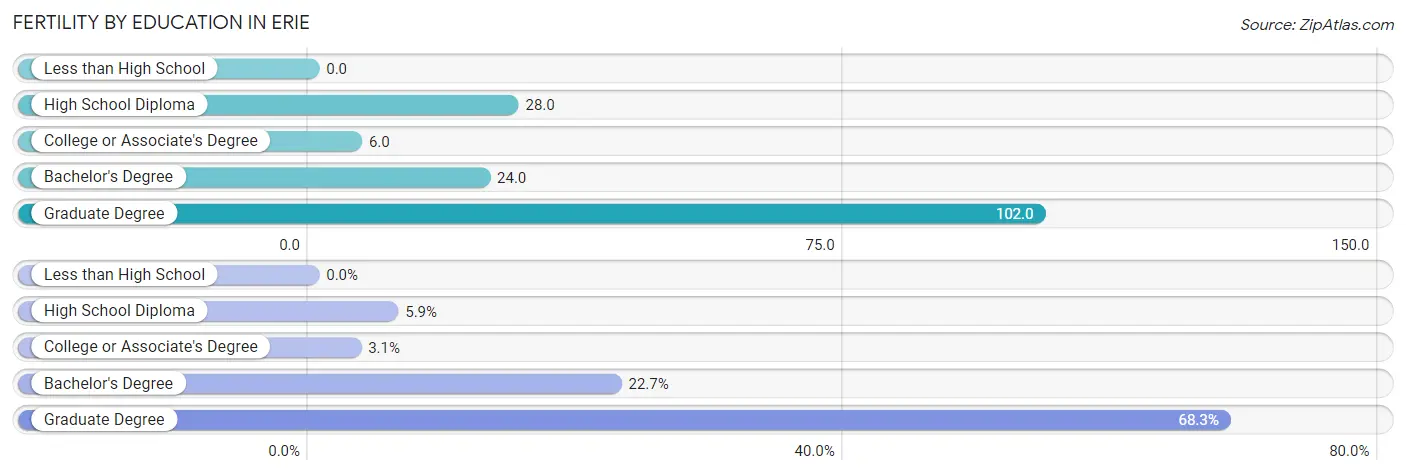
| Educational Attainment | Women with Births | Births / 1,000 Women |
| Less than High School | 0 (0.0%) | 0.0 |
| High School Diploma | 17 (5.9%) | 28.0 |
| College or Associate's Degree | 9 (3.1%) | 6.0 |
| Bachelor's Degree | 65 (22.7%) | 24.0 |
| Graduate Degree | 196 (68.3%) | 102.0 |
| Total | 287 (100.0%) | 38.0 |
Fertility by Education by Marriage Status in Erie
4.2% of women with births in Erie are unmarried. Women with the educational attainment of high school diploma are most likely to be married with 100.0% of them married at childbirth, while women with the educational attainment of graduate degree are least likely to be married with 6.1% of them unmarried at childbirth.
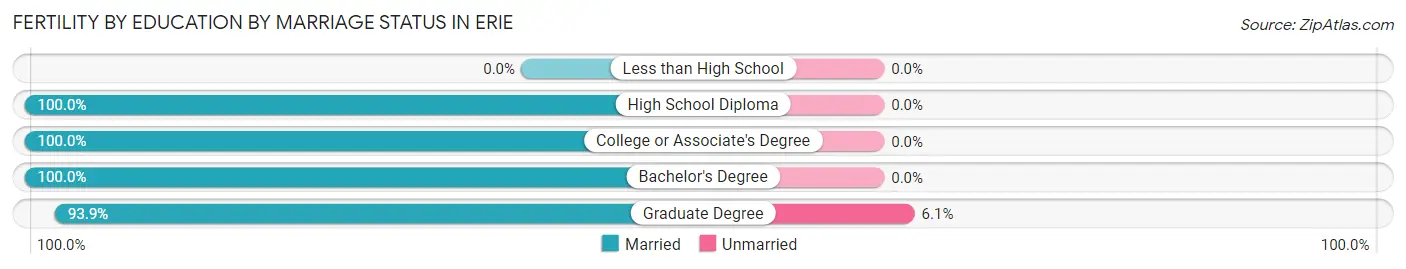
| Educational Attainment | Married | Unmarried |
| Less than High School | 0 (0.0%) | 0 (0.0%) |
| High School Diploma | 17 (100.0%) | 0 (0.0%) |
| College or Associate's Degree | 9 (100.0%) | 0 (0.0%) |
| Bachelor's Degree | 65 (100.0%) | 0 (0.0%) |
| Graduate Degree | 184 (93.9%) | 12 (6.1%) |
| Total | 275 (95.8%) | 12 (4.2%) |
Employment Characteristics in Erie
Employment by Class of Employer in Erie
Among the 15,944 employed individuals in Erie, private company employees (10,910 | 68.4%), local government employees (1,267 | 8.0%), and not-for-profit organizations (946 | 5.9%) make up the most common classes of employment.
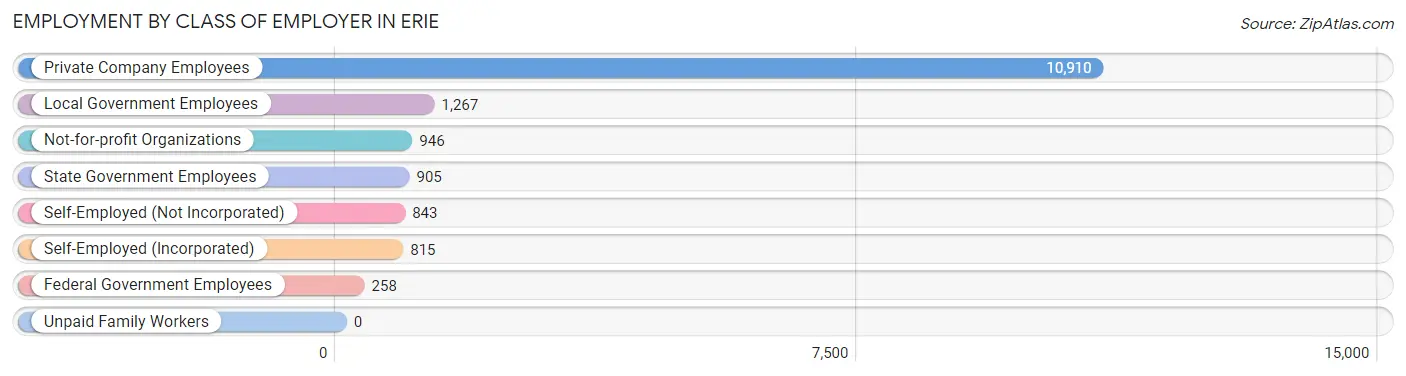
| Employer Class | # Employees | % Employees |
| Private Company Employees | 10,910 | 68.4% |
| Self-Employed (Incorporated) | 815 | 5.1% |
| Self-Employed (Not Incorporated) | 843 | 5.3% |
| Not-for-profit Organizations | 946 | 5.9% |
| Local Government Employees | 1,267 | 8.0% |
| State Government Employees | 905 | 5.7% |
| Federal Government Employees | 258 | 1.6% |
| Unpaid Family Workers | 0 | 0.0% |
| Total | 15,944 | 100.0% |
Employment Status by Age in Erie
According to the labor force statistics for Erie, out of the total population over 16 years of age (22,057), 76.4% or 16,852 individuals are in the labor force, with 4.0% or 674 of them unemployed. The age group with the highest labor force participation rate is 35 to 44 years, with 90.6% or 5,006 individuals in the labor force. Within the labor force, the 20 to 24 years age range has the highest percentage of unemployed individuals, with 14.6% or 136 of them being unemployed.
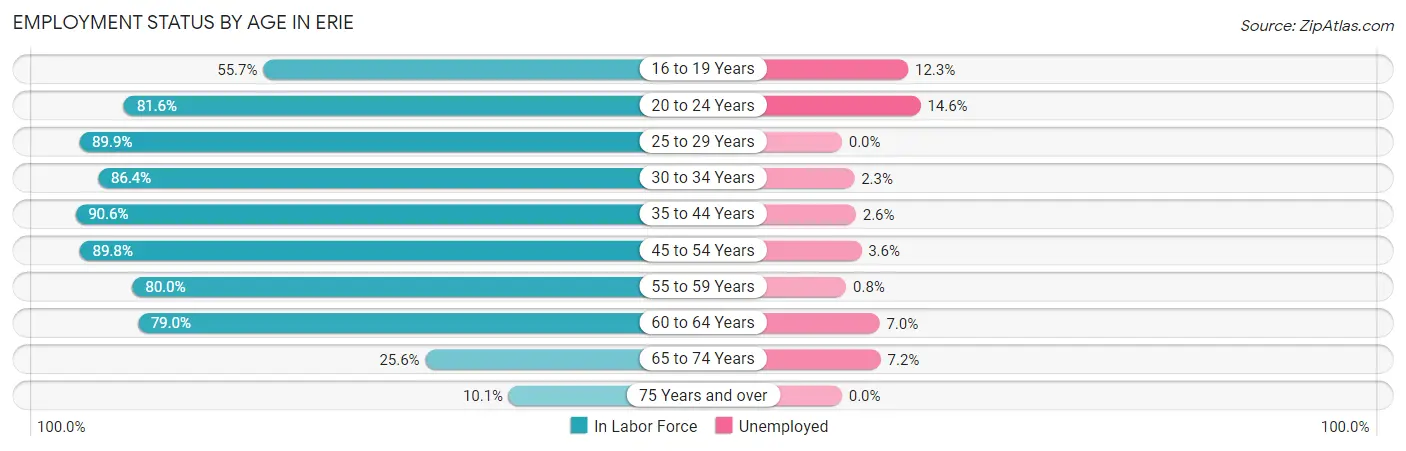
| Age Bracket | In Labor Force | Unemployed |
| 16 to 19 Years | 718 (55.7%) | 88 (12.3%) |
| 20 to 24 Years | 933 (81.6%) | 136 (14.6%) |
| 25 to 29 Years | 1,092 (89.9%) | 0 (0.0%) |
| 30 to 34 Years | 1,583 (86.4%) | 36 (2.3%) |
| 35 to 44 Years | 5,006 (90.6%) | 130 (2.6%) |
| 45 to 54 Years | 4,295 (89.8%) | 155 (3.6%) |
| 55 to 59 Years | 1,458 (80.0%) | 12 (0.8%) |
| 60 to 64 Years | 1,164 (79.0%) | 81 (7.0%) |
| 65 to 74 Years | 496 (25.6%) | 36 (7.2%) |
| 75 Years and over | 105 (10.1%) | 0 (0.0%) |
| Total | 16,852 (76.4%) | 674 (4.0%) |
Employment Status by Educational Attainment in Erie
According to labor force statistics for Erie, 87.7% of individuals (14,603) out of the total population between 25 and 64 years of age (16,651) are in the labor force, with 2.8% or 409 of them being unemployed. The group with the highest labor force participation rate are those with the educational attainment of bachelor's degree or higher, with 89.6% or 10,011 individuals in the labor force. Within the labor force, individuals with college / associate degree education have the highest percentage of unemployment, with 5.1% or 156 of them being unemployed.
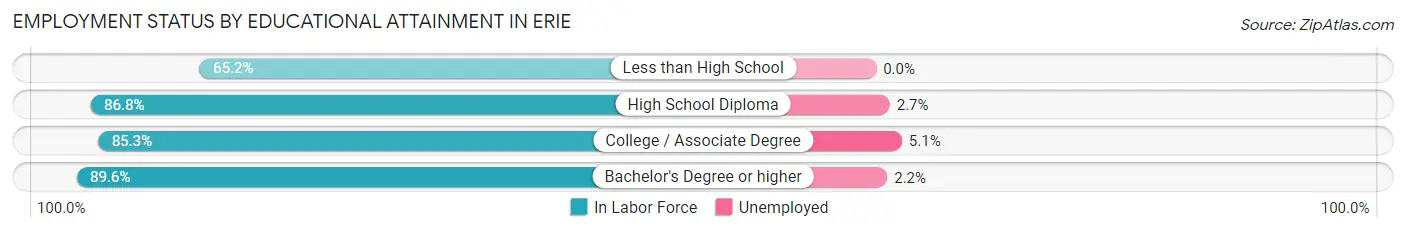
| Educational Attainment | In Labor Force | Unemployed |
| Less than High School | 320 (65.2%) | 0 (0.0%) |
| High School Diploma | 1,213 (86.8%) | 38 (2.7%) |
| College / Associate Degree | 3,062 (85.3%) | 183 (5.1%) |
| Bachelor's Degree or higher | 10,011 (89.6%) | 246 (2.2%) |
| Total | 14,603 (87.7%) | 466 (2.8%) |
Employment Occupations by Sex in Erie
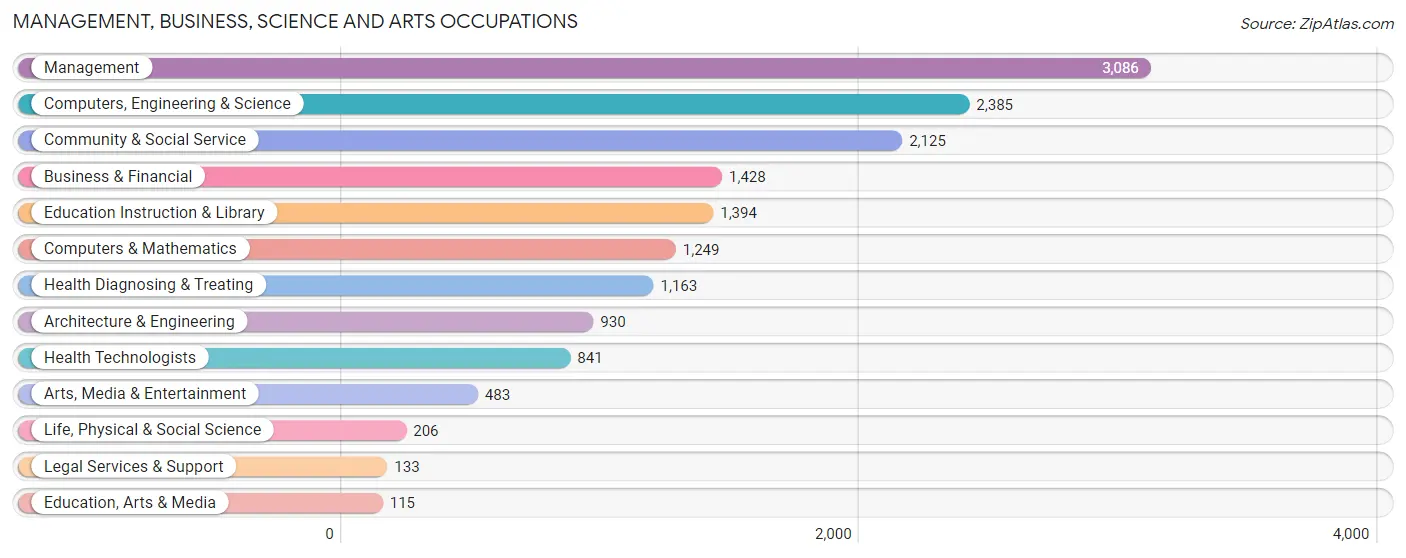
Management, Business, Science and Arts Occupations
The most common Management, Business, Science and Arts occupations in Erie are Management (3,086 | 19.1%), Computers, Engineering & Science (2,385 | 14.7%), Community & Social Service (2,125 | 13.1%), Business & Financial (1,428 | 8.8%), and Education Instruction & Library (1,394 | 8.6%).
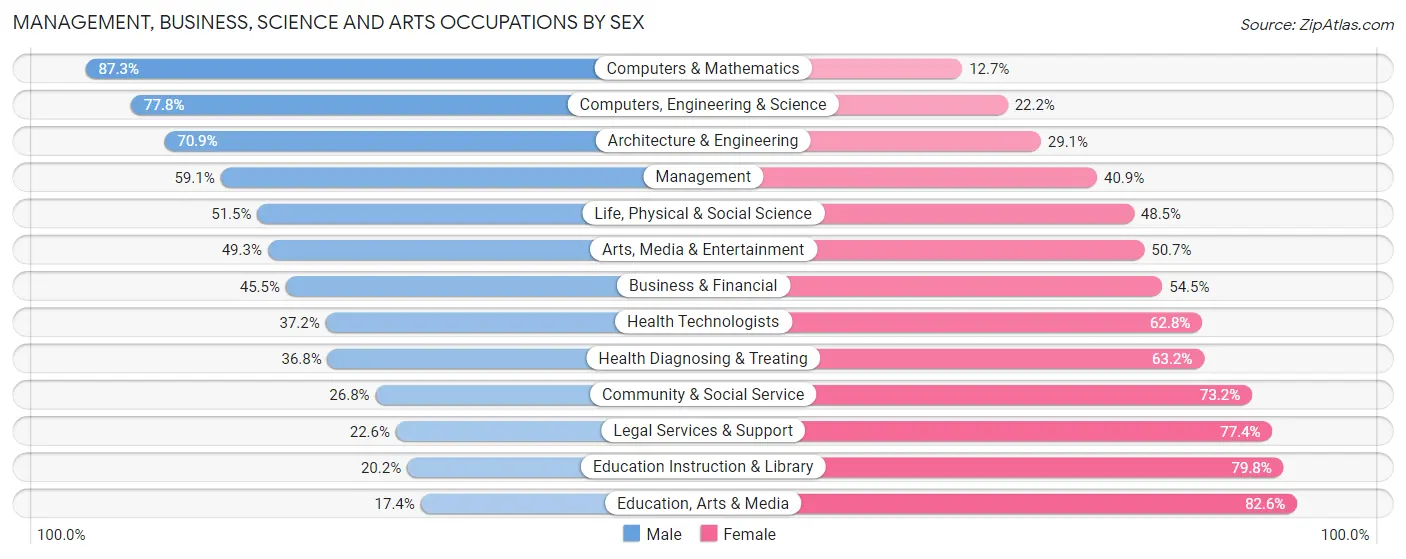
Management, Business, Science and Arts Occupations by Sex
Within the Management, Business, Science and Arts occupations in Erie, the most male-oriented occupations are Computers & Mathematics (87.3%), Computers, Engineering & Science (77.8%), and Architecture & Engineering (70.9%), while the most female-oriented occupations are Education, Arts & Media (82.6%), Education Instruction & Library (79.8%), and Legal Services & Support (77.4%).
| Occupation | Male | Female |
| Management | 1,825 (59.1%) | 1,261 (40.9%) |
| Business & Financial | 650 (45.5%) | 778 (54.5%) |
| Computers, Engineering & Science | 1,855 (77.8%) | 530 (22.2%) |
| Computers & Mathematics | 1,090 (87.3%) | 159 (12.7%) |
| Architecture & Engineering | 659 (70.9%) | 271 (29.1%) |
| Life, Physical & Social Science | 106 (51.5%) | 100 (48.5%) |
| Community & Social Service | 570 (26.8%) | 1,555 (73.2%) |
| Education, Arts & Media | 20 (17.4%) | 95 (82.6%) |
| Legal Services & Support | 30 (22.6%) | 103 (77.4%) |
| Education Instruction & Library | 282 (20.2%) | 1,112 (79.8%) |
| Arts, Media & Entertainment | 238 (49.3%) | 245 (50.7%) |
| Health Diagnosing & Treating | 428 (36.8%) | 735 (63.2%) |
| Health Technologists | 313 (37.2%) | 528 (62.8%) |
| Total (Category) | 5,328 (52.3%) | 4,859 (47.7%) |
| Total (Overall) | 8,656 (53.5%) | 7,524 (46.5%) |
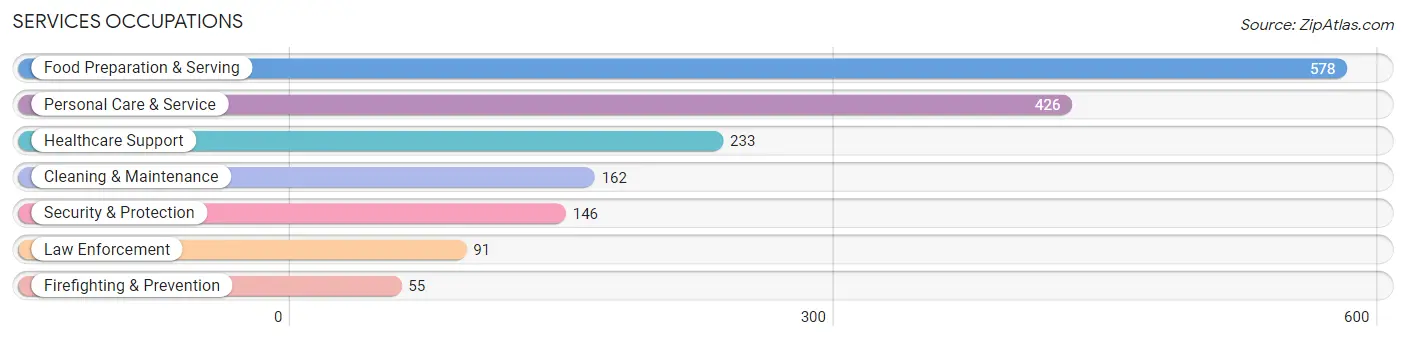
Services Occupations
The most common Services occupations in Erie are Food Preparation & Serving (578 | 3.6%), Personal Care & Service (426 | 2.6%), Healthcare Support (233 | 1.4%), Cleaning & Maintenance (162 | 1.0%), and Security & Protection (146 | 0.9%).
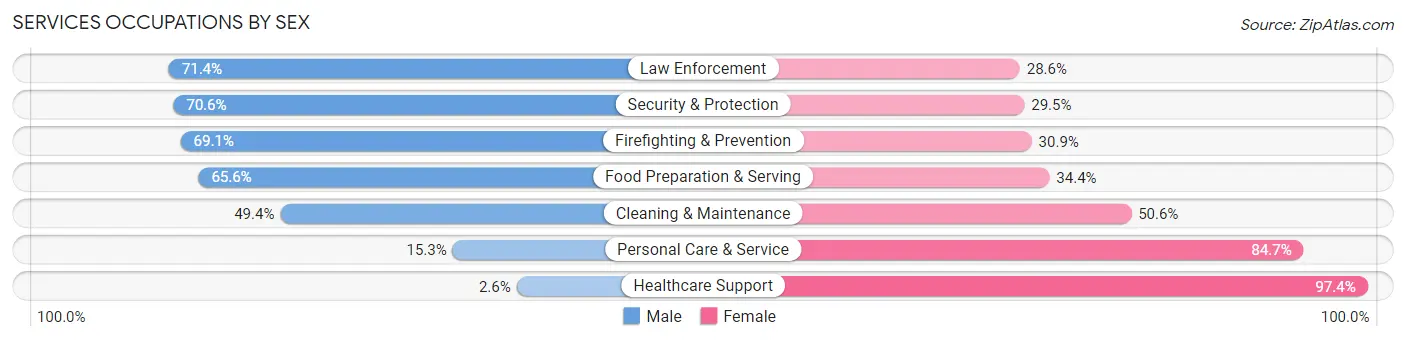
Services Occupations by Sex
Within the Services occupations in Erie, the most male-oriented occupations are Law Enforcement (71.4%), Security & Protection (70.6%), and Firefighting & Prevention (69.1%), while the most female-oriented occupations are Healthcare Support (97.4%), Personal Care & Service (84.7%), and Cleaning & Maintenance (50.6%).
| Occupation | Male | Female |
| Healthcare Support | 6 (2.6%) | 227 (97.4%) |
| Security & Protection | 103 (70.6%) | 43 (29.4%) |
| Firefighting & Prevention | 38 (69.1%) | 17 (30.9%) |
| Law Enforcement | 65 (71.4%) | 26 (28.6%) |
| Food Preparation & Serving | 379 (65.6%) | 199 (34.4%) |
| Cleaning & Maintenance | 80 (49.4%) | 82 (50.6%) |
| Personal Care & Service | 65 (15.3%) | 361 (84.7%) |
| Total (Category) | 633 (41.0%) | 912 (59.0%) |
| Total (Overall) | 8,656 (53.5%) | 7,524 (46.5%) |
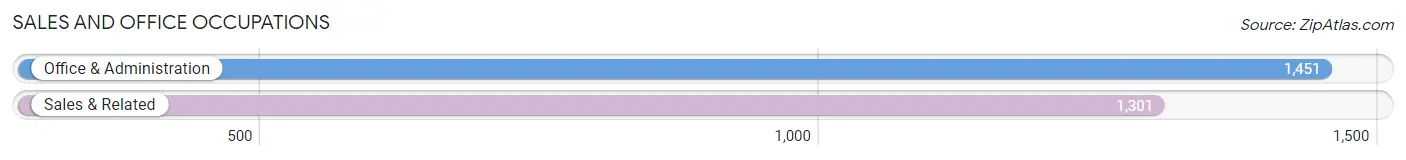
Sales and Office Occupations
The most common Sales and Office occupations in Erie are Office & Administration (1,451 | 9.0%), and Sales & Related (1,301 | 8.0%).
Sales and Office Occupations by Sex
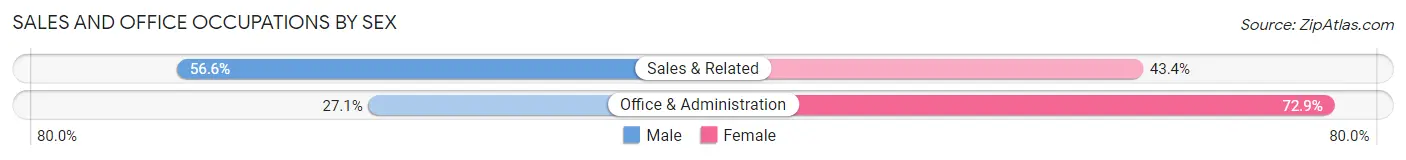
| Occupation | Male | Female |
| Sales & Related | 736 (56.6%) | 565 (43.4%) |
| Office & Administration | 393 (27.1%) | 1,058 (72.9%) |
| Total (Category) | 1,129 (41.0%) | 1,623 (59.0%) |
| Total (Overall) | 8,656 (53.5%) | 7,524 (46.5%) |
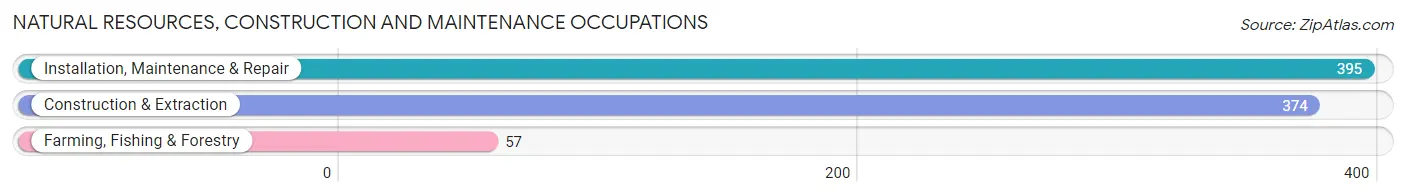
Natural Resources, Construction and Maintenance Occupations
The most common Natural Resources, Construction and Maintenance occupations in Erie are Installation, Maintenance & Repair (395 | 2.4%), Construction & Extraction (374 | 2.3%), and Farming, Fishing & Forestry (57 | 0.4%).
Natural Resources, Construction and Maintenance Occupations by Sex
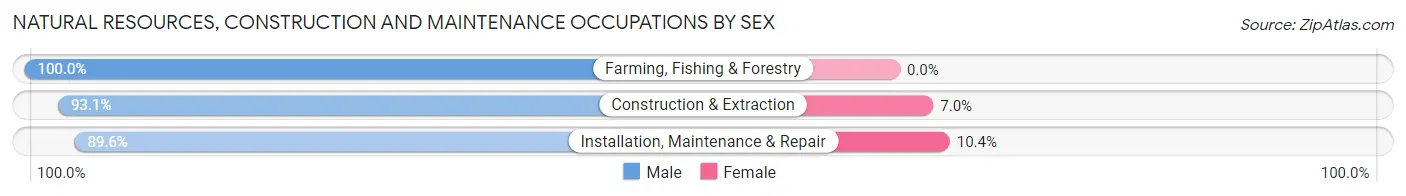
| Occupation | Male | Female |
| Farming, Fishing & Forestry | 57 (100.0%) | 0 (0.0%) |
| Construction & Extraction | 348 (93.0%) | 26 (7.0%) |
| Installation, Maintenance & Repair | 354 (89.6%) | 41 (10.4%) |
| Total (Category) | 759 (91.9%) | 67 (8.1%) |
| Total (Overall) | 8,656 (53.5%) | 7,524 (46.5%) |
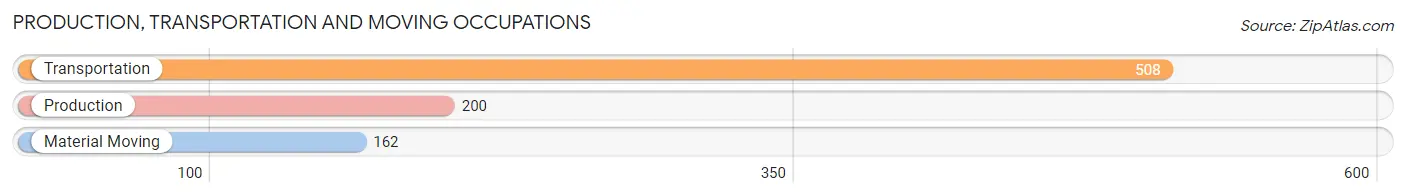
Production, Transportation and Moving Occupations
The most common Production, Transportation and Moving occupations in Erie are Transportation (508 | 3.1%), Production (200 | 1.2%), and Material Moving (162 | 1.0%).
Production, Transportation and Moving Occupations by Sex
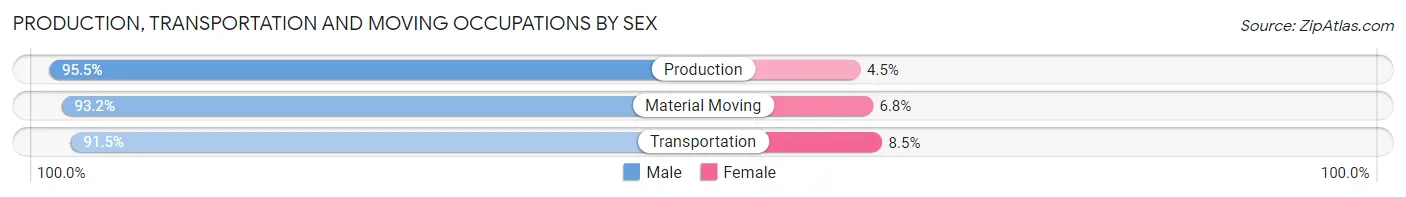
| Occupation | Male | Female |
| Production | 191 (95.5%) | 9 (4.5%) |
| Transportation | 465 (91.5%) | 43 (8.5%) |
| Material Moving | 151 (93.2%) | 11 (6.8%) |
| Total (Category) | 807 (92.8%) | 63 (7.2%) |
| Total (Overall) | 8,656 (53.5%) | 7,524 (46.5%) |
Employment Industries by Sex in Erie
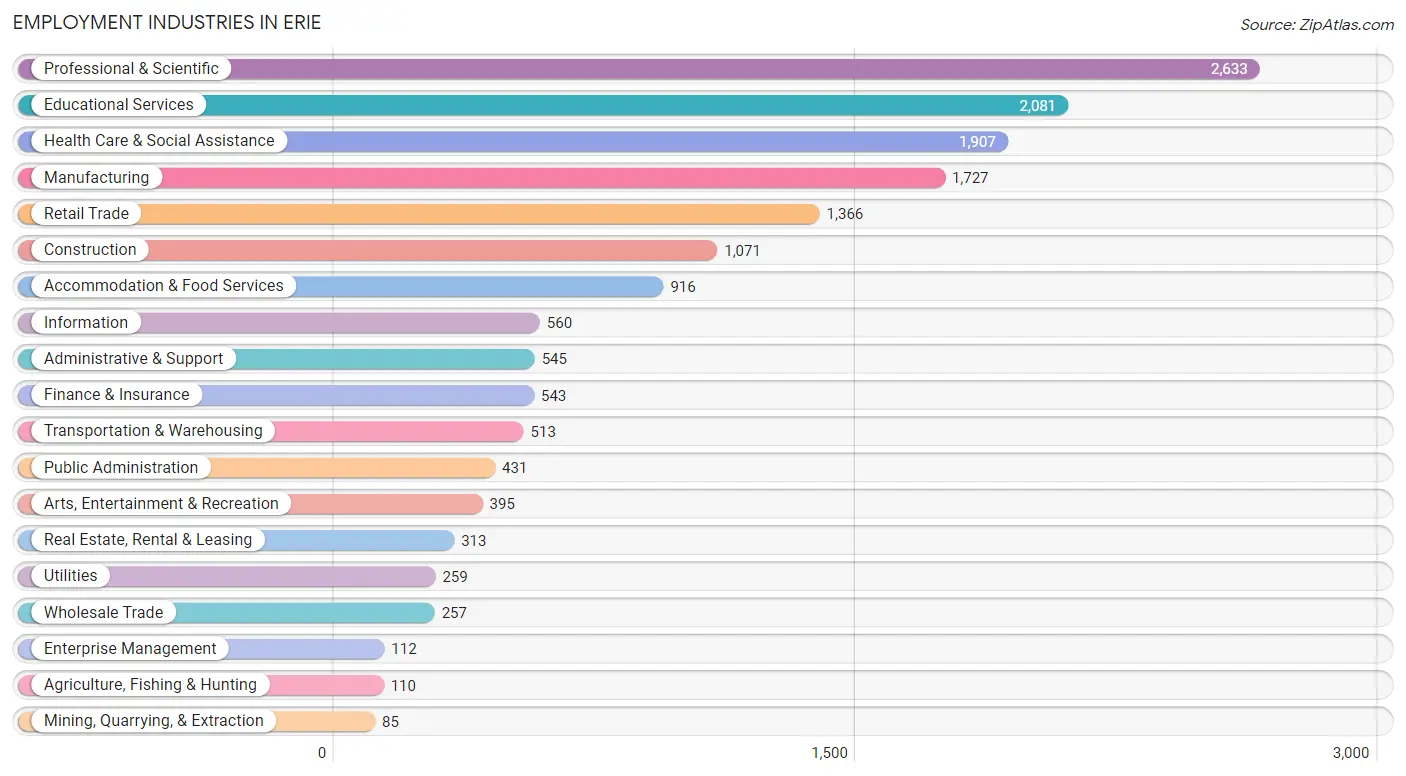
Employment Industries in Erie
The major employment industries in Erie include Professional & Scientific (2,633 | 16.3%), Educational Services (2,081 | 12.9%), Health Care & Social Assistance (1,907 | 11.8%), Manufacturing (1,727 | 10.7%), and Retail Trade (1,366 | 8.4%).
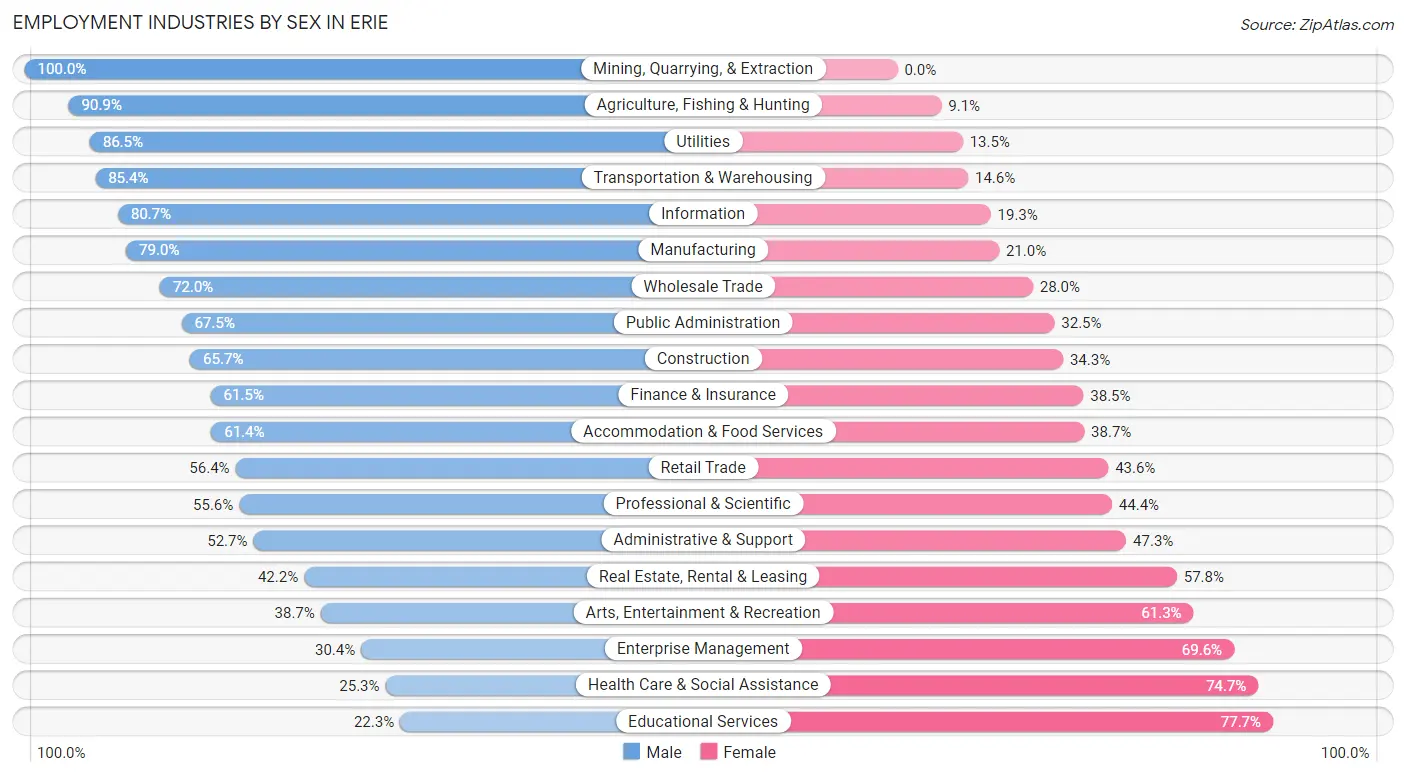
Employment Industries by Sex in Erie
The Erie industries that see more men than women are Mining, Quarrying, & Extraction (100.0%), Agriculture, Fishing & Hunting (90.9%), and Utilities (86.5%), whereas the industries that tend to have a higher number of women are Educational Services (77.7%), Health Care & Social Assistance (74.7%), and Enterprise Management (69.6%).
| Industry | Male | Female |
| Agriculture, Fishing & Hunting | 100 (90.9%) | 10 (9.1%) |
| Mining, Quarrying, & Extraction | 85 (100.0%) | 0 (0.0%) |
| Construction | 704 (65.7%) | 367 (34.3%) |
| Manufacturing | 1,364 (79.0%) | 363 (21.0%) |
| Wholesale Trade | 185 (72.0%) | 72 (28.0%) |
| Retail Trade | 770 (56.4%) | 596 (43.6%) |
| Transportation & Warehousing | 438 (85.4%) | 75 (14.6%) |
| Utilities | 224 (86.5%) | 35 (13.5%) |
| Information | 452 (80.7%) | 108 (19.3%) |
| Finance & Insurance | 334 (61.5%) | 209 (38.5%) |
| Real Estate, Rental & Leasing | 132 (42.2%) | 181 (57.8%) |
| Professional & Scientific | 1,464 (55.6%) | 1,169 (44.4%) |
| Enterprise Management | 34 (30.4%) | 78 (69.6%) |
| Administrative & Support | 287 (52.7%) | 258 (47.3%) |
| Educational Services | 464 (22.3%) | 1,617 (77.7%) |
| Health Care & Social Assistance | 483 (25.3%) | 1,424 (74.7%) |
| Arts, Entertainment & Recreation | 153 (38.7%) | 242 (61.3%) |
| Accommodation & Food Services | 562 (61.4%) | 354 (38.7%) |
| Public Administration | 291 (67.5%) | 140 (32.5%) |
| Total | 8,656 (53.5%) | 7,524 (46.5%) |
Education in Erie
School Enrollment in Erie
The most common levels of schooling among the 9,241 students in Erie are middle school (2,554 | 27.6%), elementary school (1,968 | 21.3%), and high school (1,732 | 18.7%).
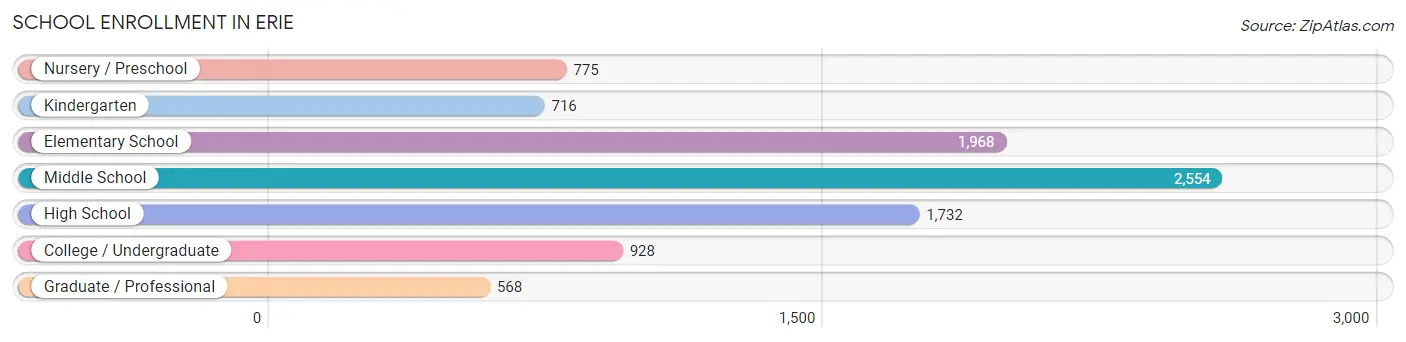
| School Level | # Students | % Students |
| Nursery / Preschool | 775 | 8.4% |
| Kindergarten | 716 | 7.7% |
| Elementary School | 1,968 | 21.3% |
| Middle School | 2,554 | 27.6% |
| High School | 1,732 | 18.7% |
| College / Undergraduate | 928 | 10.0% |
| Graduate / Professional | 568 | 6.1% |
| Total | 9,241 | 100.0% |
School Enrollment by Age by Funding Source in Erie
Out of a total of 9,241 students who are enrolled in schools in Erie, 1,211 (13.1%) attend a private institution, while the remaining 8,030 (86.9%) are enrolled in public schools. The age group of 3 to 4 year olds has the highest likelihood of being enrolled in private schools, with 267 (41.7% in the age bracket) enrolled. Conversely, the age group of 15 to 17 year olds has the lowest likelihood of being enrolled in a private school, with 1,277 (94.5% in the age bracket) attending a public institution.
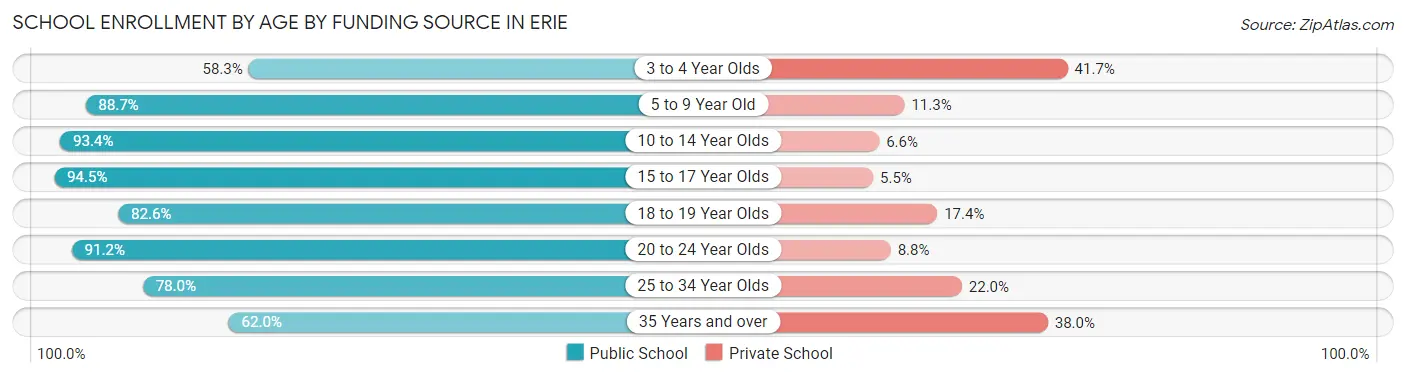
| Age Bracket | Public School | Private School |
| 3 to 4 Year Olds | 373 (58.3%) | 267 (41.7%) |
| 5 to 9 Year Old | 2,168 (88.7%) | 277 (11.3%) |
| 10 to 14 Year Olds | 2,890 (93.4%) | 205 (6.6%) |
| 15 to 17 Year Olds | 1,277 (94.5%) | 74 (5.5%) |
| 18 to 19 Year Olds | 289 (82.6%) | 61 (17.4%) |
| 20 to 24 Year Olds | 479 (91.2%) | 46 (8.8%) |
| 25 to 34 Year Olds | 202 (78.0%) | 57 (22.0%) |
| 35 Years and over | 357 (62.0%) | 219 (38.0%) |
| Total | 8,030 (86.9%) | 1,211 (13.1%) |
Educational Attainment by Field of Study in Erie
Business (2,421 | 17.4%), engineering (1,722 | 12.4%), science & technology (1,236 | 8.9%), bio, nature & agricultural (1,187 | 8.5%), and education (1,014 | 7.3%) are the most common fields of study among 13,927 individuals in Erie who have obtained a bachelor's degree or higher.
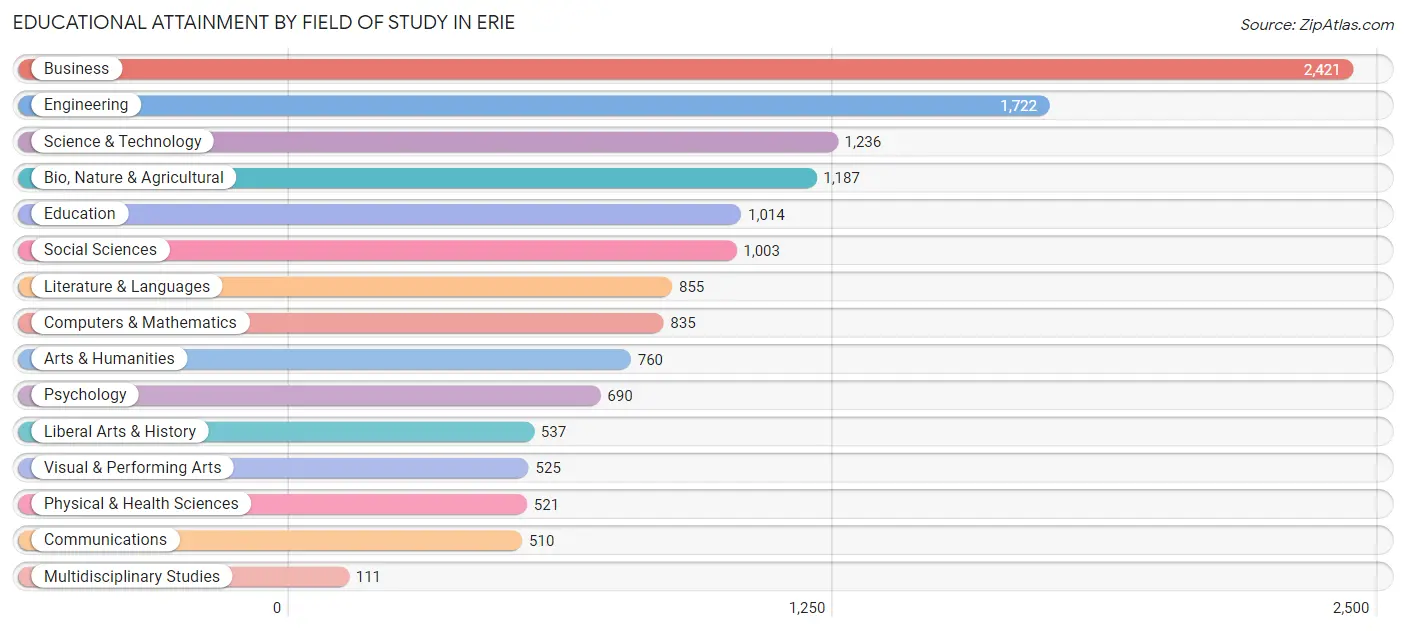
| Field of Study | # Graduates | % Graduates |
| Computers & Mathematics | 835 | 6.0% |
| Bio, Nature & Agricultural | 1,187 | 8.5% |
| Physical & Health Sciences | 521 | 3.7% |
| Psychology | 690 | 5.0% |
| Social Sciences | 1,003 | 7.2% |
| Engineering | 1,722 | 12.4% |
| Multidisciplinary Studies | 111 | 0.8% |
| Science & Technology | 1,236 | 8.9% |
| Business | 2,421 | 17.4% |
| Education | 1,014 | 7.3% |
| Literature & Languages | 855 | 6.1% |
| Liberal Arts & History | 537 | 3.9% |
| Visual & Performing Arts | 525 | 3.8% |
| Communications | 510 | 3.7% |
| Arts & Humanities | 760 | 5.5% |
| Total | 13,927 | 100.0% |
Transportation & Commute in Erie
Vehicle Availability by Sex in Erie
The most prevalent vehicle ownership categories in Erie are males with 2 vehicles (4,418, accounting for 51.6%) and females with 2 vehicles (3,756, making up 59.8%).
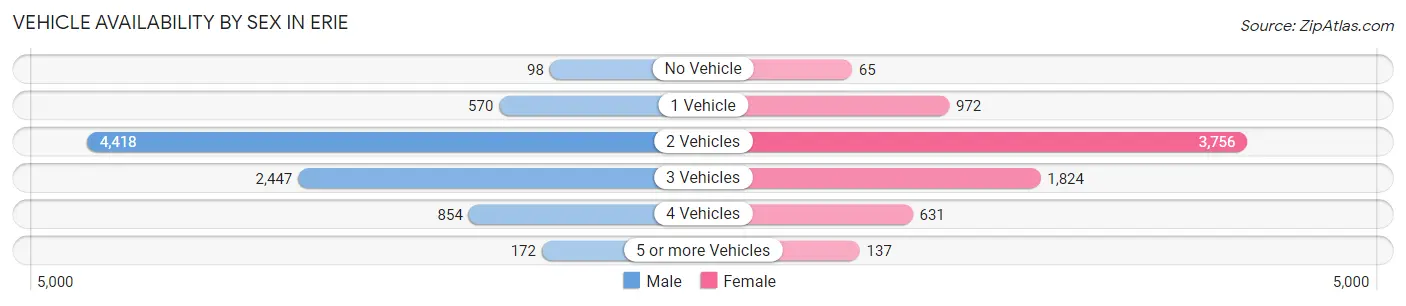
| Vehicles Available | Male | Female |
| No Vehicle | 98 (1.1%) | 65 (0.9%) |
| 1 Vehicle | 570 (6.7%) | 972 (13.2%) |
| 2 Vehicles | 4,418 (51.6%) | 3,756 (50.9%) |
| 3 Vehicles | 2,447 (28.6%) | 1,824 (24.7%) |
| 4 Vehicles | 854 (10.0%) | 631 (8.5%) |
| 5 or more Vehicles | 172 (2.0%) | 137 (1.9%) |
| Total | 8,559 (100.0%) | 7,385 (100.0%) |
Commute Time in Erie
The most frequently occuring commute durations in Erie are 30 to 34 minutes (2,206 commuters, 18.9%), 20 to 24 minutes (1,971 commuters, 16.9%), and 15 to 19 minutes (1,859 commuters, 15.9%).
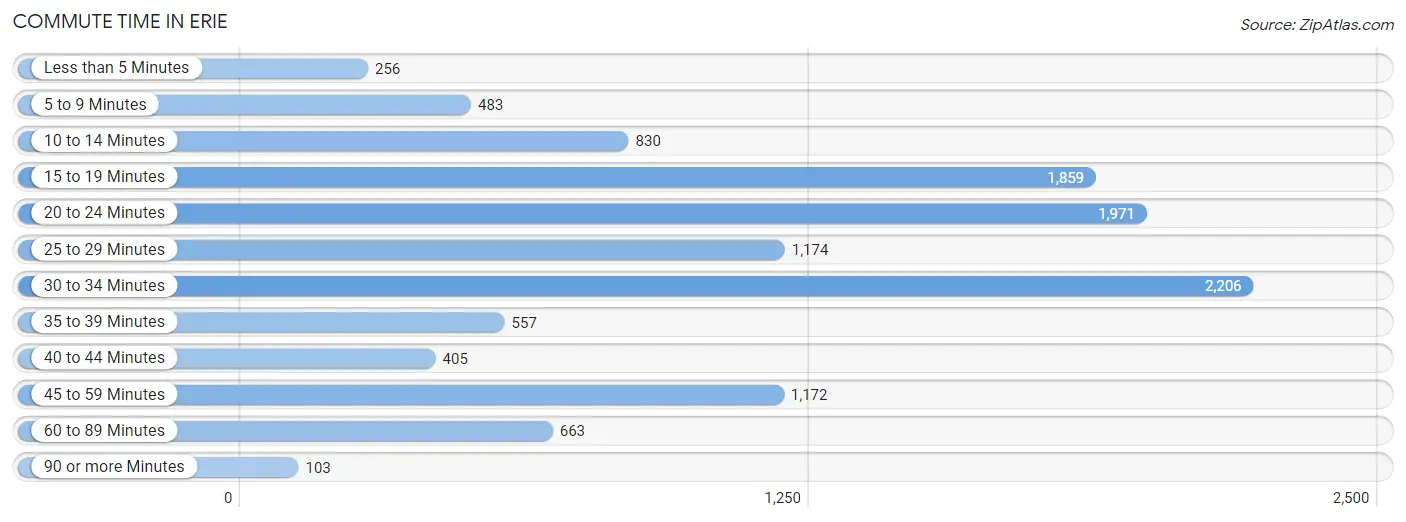
| Commute Time | # Commuters | % Commuters |
| Less than 5 Minutes | 256 | 2.2% |
| 5 to 9 Minutes | 483 | 4.1% |
| 10 to 14 Minutes | 830 | 7.1% |
| 15 to 19 Minutes | 1,859 | 15.9% |
| 20 to 24 Minutes | 1,971 | 16.9% |
| 25 to 29 Minutes | 1,174 | 10.1% |
| 30 to 34 Minutes | 2,206 | 18.9% |
| 35 to 39 Minutes | 557 | 4.8% |
| 40 to 44 Minutes | 405 | 3.5% |
| 45 to 59 Minutes | 1,172 | 10.0% |
| 60 to 89 Minutes | 663 | 5.7% |
| 90 or more Minutes | 103 | 0.9% |
Commute Time by Sex in Erie
The most common commute times in Erie are 30 to 34 minutes (1,233 commuters, 19.1%) for males and 15 to 19 minutes (1,035 commuters, 19.9%) for females.
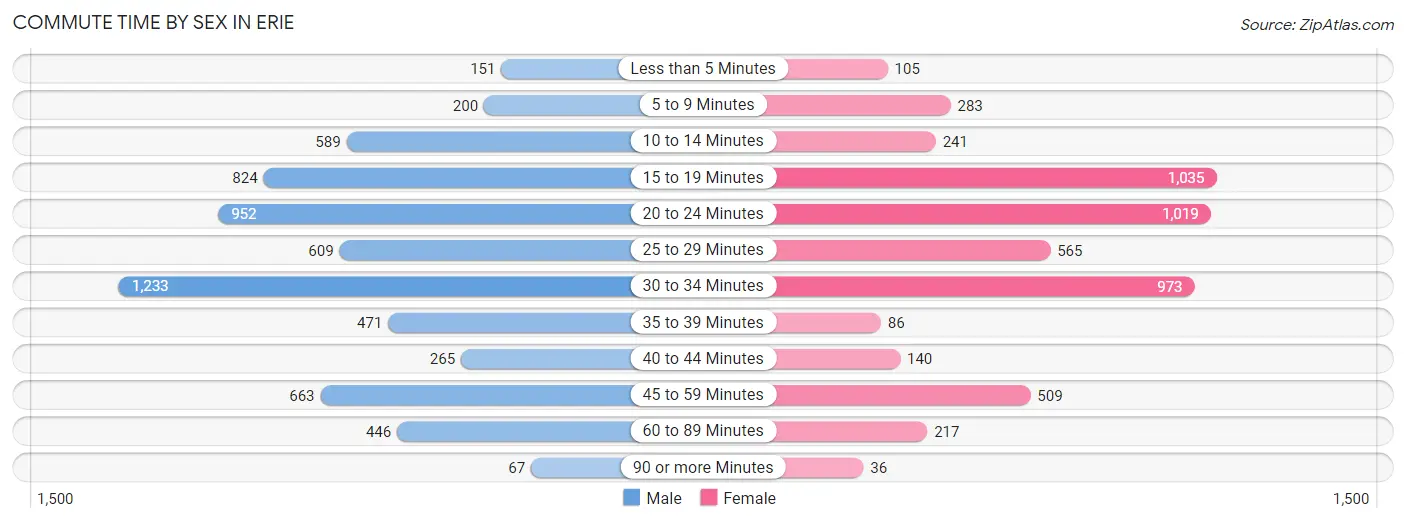
| Commute Time | Male | Female |
| Less than 5 Minutes | 151 (2.3%) | 105 (2.0%) |
| 5 to 9 Minutes | 200 (3.1%) | 283 (5.4%) |
| 10 to 14 Minutes | 589 (9.1%) | 241 (4.6%) |
| 15 to 19 Minutes | 824 (12.7%) | 1,035 (19.9%) |
| 20 to 24 Minutes | 952 (14.7%) | 1,019 (19.6%) |
| 25 to 29 Minutes | 609 (9.4%) | 565 (10.8%) |
| 30 to 34 Minutes | 1,233 (19.1%) | 973 (18.7%) |
| 35 to 39 Minutes | 471 (7.3%) | 86 (1.7%) |
| 40 to 44 Minutes | 265 (4.1%) | 140 (2.7%) |
| 45 to 59 Minutes | 663 (10.2%) | 509 (9.8%) |
| 60 to 89 Minutes | 446 (6.9%) | 217 (4.2%) |
| 90 or more Minutes | 67 (1.0%) | 36 (0.7%) |
Time of Departure to Work by Sex in Erie
The most frequent times of departure to work in Erie are 7:30 AM to 7:59 AM (1,064, 16.5%) for males and 7:30 AM to 7:59 AM (931, 17.9%) for females.
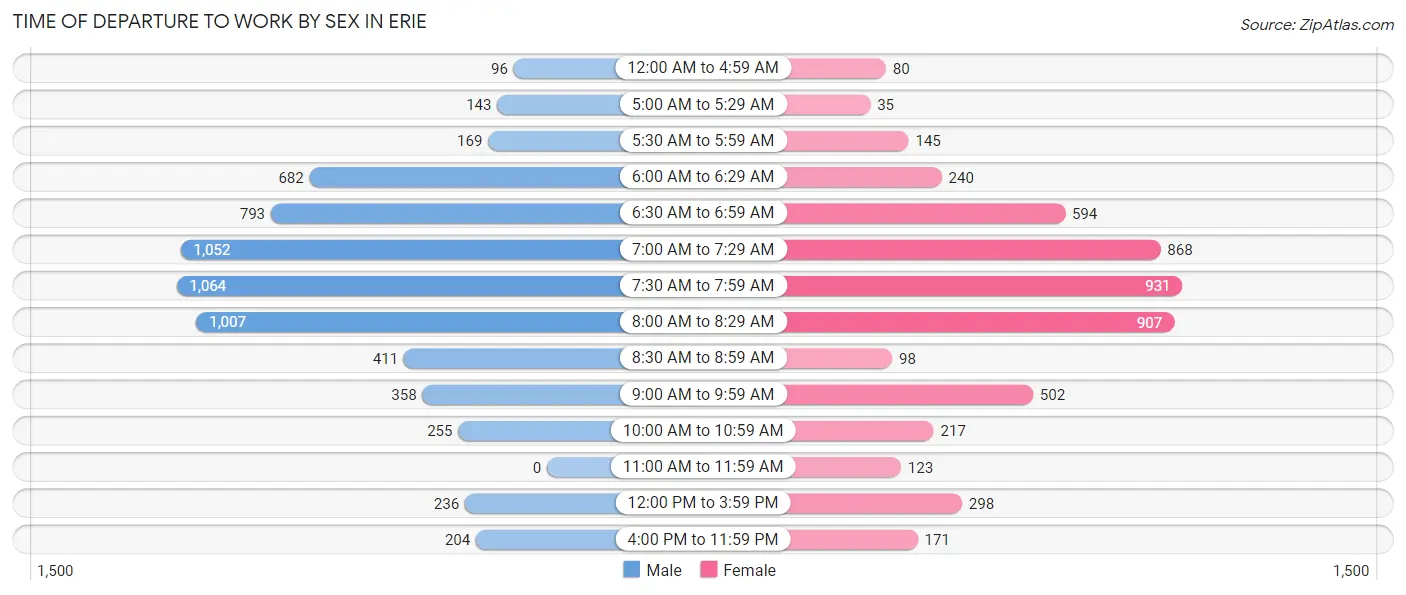
| Time of Departure | Male | Female |
| 12:00 AM to 4:59 AM | 96 (1.5%) | 80 (1.5%) |
| 5:00 AM to 5:29 AM | 143 (2.2%) | 35 (0.7%) |
| 5:30 AM to 5:59 AM | 169 (2.6%) | 145 (2.8%) |
| 6:00 AM to 6:29 AM | 682 (10.5%) | 240 (4.6%) |
| 6:30 AM to 6:59 AM | 793 (12.3%) | 594 (11.4%) |
| 7:00 AM to 7:29 AM | 1,052 (16.3%) | 868 (16.7%) |
| 7:30 AM to 7:59 AM | 1,064 (16.5%) | 931 (17.9%) |
| 8:00 AM to 8:29 AM | 1,007 (15.6%) | 907 (17.4%) |
| 8:30 AM to 8:59 AM | 411 (6.4%) | 98 (1.9%) |
| 9:00 AM to 9:59 AM | 358 (5.5%) | 502 (9.6%) |
| 10:00 AM to 10:59 AM | 255 (3.9%) | 217 (4.2%) |
| 11:00 AM to 11:59 AM | 0 (0.0%) | 123 (2.4%) |
| 12:00 PM to 3:59 PM | 236 (3.6%) | 298 (5.7%) |
| 4:00 PM to 11:59 PM | 204 (3.2%) | 171 (3.3%) |
| Total | 6,470 (100.0%) | 5,209 (100.0%) |
Housing Occupancy in Erie
Occupancy by Ownership in Erie
Of the total 10,585 dwellings in Erie, owner-occupied units account for 9,154 (86.5%), while renter-occupied units make up 1,431 (13.5%).
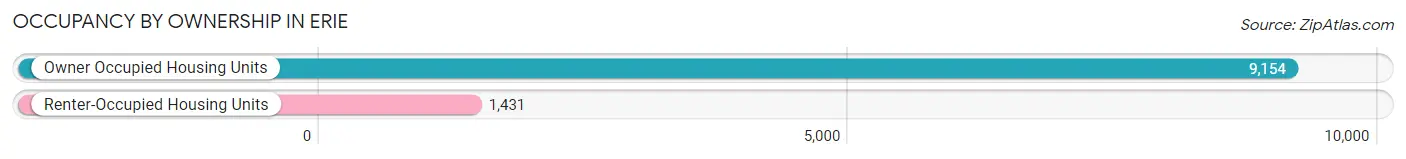
| Occupancy | # Housing Units | % Housing Units |
| Owner Occupied Housing Units | 9,154 | 86.5% |
| Renter-Occupied Housing Units | 1,431 | 13.5% |
| Total Occupied Housing Units | 10,585 | 100.0% |
Occupancy by Household Size in Erie
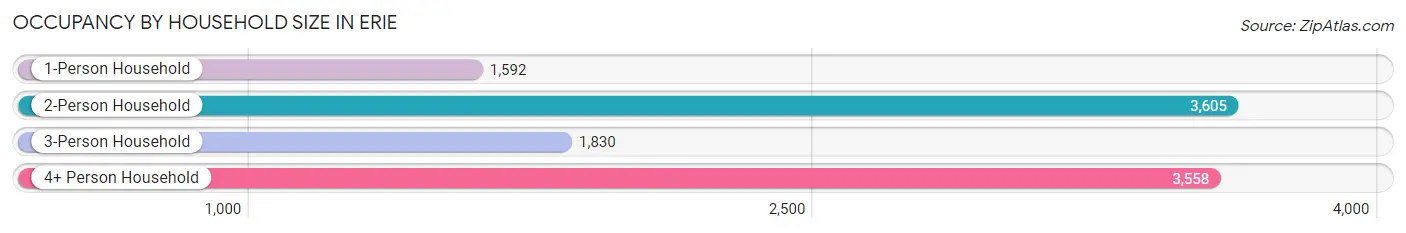
| Household Size | # Housing Units | % Housing Units |
| 1-Person Household | 1,592 | 15.0% |
| 2-Person Household | 3,605 | 34.1% |
| 3-Person Household | 1,830 | 17.3% |
| 4+ Person Household | 3,558 | 33.6% |
| Total Housing Units | 10,585 | 100.0% |
Occupancy by Ownership by Household Size in Erie
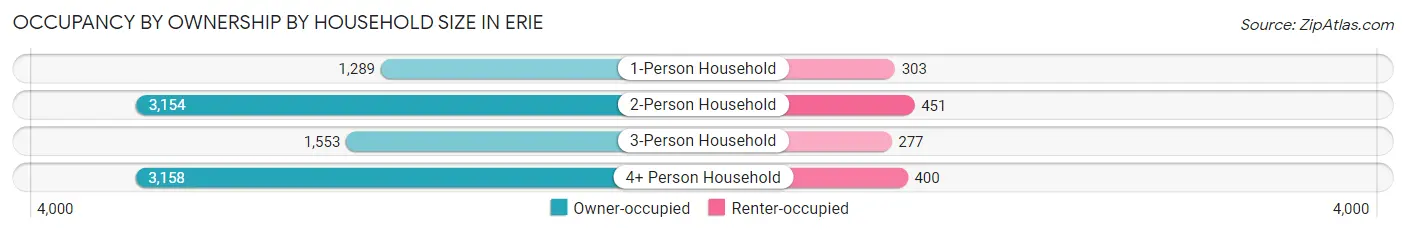
| Household Size | Owner-occupied | Renter-occupied |
| 1-Person Household | 1,289 (81.0%) | 303 (19.0%) |
| 2-Person Household | 3,154 (87.5%) | 451 (12.5%) |
| 3-Person Household | 1,553 (84.9%) | 277 (15.1%) |
| 4+ Person Household | 3,158 (88.8%) | 400 (11.2%) |
| Total Housing Units | 9,154 (86.5%) | 1,431 (13.5%) |
Occupancy by Educational Attainment in Erie
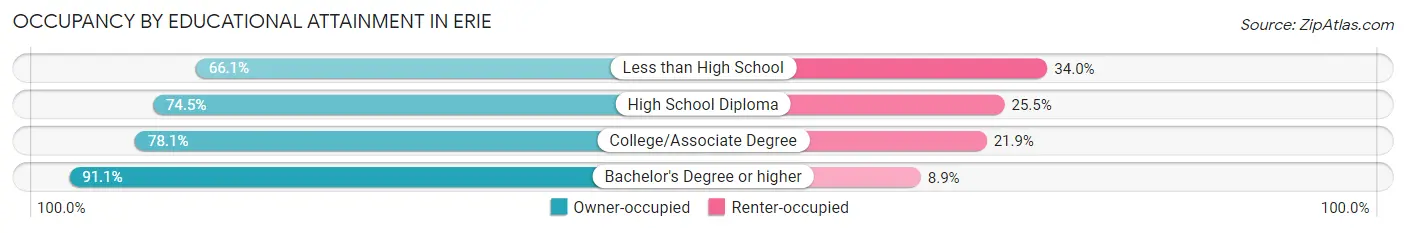
| Household Size | Owner-occupied | Renter-occupied |
| Less than High School | 107 (66.0%) | 55 (34.0%) |
| High School Diploma | 650 (74.5%) | 222 (25.5%) |
| College/Associate Degree | 1,843 (78.1%) | 517 (21.9%) |
| Bachelor's Degree or higher | 6,554 (91.1%) | 637 (8.9%) |
Occupancy by Age of Householder in Erie
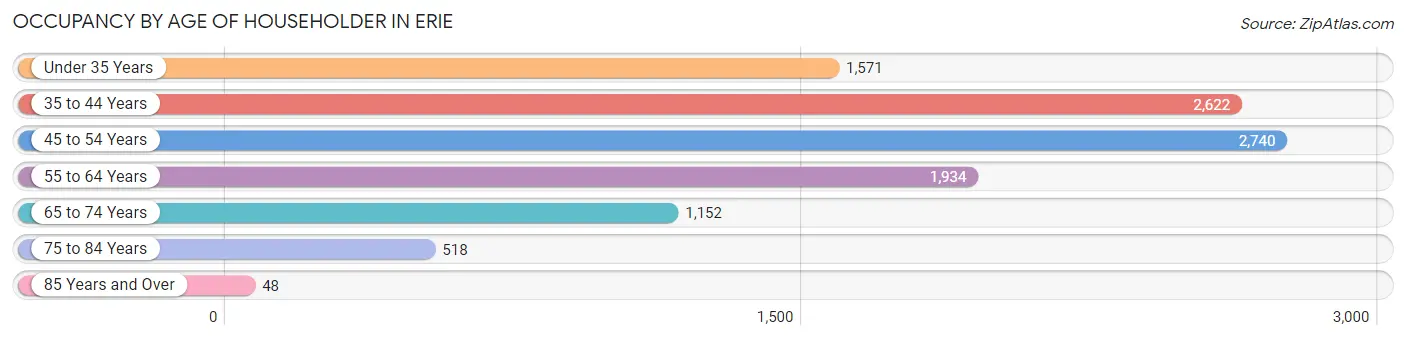
| Age Bracket | # Households | % Households |
| Under 35 Years | 1,571 | 14.8% |
| 35 to 44 Years | 2,622 | 24.8% |
| 45 to 54 Years | 2,740 | 25.9% |
| 55 to 64 Years | 1,934 | 18.3% |
| 65 to 74 Years | 1,152 | 10.9% |
| 75 to 84 Years | 518 | 4.9% |
| 85 Years and Over | 48 | 0.4% |
| Total | 10,585 | 100.0% |
Housing Finances in Erie
Median Income by Occupancy in Erie
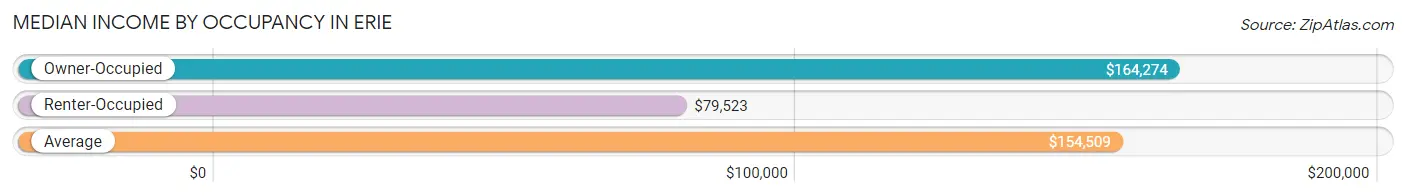
| Occupancy Type | # Households | Median Income |
| Owner-Occupied | 9,154 (86.5%) | $164,274 |
| Renter-Occupied | 1,431 (13.5%) | $79,523 |
| Average | 10,585 (100.0%) | $154,509 |
Occupancy by Householder Income Bracket in Erie
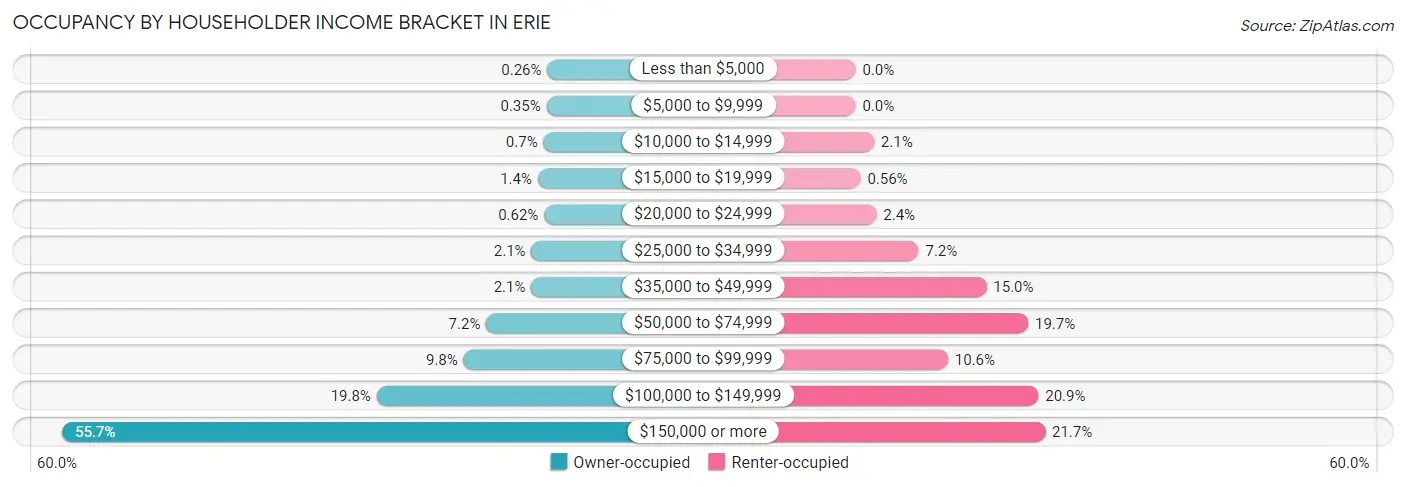
| Income Bracket | Owner-occupied | Renter-occupied |
| Less than $5,000 | 24 (0.3%) | 0 (0.0%) |
| $5,000 to $9,999 | 32 (0.4%) | 0 (0.0%) |
| $10,000 to $14,999 | 64 (0.7%) | 30 (2.1%) |
| $15,000 to $19,999 | 124 (1.3%) | 8 (0.6%) |
| $20,000 to $24,999 | 57 (0.6%) | 34 (2.4%) |
| $25,000 to $34,999 | 190 (2.1%) | 103 (7.2%) |
| $35,000 to $49,999 | 191 (2.1%) | 214 (14.9%) |
| $50,000 to $74,999 | 663 (7.2%) | 282 (19.7%) |
| $75,000 to $99,999 | 900 (9.8%) | 151 (10.5%) |
| $100,000 to $149,999 | 1,809 (19.8%) | 299 (20.9%) |
| $150,000 or more | 5,100 (55.7%) | 310 (21.7%) |
| Total | 9,154 (100.0%) | 1,431 (100.0%) |
Monthly Housing Cost Tiers in Erie
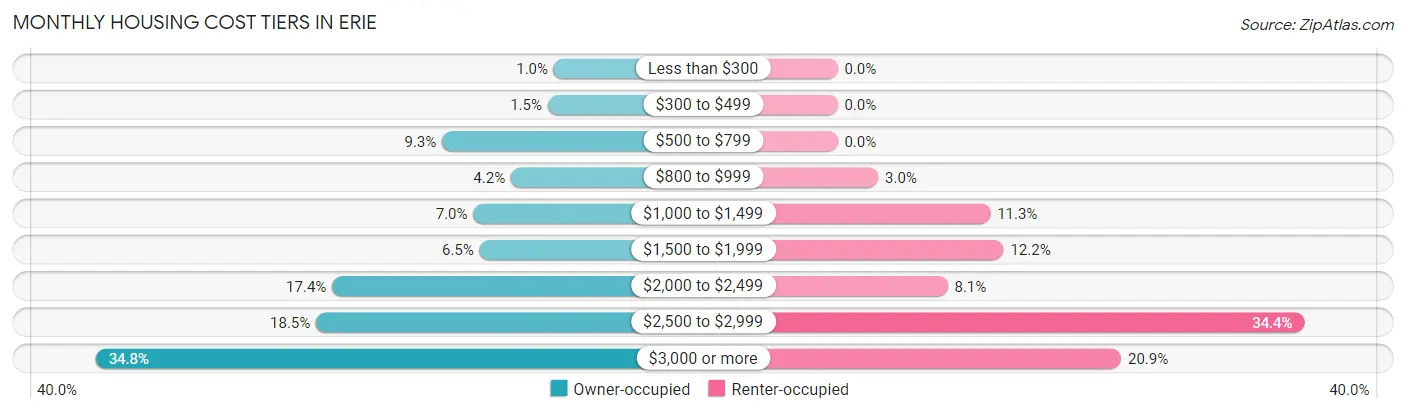
| Monthly Cost | Owner-occupied | Renter-occupied |
| Less than $300 | 93 (1.0%) | 0 (0.0%) |
| $300 to $499 | 135 (1.5%) | 0 (0.0%) |
| $500 to $799 | 847 (9.2%) | 0 (0.0%) |
| $800 to $999 | 383 (4.2%) | 43 (3.0%) |
| $1,000 to $1,499 | 636 (7.0%) | 161 (11.3%) |
| $1,500 to $1,999 | 594 (6.5%) | 175 (12.2%) |
| $2,000 to $2,499 | 1,588 (17.3%) | 116 (8.1%) |
| $2,500 to $2,999 | 1,696 (18.5%) | 492 (34.4%) |
| $3,000 or more | 3,182 (34.8%) | 299 (20.9%) |
| Total | 9,154 (100.0%) | 1,431 (100.0%) |
Physical Housing Characteristics in Erie
Housing Structures in Erie
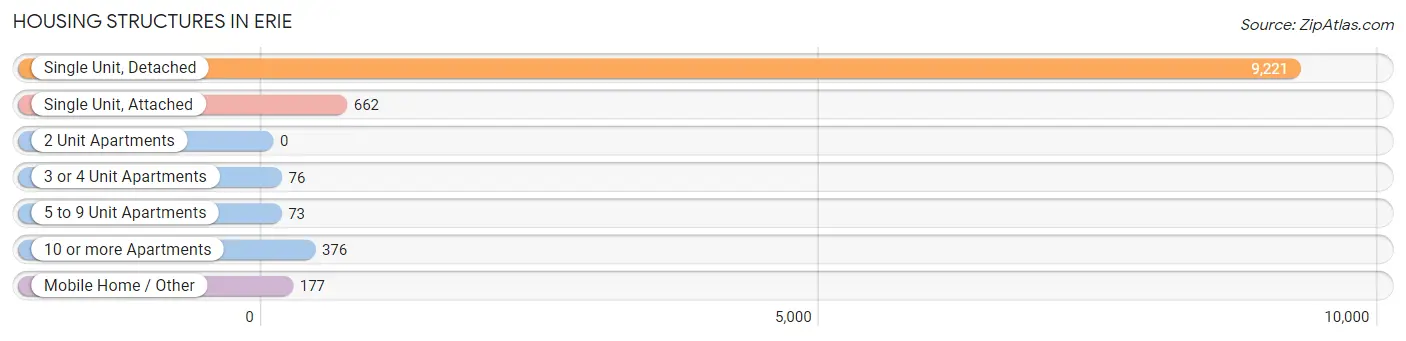
| Structure Type | # Housing Units | % Housing Units |
| Single Unit, Detached | 9,221 | 87.1% |
| Single Unit, Attached | 662 | 6.2% |
| 2 Unit Apartments | 0 | 0.0% |
| 3 or 4 Unit Apartments | 76 | 0.7% |
| 5 to 9 Unit Apartments | 73 | 0.7% |
| 10 or more Apartments | 376 | 3.5% |
| Mobile Home / Other | 177 | 1.7% |
| Total | 10,585 | 100.0% |
Housing Structures by Occupancy in Erie
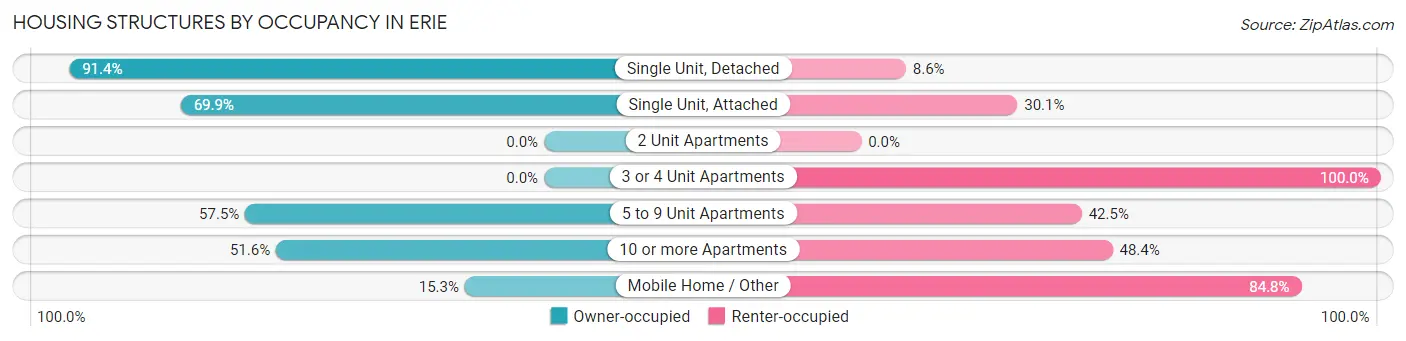
| Structure Type | Owner-occupied | Renter-occupied |
| Single Unit, Detached | 8,428 (91.4%) | 793 (8.6%) |
| Single Unit, Attached | 463 (69.9%) | 199 (30.1%) |
| 2 Unit Apartments | 0 (0.0%) | 0 (0.0%) |
| 3 or 4 Unit Apartments | 0 (0.0%) | 76 (100.0%) |
| 5 to 9 Unit Apartments | 42 (57.5%) | 31 (42.5%) |
| 10 or more Apartments | 194 (51.6%) | 182 (48.4%) |
| Mobile Home / Other | 27 (15.2%) | 150 (84.8%) |
| Total | 9,154 (86.5%) | 1,431 (13.5%) |
Housing Structures by Number of Rooms in Erie
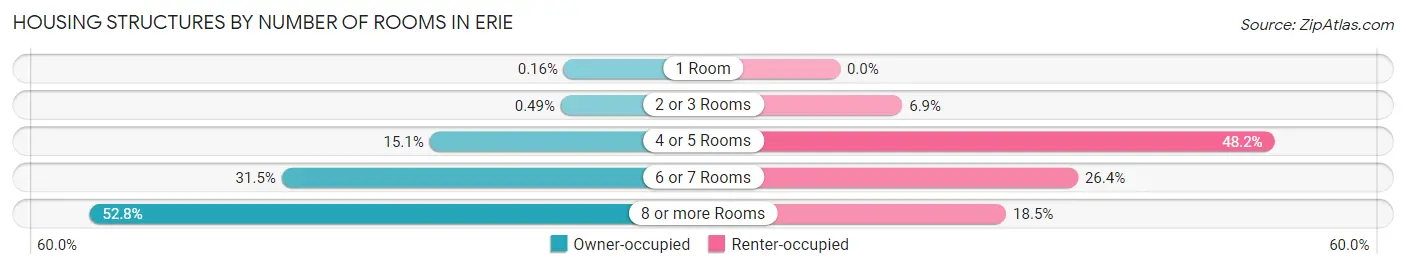
| Number of Rooms | Owner-occupied | Renter-occupied |
| 1 Room | 15 (0.2%) | 0 (0.0%) |
| 2 or 3 Rooms | 45 (0.5%) | 99 (6.9%) |
| 4 or 5 Rooms | 1,379 (15.1%) | 690 (48.2%) |
| 6 or 7 Rooms | 2,881 (31.5%) | 378 (26.4%) |
| 8 or more Rooms | 4,834 (52.8%) | 264 (18.4%) |
| Total | 9,154 (100.0%) | 1,431 (100.0%) |
Housing Structure by Heating Type in Erie
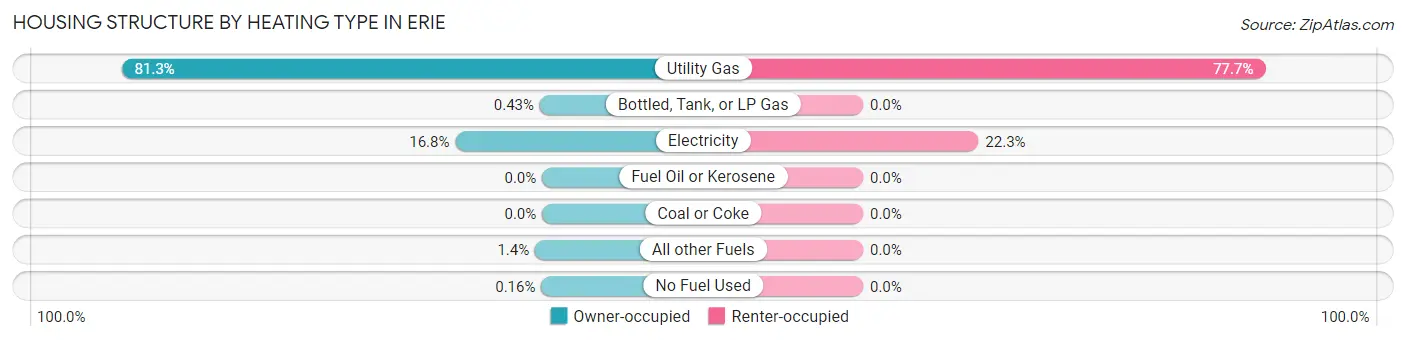
| Heating Type | Owner-occupied | Renter-occupied |
| Utility Gas | 7,440 (81.3%) | 1,112 (77.7%) |
| Bottled, Tank, or LP Gas | 39 (0.4%) | 0 (0.0%) |
| Electricity | 1,535 (16.8%) | 319 (22.3%) |
| Fuel Oil or Kerosene | 0 (0.0%) | 0 (0.0%) |
| Coal or Coke | 0 (0.0%) | 0 (0.0%) |
| All other Fuels | 125 (1.4%) | 0 (0.0%) |
| No Fuel Used | 15 (0.2%) | 0 (0.0%) |
| Total | 9,154 (100.0%) | 1,431 (100.0%) |
Household Vehicle Usage in Erie
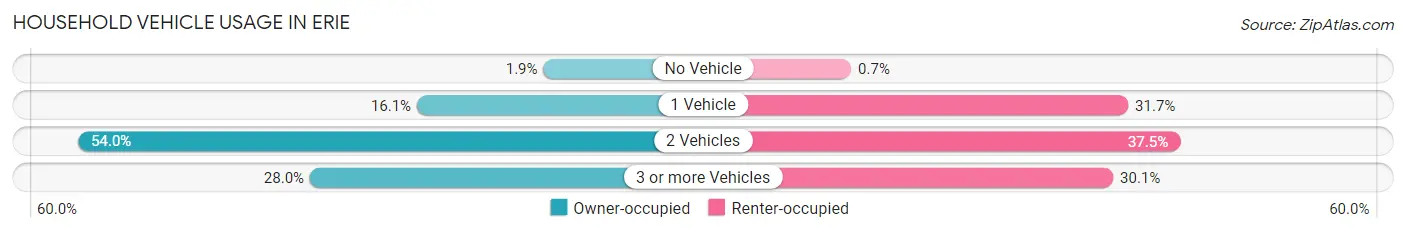
| Vehicles per Household | Owner-occupied | Renter-occupied |
| No Vehicle | 173 (1.9%) | 10 (0.7%) |
| 1 Vehicle | 1,469 (16.1%) | 454 (31.7%) |
| 2 Vehicles | 4,945 (54.0%) | 537 (37.5%) |
| 3 or more Vehicles | 2,567 (28.0%) | 430 (30.0%) |
| Total | 9,154 (100.0%) | 1,431 (100.0%) |
Real Estate & Mortgages in Erie
Real Estate and Mortgage Overview in Erie
| Characteristic | Without Mortgage | With Mortgage |
| Housing Units | 1,665 | 7,489 |
| Median Property Value | $608,300 | $651,800 |
| Median Household Income | $122,011 | $4,545 |
| Monthly Housing Costs | $732 | $3,182 |
| Real Estate Taxes | $3,744 | $111 |
Property Value by Mortgage Status in Erie
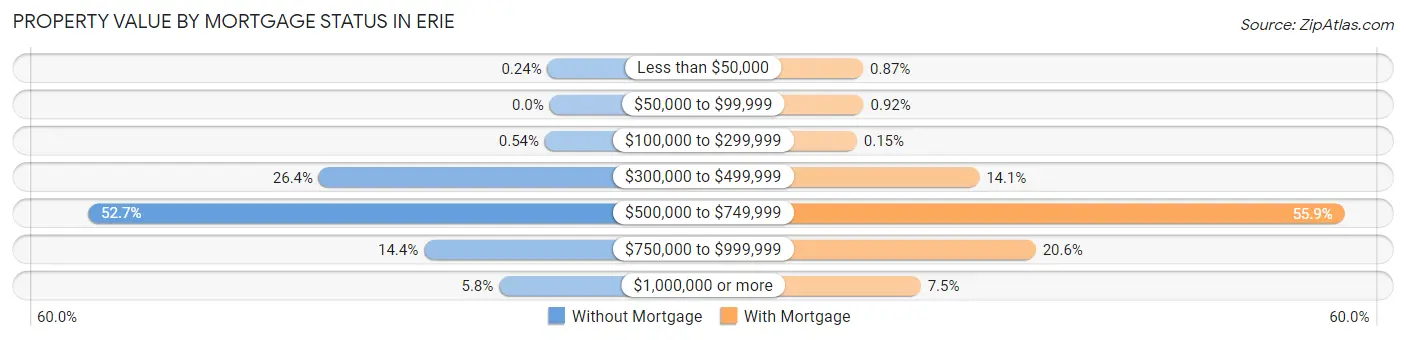
| Property Value | Without Mortgage | With Mortgage |
| Less than $50,000 | 4 (0.2%) | 65 (0.9%) |
| $50,000 to $99,999 | 0 (0.0%) | 69 (0.9%) |
| $100,000 to $299,999 | 9 (0.5%) | 11 (0.2%) |
| $300,000 to $499,999 | 439 (26.4%) | 1,058 (14.1%) |
| $500,000 to $749,999 | 878 (52.7%) | 4,186 (55.9%) |
| $750,000 to $999,999 | 239 (14.3%) | 1,542 (20.6%) |
| $1,000,000 or more | 96 (5.8%) | 558 (7.4%) |
| Total | 1,665 (100.0%) | 7,489 (100.0%) |
Household Income by Mortgage Status in Erie
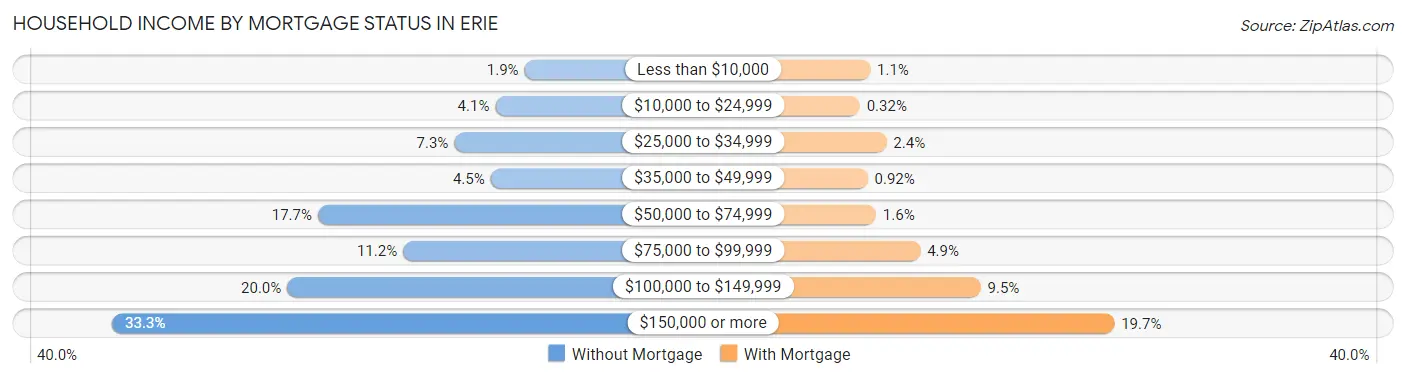
| Household Income | Without Mortgage | With Mortgage |
| Less than $10,000 | 32 (1.9%) | 83 (1.1%) |
| $10,000 to $24,999 | 69 (4.1%) | 24 (0.3%) |
| $25,000 to $34,999 | 121 (7.3%) | 176 (2.4%) |
| $35,000 to $49,999 | 75 (4.5%) | 69 (0.9%) |
| $50,000 to $74,999 | 294 (17.7%) | 116 (1.5%) |
| $75,000 to $99,999 | 186 (11.2%) | 369 (4.9%) |
| $100,000 to $149,999 | 333 (20.0%) | 714 (9.5%) |
| $150,000 or more | 555 (33.3%) | 1,476 (19.7%) |
| Total | 1,665 (100.0%) | 7,489 (100.0%) |
Property Value to Household Income Ratio in Erie
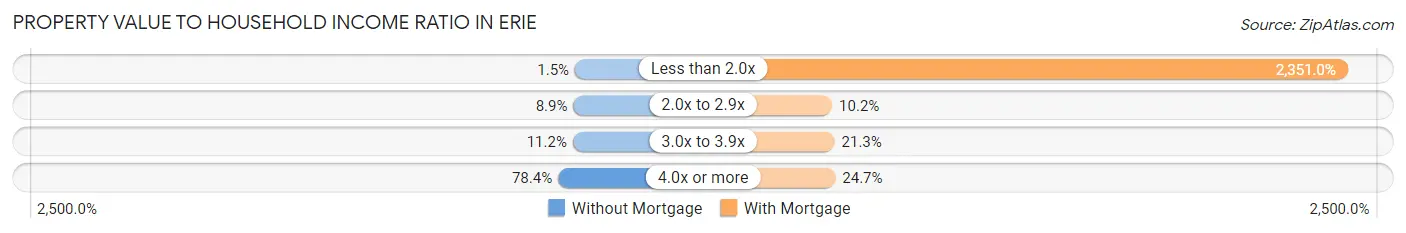
| Value-to-Income Ratio | Without Mortgage | With Mortgage |
| Less than 2.0x | 25 (1.5%) | 176,068 (2,351.0%) |
| 2.0x to 2.9x | 148 (8.9%) | 765 (10.2%) |
| 3.0x to 3.9x | 187 (11.2%) | 1,598 (21.3%) |
| 4.0x or more | 1,305 (78.4%) | 1,850 (24.7%) |
| Total | 1,665 (100.0%) | 7,489 (100.0%) |
Real Estate Taxes by Mortgage Status in Erie
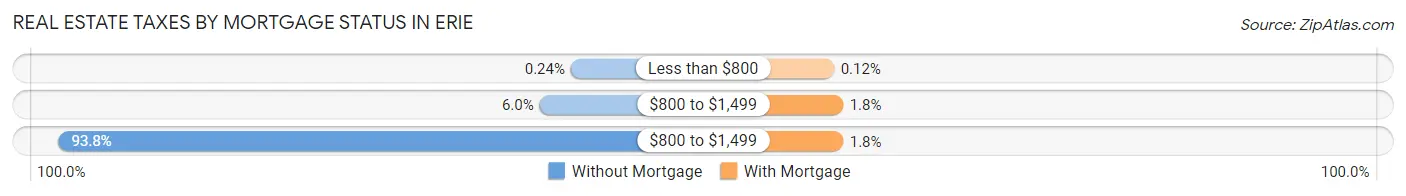
| Property Taxes | Without Mortgage | With Mortgage |
| Less than $800 | 4 (0.2%) | 9 (0.1%) |
| $800 to $1,499 | 99 (5.9%) | 132 (1.8%) |
| $800 to $1,499 | 1,562 (93.8%) | 133 (1.8%) |
| Total | 1,665 (100.0%) | 7,489 (100.0%) |
Health & Disability in Erie
Health Insurance Coverage by Age in Erie
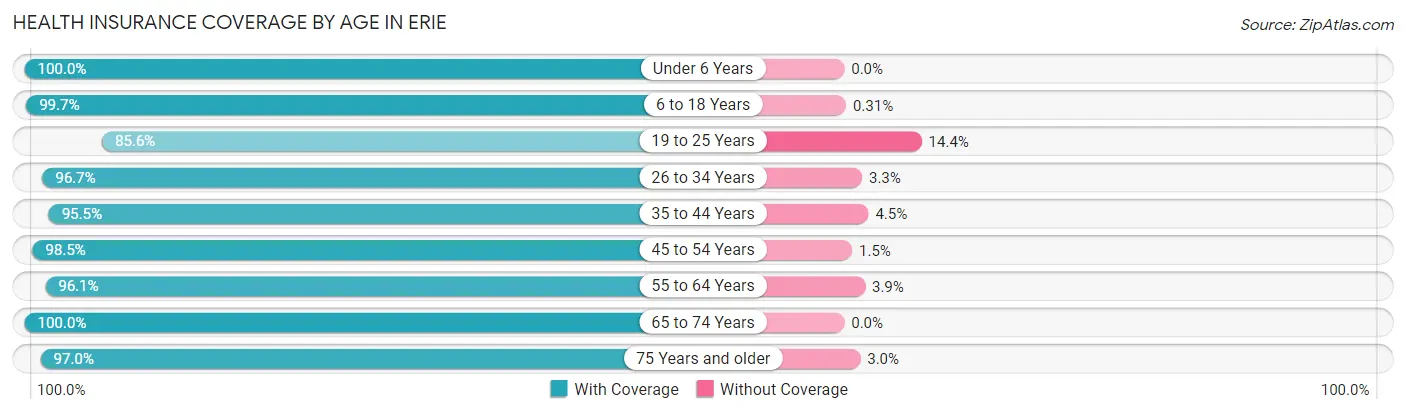
| Age Bracket | With Coverage | Without Coverage |
| Under 6 Years | 2,714 (100.0%) | 0 (0.0%) |
| 6 to 18 Years | 6,782 (99.7%) | 21 (0.3%) |
| 19 to 25 Years | 1,346 (85.6%) | 227 (14.4%) |
| 26 to 34 Years | 2,687 (96.7%) | 92 (3.3%) |
| 35 to 44 Years | 5,276 (95.5%) | 249 (4.5%) |
| 45 to 54 Years | 4,713 (98.5%) | 70 (1.5%) |
| 55 to 64 Years | 3,156 (96.1%) | 127 (3.9%) |
| 65 to 74 Years | 1,938 (100.0%) | 0 (0.0%) |
| 75 Years and older | 978 (97.0%) | 30 (3.0%) |
| Total | 29,590 (97.3%) | 816 (2.7%) |
Health Insurance Coverage by Citizenship Status in Erie
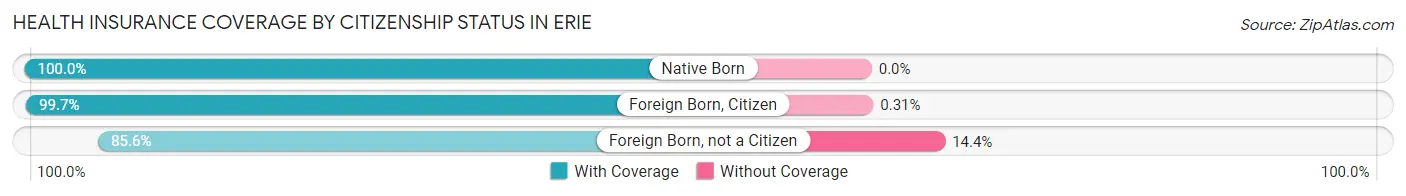
| Citizenship Status | With Coverage | Without Coverage |
| Native Born | 2,714 (100.0%) | 0 (0.0%) |
| Foreign Born, Citizen | 6,782 (99.7%) | 21 (0.3%) |
| Foreign Born, not a Citizen | 1,346 (85.6%) | 227 (14.4%) |
Health Insurance Coverage by Household Income in Erie
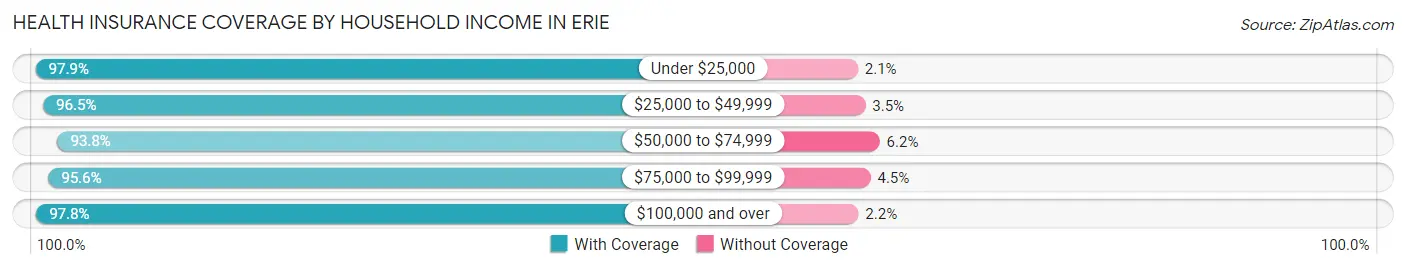
| Household Income | With Coverage | Without Coverage |
| Under $25,000 | 708 (97.9%) | 15 (2.1%) |
| $25,000 to $49,999 | 1,221 (96.5%) | 44 (3.5%) |
| $50,000 to $74,999 | 2,010 (93.8%) | 132 (6.2%) |
| $75,000 to $99,999 | 2,212 (95.6%) | 103 (4.4%) |
| $100,000 and over | 23,439 (97.8%) | 522 (2.2%) |
Public vs Private Health Insurance Coverage by Age in Erie
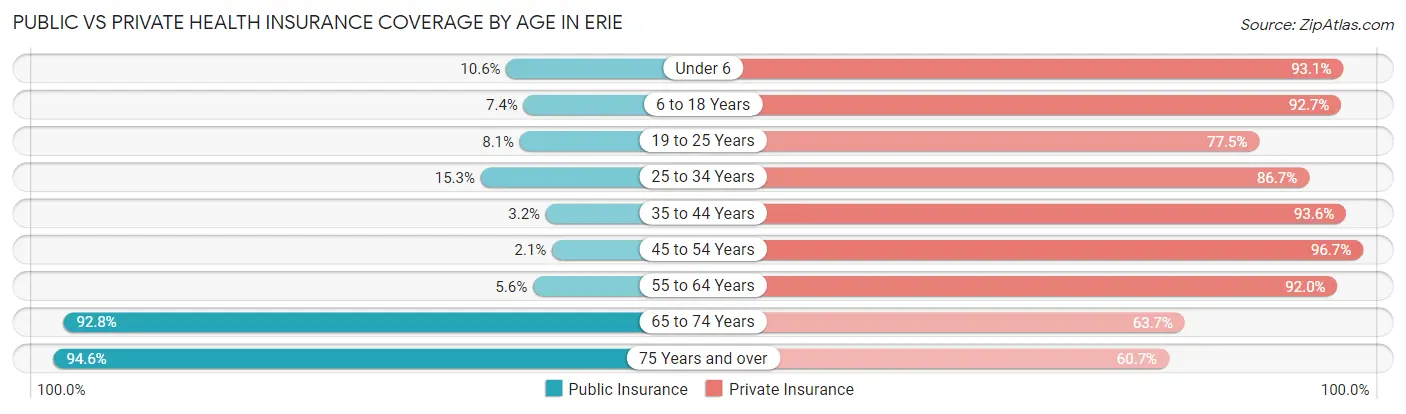
| Age Bracket | Public Insurance | Private Insurance |
| Under 6 | 287 (10.6%) | 2,526 (93.1%) |
| 6 to 18 Years | 501 (7.4%) | 6,305 (92.7%) |
| 19 to 25 Years | 127 (8.1%) | 1,219 (77.5%) |
| 25 to 34 Years | 426 (15.3%) | 2,410 (86.7%) |
| 35 to 44 Years | 179 (3.2%) | 5,171 (93.6%) |
| 45 to 54 Years | 99 (2.1%) | 4,627 (96.7%) |
| 55 to 64 Years | 185 (5.6%) | 3,020 (92.0%) |
| 65 to 74 Years | 1,798 (92.8%) | 1,234 (63.7%) |
| 75 Years and over | 954 (94.6%) | 612 (60.7%) |
| Total | 4,556 (15.0%) | 27,124 (89.2%) |
Disability Status by Sex by Age in Erie
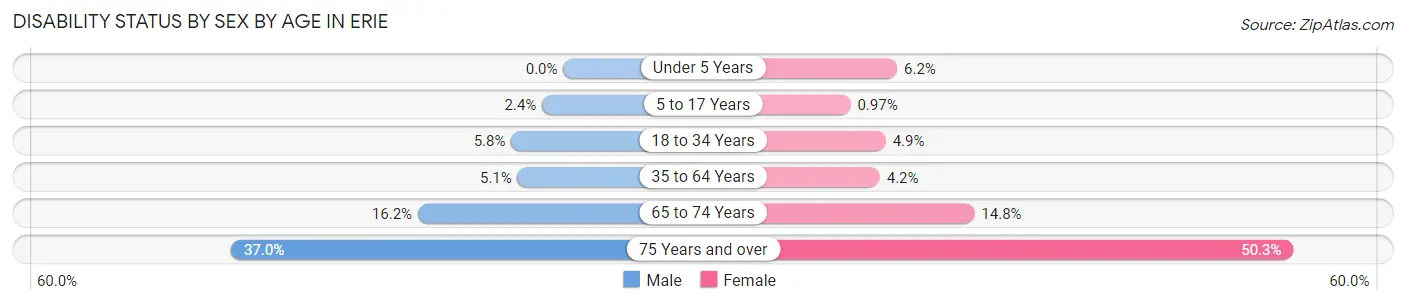
| Age Bracket | Male | Female |
| Under 5 Years | 0 (0.0%) | 81 (6.2%) |
| 5 to 17 Years | 88 (2.4%) | 33 (1.0%) |
| 18 to 34 Years | 131 (5.8%) | 117 (4.9%) |
| 35 to 64 Years | 344 (5.1%) | 289 (4.2%) |
| 65 to 74 Years | 145 (16.2%) | 154 (14.8%) |
| 75 Years and over | 181 (37.0%) | 261 (50.3%) |
Disability Class by Sex by Age in Erie
Disability Class: Hearing Difficulty
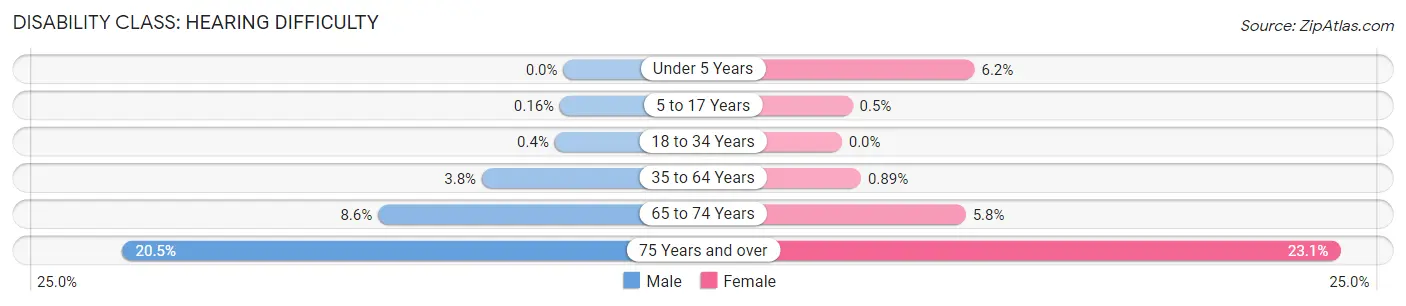
| Age Bracket | Male | Female |
| Under 5 Years | 0 (0.0%) | 81 (6.2%) |
| 5 to 17 Years | 6 (0.2%) | 17 (0.5%) |
| 18 to 34 Years | 9 (0.4%) | 0 (0.0%) |
| 35 to 64 Years | 255 (3.8%) | 61 (0.9%) |
| 65 to 74 Years | 77 (8.6%) | 60 (5.8%) |
| 75 Years and over | 100 (20.4%) | 120 (23.1%) |
Disability Class: Vision Difficulty
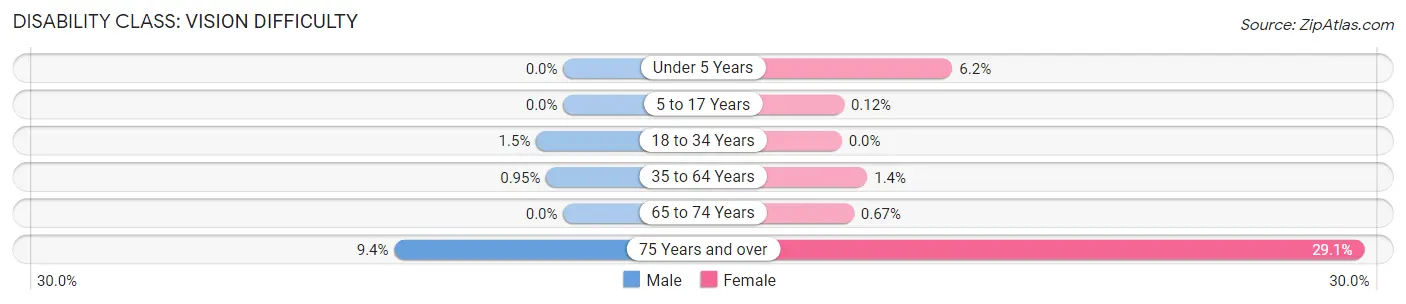
| Age Bracket | Male | Female |
| Under 5 Years | 0 (0.0%) | 81 (6.2%) |
| 5 to 17 Years | 0 (0.0%) | 4 (0.1%) |
| 18 to 34 Years | 34 (1.5%) | 0 (0.0%) |
| 35 to 64 Years | 64 (0.9%) | 97 (1.4%) |
| 65 to 74 Years | 0 (0.0%) | 7 (0.7%) |
| 75 Years and over | 46 (9.4%) | 151 (29.1%) |
Disability Class: Cognitive Difficulty
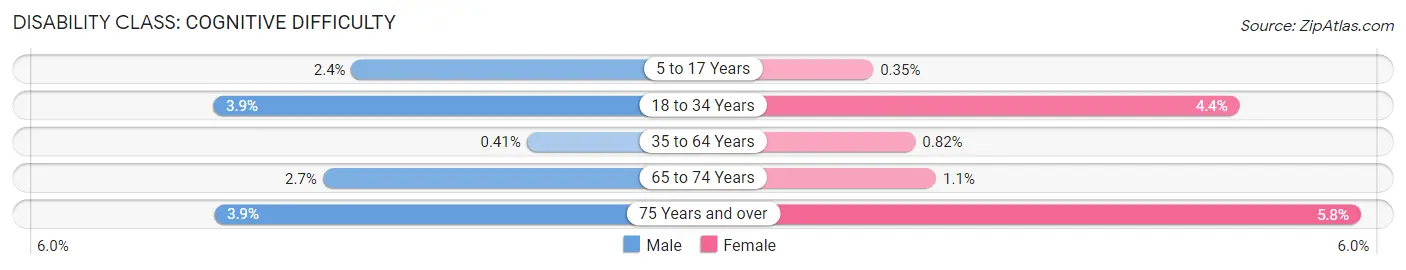
| Age Bracket | Male | Female |
| 5 to 17 Years | 88 (2.4%) | 12 (0.4%) |
| 18 to 34 Years | 88 (3.9%) | 106 (4.4%) |
| 35 to 64 Years | 28 (0.4%) | 56 (0.8%) |
| 65 to 74 Years | 24 (2.7%) | 11 (1.1%) |
| 75 Years and over | 19 (3.9%) | 30 (5.8%) |
Disability Class: Ambulatory Difficulty
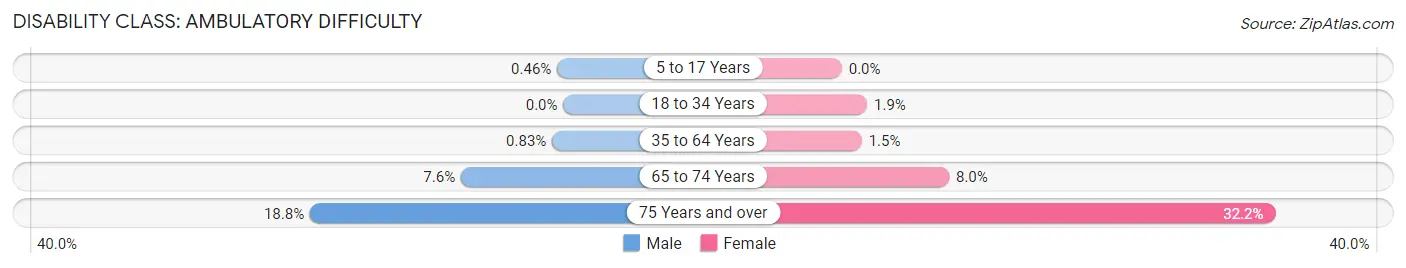
| Age Bracket | Male | Female |
| 5 to 17 Years | 17 (0.5%) | 0 (0.0%) |
| 18 to 34 Years | 0 (0.0%) | 45 (1.9%) |
| 35 to 64 Years | 56 (0.8%) | 101 (1.5%) |
| 65 to 74 Years | 68 (7.6%) | 83 (8.0%) |
| 75 Years and over | 92 (18.8%) | 167 (32.2%) |
Disability Class: Self-Care Difficulty
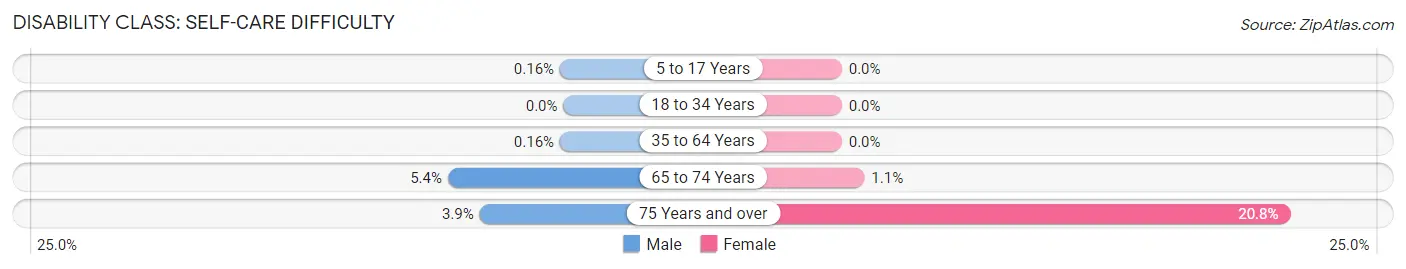
| Age Bracket | Male | Female |
| 5 to 17 Years | 6 (0.2%) | 0 (0.0%) |
| 18 to 34 Years | 0 (0.0%) | 0 (0.0%) |
| 35 to 64 Years | 11 (0.2%) | 0 (0.0%) |
| 65 to 74 Years | 48 (5.4%) | 11 (1.1%) |
| 75 Years and over | 19 (3.9%) | 108 (20.8%) |
Technology Access in Erie
Computing Device Access in Erie
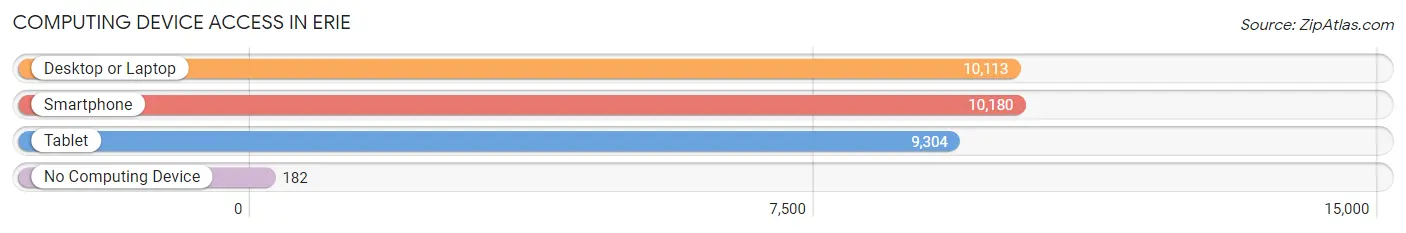
| Device Type | # Households | % Households |
| Desktop or Laptop | 10,113 | 95.5% |
| Smartphone | 10,180 | 96.2% |
| Tablet | 9,304 | 87.9% |
| No Computing Device | 182 | 1.7% |
| Total | 10,585 | 100.0% |
Internet Access in Erie
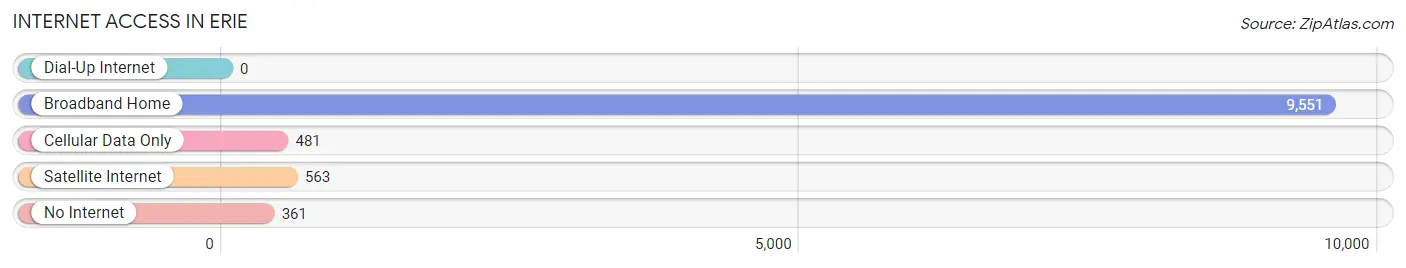
| Internet Type | # Households | % Households |
| Dial-Up Internet | 0 | 0.0% |
| Broadband Home | 9,551 | 90.2% |
| Cellular Data Only | 481 | 4.5% |
| Satellite Internet | 563 | 5.3% |
| No Internet | 361 | 3.4% |
| Total | 10,585 | 100.0% |
Erie Summary
Erie, Colorado is a small town located in Boulder County, Colorado, United States. It is situated along the Front Range of the Rocky Mountains, approximately 25 miles northwest of Denver. The town has a population of approximately 20,000 people and is part of the Denver-Aurora-Broomfield Metropolitan Statistical Area.
History
Erie was founded in 1881 by a group of settlers from the Midwest. The town was named after Erie, Pennsylvania, and was originally a farming community. The town was incorporated in 1904 and has since grown to become a thriving suburb of Denver.
Geography
Erie is located in the foothills of the Rocky Mountains, at an elevation of 5,071 feet. The town is situated along the Front Range of the Rocky Mountains, approximately 25 miles northwest of Denver. The town is bordered by the towns of Lafayette, Louisville, and Broomfield. The town is located in Boulder County and is part of the Denver-Aurora-Broomfield Metropolitan Statistical Area.
The town is located in a semi-arid climate, with hot summers and cold winters. The average annual temperature is 54°F, with an average high of 79°F in the summer and an average low of 28°F in the winter. The town receives an average of 16 inches of precipitation per year.
Economy
Erie’s economy is largely based on the service industry, with many businesses providing services to the surrounding communities. The town is home to several large employers, including the University of Colorado, IBM, and the University of Colorado Hospital. The town also has a thriving retail sector, with several large shopping centers and a variety of restaurants and stores.
Demographics
As of the 2010 census, the population of Erie was 20,049. The racial makeup of the town was 87.3% White, 4.2% Hispanic or Latino, 3.2% Asian, 2.2% African American, and 0.7% Native American. The median household income was $90,845, and the median family income was $103,945.
Erie is a diverse community, with a variety of religious and cultural backgrounds. The town is home to a variety of churches, including Catholic, Lutheran, Methodist, and Presbyterian. The town also has a variety of cultural events, including the annual Erie Days celebration, which features a parade, carnival, and fireworks.
Conclusion
Erie, Colorado is a small town located in Boulder County, Colorado, United States. It is situated along the Front Range of the Rocky Mountains, approximately 25 miles northwest of Denver. The town has a population of approximately 20,000 people and is part of the Denver-Aurora-Broomfield Metropolitan Statistical Area. The town’s economy is largely based on the service industry, with many businesses providing services to the surrounding communities. The town is also home to a diverse population, with a variety of religious and cultural backgrounds. Erie is a thriving suburb of Denver, with a variety of cultural events and a thriving retail sector.
Common Questions
What is Per Capita Income in Erie?
Per Capita income in Erie is $60,172.
What is the Median Family Income in Erie?
Median Family Income in Erie is $171,533.
What is the Median Household income in Erie?
Median Household Income in Erie is $154,509.
What is Income or Wage Gap in Erie?
Income or Wage Gap in Erie is 45.7%.
Women in Erie earn 54.3 cents for every dollar earned by a man.
What is Inequality or Gini Index in Erie?
Inequality or Gini Index in Erie is 0.35.
What is the Total Population of Erie?
Total Population of Erie is 30,447.
What is the Total Male Population of Erie?
Total Male Population of Erie is 14,929.
What is the Total Female Population of Erie?
Total Female Population of Erie is 15,518.
What is the Ratio of Males per 100 Females in Erie?
There are 96.20 Males per 100 Females in Erie.
What is the Ratio of Females per 100 Males in Erie?
There are 103.95 Females per 100 Males in Erie.
What is the Median Population Age in Erie?
Median Population Age in Erie is 37.4 Years.
What is the Average Family Size in Erie
Average Family Size in Erie is 3.2 People.
What is the Average Household Size in Erie
Average Household Size in Erie is 2.9 People.
How Large is the Labor Force in Erie?
There are 16,852 People in the Labor Forcein in Erie.
What is the Percentage of People in the Labor Force in Erie?
76.4% of People are in the Labor Force in Erie.
What is the Unemployment Rate in Erie?
Unemployment Rate in Erie is 4.0%.