Greeley, CO Map & Demographics
Greeley Map
Greeley Overview
$31,565
PER CAPITA INCOME
$81,872
AVG FAMILY INCOME
$65,525
AVG HOUSEHOLD INCOME
27.9%
WAGE / INCOME GAP [ % ]
72.1¢/ $1
WAGE / INCOME GAP [ $ ]
$12,520
FAMILY INCOME DEFICIT
0.44
INEQUALITY / GINI INDEX
107,949
TOTAL POPULATION
54,193
MALE POPULATION
53,756
FEMALE POPULATION
100.81
MALES / 100 FEMALES
99.19
FEMALES / 100 MALES
31.9
MEDIAN AGE
3.3
AVG FAMILY SIZE
2.7
AVG HOUSEHOLD SIZE
55,249
LABOR FORCE [ PEOPLE ]
65.2%
PERCENT IN LABOR FORCE
5.6%
UNEMPLOYMENT RATE
Greeley Area Codes
Income in Greeley
Income Overview in Greeley
Per Capita Income in Greeley is $31,565, while median incomes of families and households are $81,872 and $65,525 respectively.
| Characteristic | Number | Measure |
| Per Capita Income | 107,949 | $31,565 |
| Median Family Income | 24,897 | $81,872 |
| Mean Family Income | 24,897 | $97,798 |
| Median Household Income | 38,006 | $65,525 |
| Mean Household Income | 38,006 | $85,013 |
| Income Deficit | 24,897 | $12,520 |
| Wage / Income Gap (%) | 107,949 | 27.86% |
| Wage / Income Gap ($) | 107,949 | 72.14¢ per $1 |
| Gini / Inequality Index | 107,949 | 0.44 |
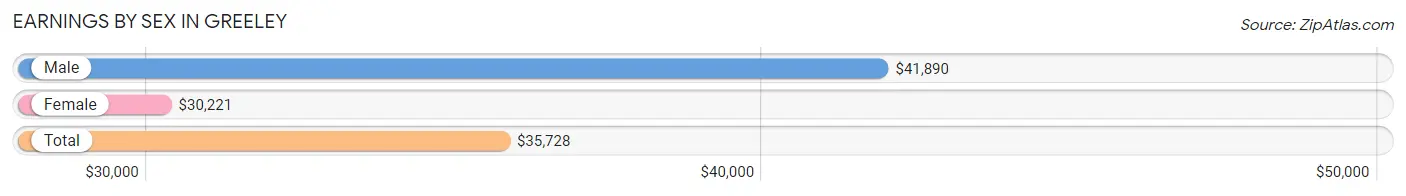
Earnings by Sex in Greeley
Average Earnings in Greeley are $35,728, $41,890 for men and $30,221 for women, a difference of 27.9%.
| Sex | Number | Average Earnings |
| Male | 31,821 (54.8%) | $41,890 |
| Female | 26,212 (45.2%) | $30,221 |
| Total | 58,033 (100.0%) | $35,728 |
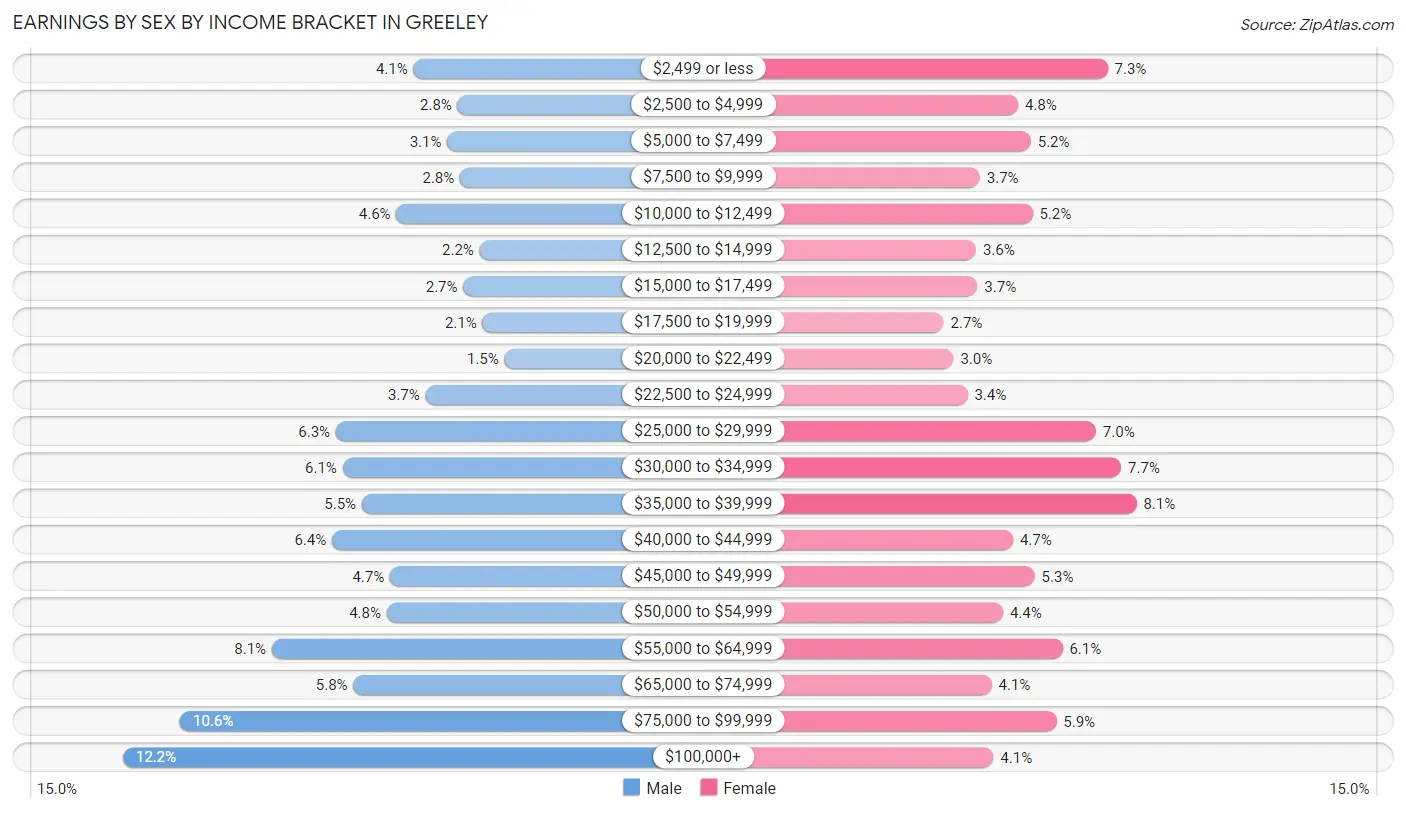
Earnings by Sex by Income Bracket in Greeley
The most common earnings brackets in Greeley are $100,000+ for men (3,896 | 12.2%) and $35,000 to $39,999 for women (2,133 | 8.1%).
| Income | Male | Female |
| $2,499 or less | 1,296 (4.1%) | 1,922 (7.3%) |
| $2,500 to $4,999 | 900 (2.8%) | 1,260 (4.8%) |
| $5,000 to $7,499 | 993 (3.1%) | 1,355 (5.2%) |
| $7,500 to $9,999 | 878 (2.8%) | 980 (3.7%) |
| $10,000 to $12,499 | 1,448 (4.5%) | 1,367 (5.2%) |
| $12,500 to $14,999 | 704 (2.2%) | 951 (3.6%) |
| $15,000 to $17,499 | 849 (2.7%) | 962 (3.7%) |
| $17,500 to $19,999 | 679 (2.1%) | 713 (2.7%) |
| $20,000 to $22,499 | 480 (1.5%) | 786 (3.0%) |
| $22,500 to $24,999 | 1,187 (3.7%) | 888 (3.4%) |
| $25,000 to $29,999 | 1,988 (6.2%) | 1,836 (7.0%) |
| $30,000 to $34,999 | 1,928 (6.1%) | 2,022 (7.7%) |
| $35,000 to $39,999 | 1,757 (5.5%) | 2,133 (8.1%) |
| $40,000 to $44,999 | 2,023 (6.4%) | 1,225 (4.7%) |
| $45,000 to $49,999 | 1,505 (4.7%) | 1,384 (5.3%) |
| $50,000 to $54,999 | 1,534 (4.8%) | 1,151 (4.4%) |
| $55,000 to $64,999 | 2,560 (8.1%) | 1,588 (6.1%) |
| $65,000 to $74,999 | 1,834 (5.8%) | 1,066 (4.1%) |
| $75,000 to $99,999 | 3,382 (10.6%) | 1,544 (5.9%) |
| $100,000+ | 3,896 (12.2%) | 1,079 (4.1%) |
| Total | 31,821 (100.0%) | 26,212 (100.0%) |
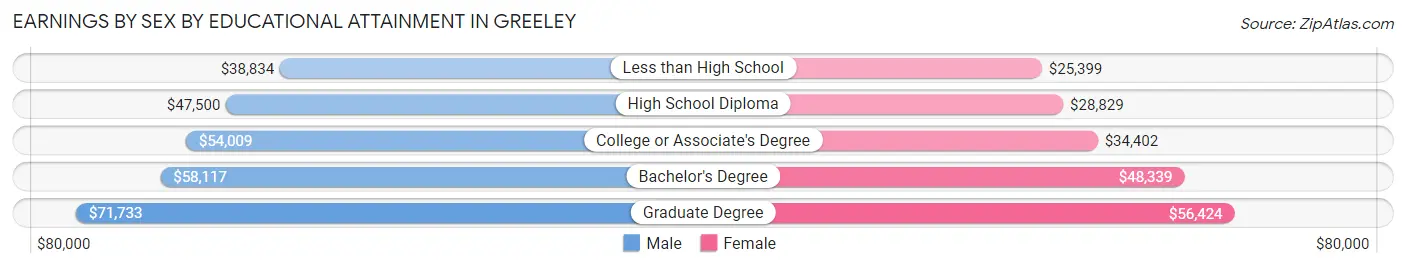
Earnings by Sex by Educational Attainment in Greeley
Average earnings in Greeley are $49,702 for men and $35,833 for women, a difference of 27.9%. Men with an educational attainment of graduate degree enjoy the highest average annual earnings of $71,733, while those with less than high school education earn the least with $38,834. Women with an educational attainment of graduate degree earn the most with the average annual earnings of $56,424, while those with less than high school education have the smallest earnings of $25,399.
| Educational Attainment | Male Income | Female Income |
| Less than High School | $38,834 | $25,399 |
| High School Diploma | $47,500 | $28,829 |
| College or Associate's Degree | $54,009 | $34,402 |
| Bachelor's Degree | $58,117 | $48,339 |
| Graduate Degree | $71,733 | $56,424 |
| Total | $49,702 | $35,833 |
Family Income in Greeley
Family Income Brackets in Greeley
According to the Greeley family income data, there are 5,527 families falling into the $100,000 to $149,999 income range, which is the most common income bracket and makes up 22.2% of all families. Conversely, the $10,000 to $14,999 income bracket is the least frequent group with only 871 families (3.5%) belonging to this category.
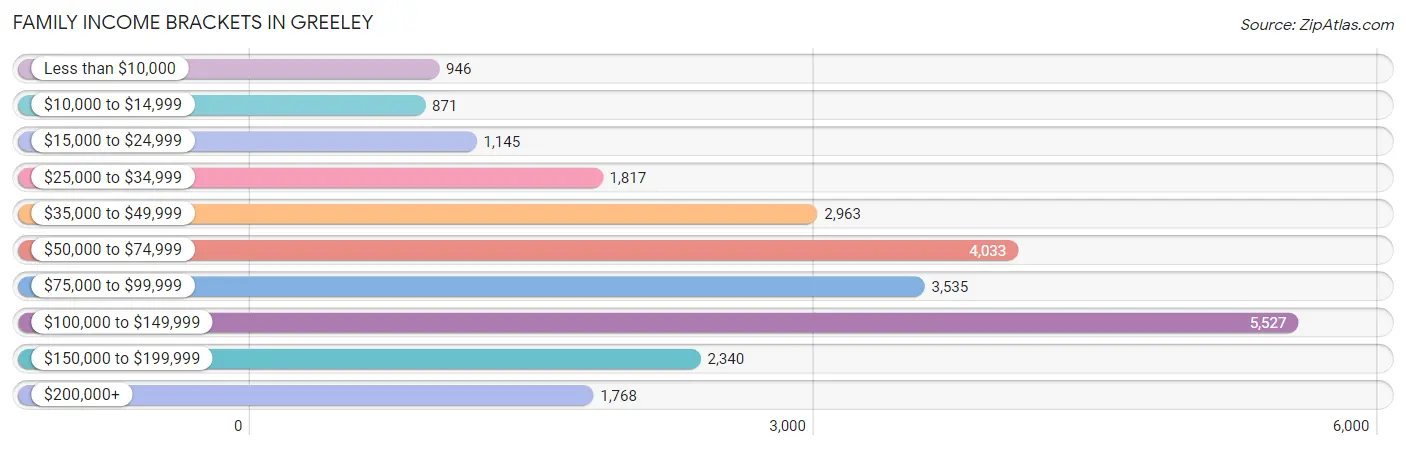
| Income Bracket | # Families | % Families |
| Less than $10,000 | 946 | 3.8% |
| $10,000 to $14,999 | 871 | 3.5% |
| $15,000 to $24,999 | 1,145 | 4.6% |
| $25,000 to $34,999 | 1,817 | 7.3% |
| $35,000 to $49,999 | 2,963 | 11.9% |
| $50,000 to $74,999 | 4,033 | 16.2% |
| $75,000 to $99,999 | 3,535 | 14.2% |
| $100,000 to $149,999 | 5,527 | 22.2% |
| $150,000 to $199,999 | 2,340 | 9.4% |
| $200,000+ | 1,768 | 7.1% |
Family Income by Famaliy Size in Greeley
7+ person families (700 | 2.8%) account for the highest median family income in Greeley with $103,065 per family, while 2-person families (10,855 | 43.6%) have the highest median income of $35,476 per family member.
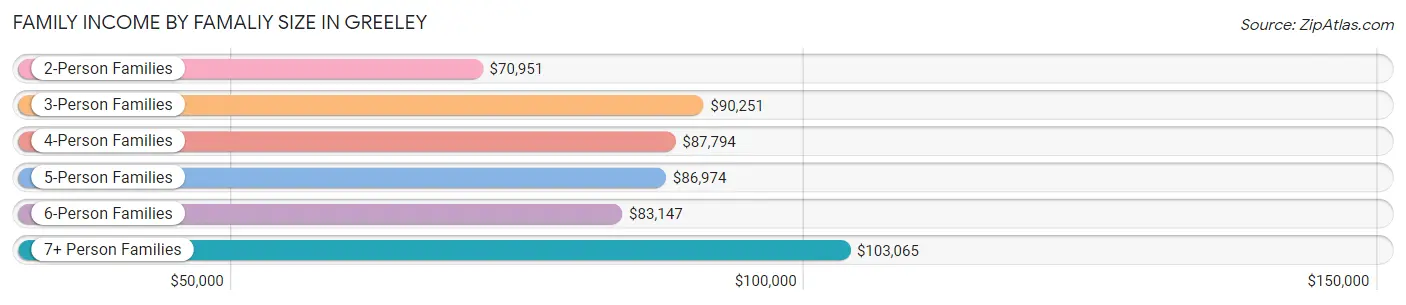
| Income Bracket | # Families | Median Income |
| 2-Person Families | 10,855 (43.6%) | $70,951 |
| 3-Person Families | 5,098 (20.5%) | $90,251 |
| 4-Person Families | 4,979 (20.0%) | $87,794 |
| 5-Person Families | 2,424 (9.7%) | $86,974 |
| 6-Person Families | 841 (3.4%) | $83,147 |
| 7+ Person Families | 700 (2.8%) | $103,065 |
| Total | 24,897 (100.0%) | $81,872 |
Family Income by Number of Earners in Greeley
The median family income in Greeley is $81,872, with families comprising 3+ earners (2,974) having the highest median family income of $132,945, while families with no earners (3,149) have the lowest median family income of $44,513, accounting for 11.9% and 12.7% of families, respectively.
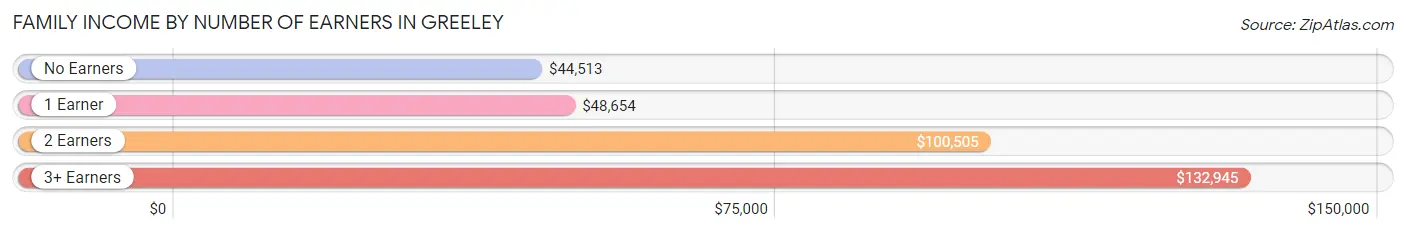
| Number of Earners | # Families | Median Income |
| No Earners | 3,149 (12.7%) | $44,513 |
| 1 Earner | 8,455 (34.0%) | $48,654 |
| 2 Earners | 10,319 (41.4%) | $100,505 |
| 3+ Earners | 2,974 (11.9%) | $132,945 |
| Total | 24,897 (100.0%) | $81,872 |
Household Income in Greeley
Household Income Brackets in Greeley
With 7,373 households falling in the category, the $100,000 to $149,999 income range is the most frequent in Greeley, accounting for 19.4% of all households. In contrast, only 1,710 households (4.5%) fall into the $10,000 to $14,999 income bracket, making it the least populous group.
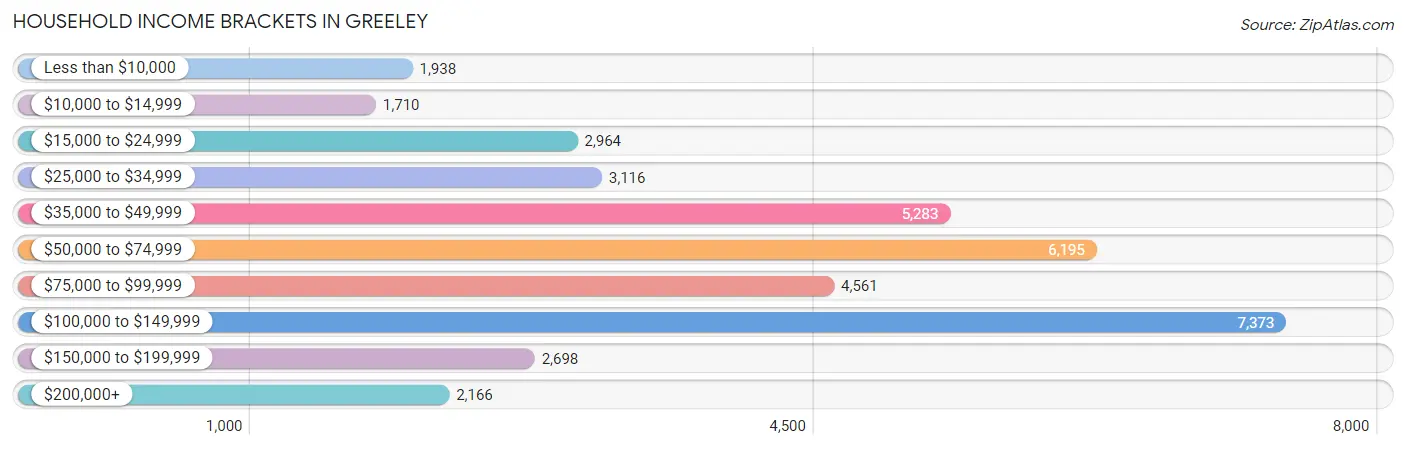
| Income Bracket | # Households | % Households |
| Less than $10,000 | 1,938 | 5.1% |
| $10,000 to $14,999 | 1,710 | 4.5% |
| $15,000 to $24,999 | 2,964 | 7.8% |
| $25,000 to $34,999 | 3,116 | 8.2% |
| $35,000 to $49,999 | 5,283 | 13.9% |
| $50,000 to $74,999 | 6,195 | 16.3% |
| $75,000 to $99,999 | 4,561 | 12.0% |
| $100,000 to $149,999 | 7,373 | 19.4% |
| $150,000 to $199,999 | 2,698 | 7.1% |
| $200,000+ | 2,166 | 5.7% |
Household Income by Householder Age in Greeley
The median household income in Greeley is $65,525, with the highest median household income of $84,985 found in the 45 to 64 years age bracket for the primary householder. A total of 12,557 households (33.0%) fall into this category. Meanwhile, the 15 to 24 years age bracket for the primary householder has the lowest median household income of $41,281, with 2,622 households (6.9%) in this group.
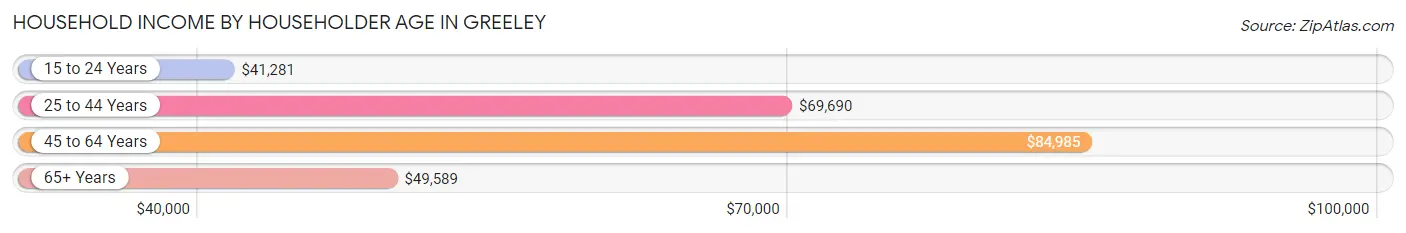
| Income Bracket | # Households | Median Income |
| 15 to 24 Years | 2,622 (6.9%) | $41,281 |
| 25 to 44 Years | 13,785 (36.3%) | $69,690 |
| 45 to 64 Years | 12,557 (33.0%) | $84,985 |
| 65+ Years | 9,042 (23.8%) | $49,589 |
| Total | 38,006 (100.0%) | $65,525 |
Poverty in Greeley
Income Below Poverty by Sex and Age in Greeley
With 13.3% poverty level for males and 18.1% for females among the residents of Greeley, 5 year old males and 16 and 17 year old females are the most vulnerable to poverty, with 127 males (24.0%) and 432 females (32.8%) in their respective age groups living below the poverty level.
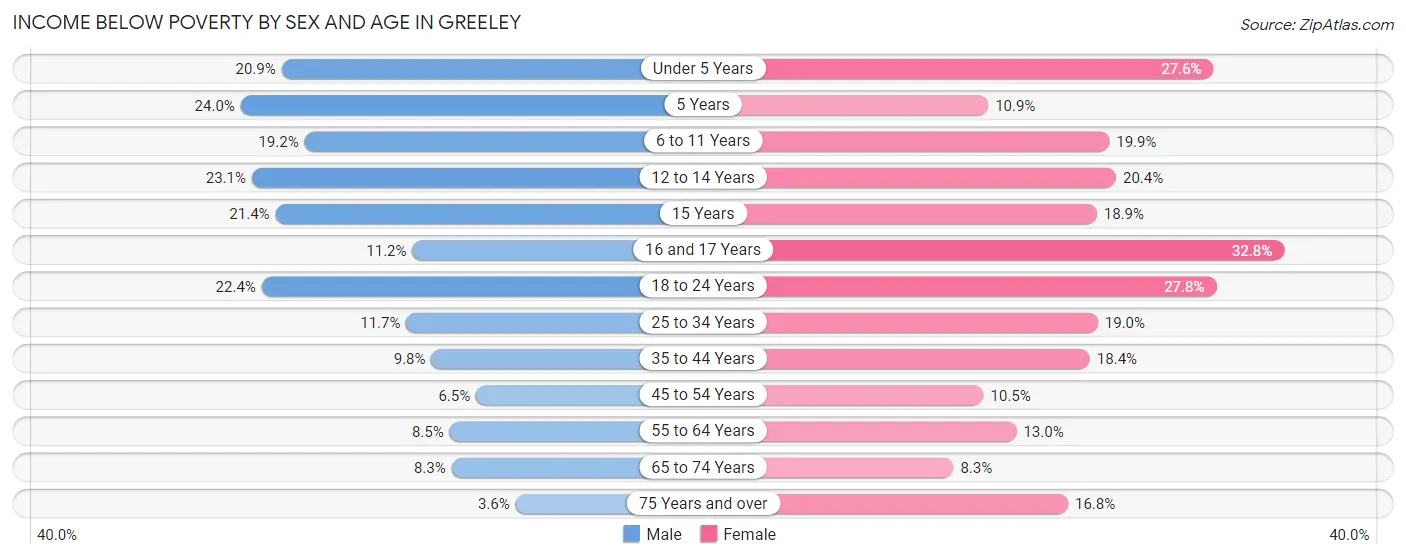
| Age Bracket | Male | Female |
| Under 5 Years | 789 (20.9%) | 880 (27.6%) |
| 5 Years | 127 (24.0%) | 79 (10.9%) |
| 6 to 11 Years | 847 (19.2%) | 866 (19.9%) |
| 12 to 14 Years | 482 (23.1%) | 383 (20.4%) |
| 15 Years | 202 (21.4%) | 148 (18.9%) |
| 16 and 17 Years | 164 (11.2%) | 432 (32.8%) |
| 18 to 24 Years | 1,338 (22.4%) | 1,540 (27.8%) |
| 25 to 34 Years | 1,059 (11.7%) | 1,588 (19.0%) |
| 35 to 44 Years | 615 (9.8%) | 1,076 (18.4%) |
| 45 to 54 Years | 348 (6.5%) | 610 (10.5%) |
| 55 to 64 Years | 468 (8.5%) | 697 (13.0%) |
| 65 to 74 Years | 299 (8.3%) | 365 (8.3%) |
| 75 Years and over | 86 (3.5%) | 519 (16.8%) |
| Total | 6,824 (13.3%) | 9,183 (18.1%) |
Income Above Poverty by Sex and Age in Greeley
According to the poverty statistics in Greeley, males aged 75 years and over and females aged 65 to 74 years are the age groups that are most secure financially, with 96.5% of males and 91.7% of females in these age groups living above the poverty line.
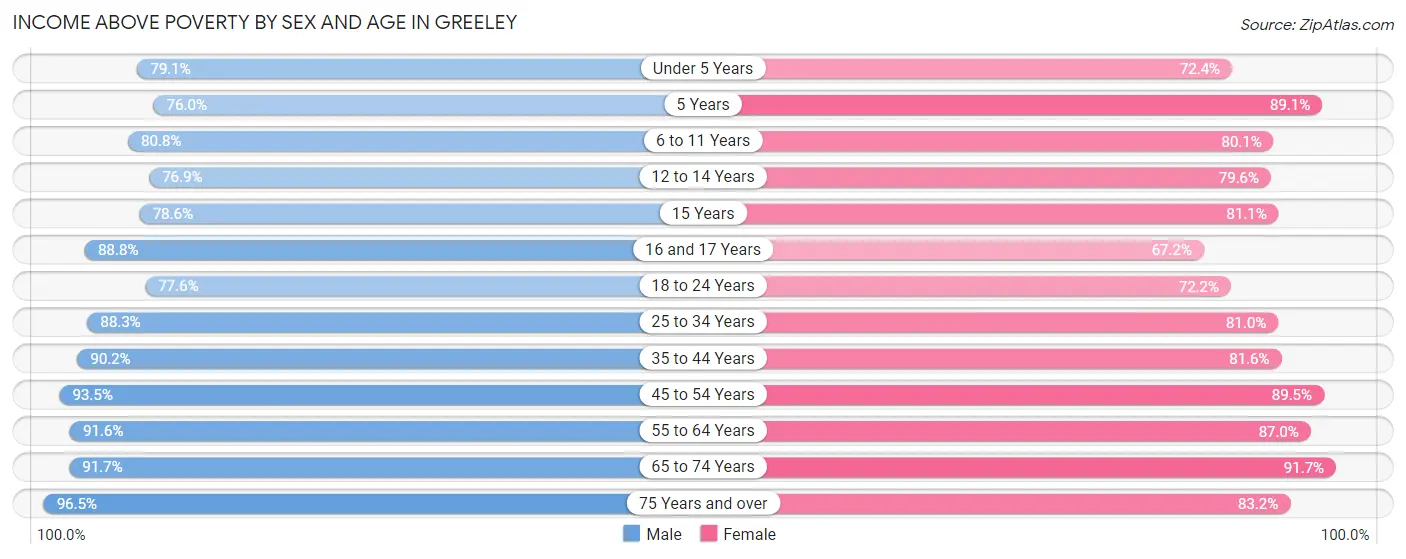
| Age Bracket | Male | Female |
| Under 5 Years | 2,983 (79.1%) | 2,309 (72.4%) |
| 5 Years | 403 (76.0%) | 648 (89.1%) |
| 6 to 11 Years | 3,560 (80.8%) | 3,495 (80.1%) |
| 12 to 14 Years | 1,602 (76.9%) | 1,498 (79.6%) |
| 15 Years | 743 (78.6%) | 634 (81.1%) |
| 16 and 17 Years | 1,299 (88.8%) | 884 (67.2%) |
| 18 to 24 Years | 4,636 (77.6%) | 3,999 (72.2%) |
| 25 to 34 Years | 8,024 (88.3%) | 6,766 (81.0%) |
| 35 to 44 Years | 5,659 (90.2%) | 4,767 (81.6%) |
| 45 to 54 Years | 5,026 (93.5%) | 5,185 (89.5%) |
| 55 to 64 Years | 5,069 (91.5%) | 4,679 (87.0%) |
| 65 to 74 Years | 3,305 (91.7%) | 4,037 (91.7%) |
| 75 Years and over | 2,334 (96.5%) | 2,570 (83.2%) |
| Total | 44,643 (86.7%) | 41,471 (81.9%) |
Income Below Poverty Among Married-Couple Families in Greeley
The poverty statistics for married-couple families in Greeley show that 7.5% or 1,371 of the total 18,159 families live below the poverty line. Families with 5 or more children have the highest poverty rate of 66.5%, comprising of 119 families. On the other hand, families with no children have the lowest poverty rate of 3.1%, which includes 305 families.
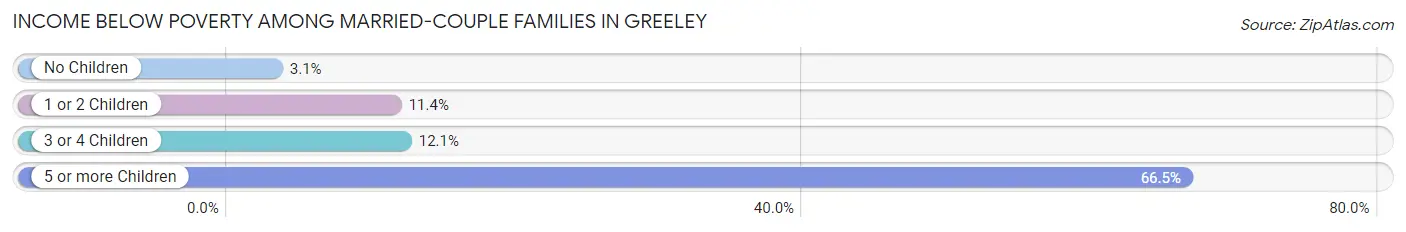
| Children | Above Poverty | Below Poverty |
| No Children | 9,481 (96.9%) | 305 (3.1%) |
| 1 or 2 Children | 5,590 (88.6%) | 719 (11.4%) |
| 3 or 4 Children | 1,657 (87.9%) | 228 (12.1%) |
| 5 or more Children | 60 (33.5%) | 119 (66.5%) |
| Total | 16,788 (92.4%) | 1,371 (7.5%) |
Income Below Poverty Among Single-Parent Households in Greeley
According to the poverty data in Greeley, 5.9% or 113 single-father households and 28.4% or 1,367 single-mother households are living below the poverty line. Among single-father households, those with 5 or more children have the highest poverty rate, with 24 households (100.0%) experiencing poverty. Likewise, among single-mother households, those with 5 or more children have the highest poverty rate, with 44 households (65.7%) falling below the poverty line.
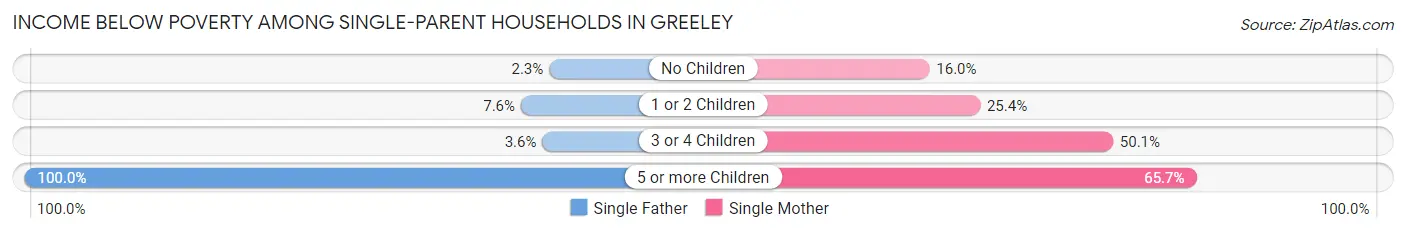
| Children | Single Father | Single Mother |
| No Children | 19 (2.3%) | 235 (16.0%) |
| 1 or 2 Children | 60 (7.6%) | 569 (25.4%) |
| 3 or 4 Children | 10 (3.6%) | 519 (50.1%) |
| 5 or more Children | 24 (100.0%) | 44 (65.7%) |
| Total | 113 (5.9%) | 1,367 (28.4%) |
Income Below Poverty Among Married-Couple vs Single-Parent Households in Greeley
The poverty data for Greeley shows that 1,371 of the married-couple family households (7.5%) and 1,480 of the single-parent households (22.0%) are living below the poverty level. Within the married-couple family households, those with 5 or more children have the highest poverty rate, with 119 households (66.5%) falling below the poverty line. Among the single-parent households, those with 5 or more children have the highest poverty rate, with 68 household (74.7%) living below poverty.
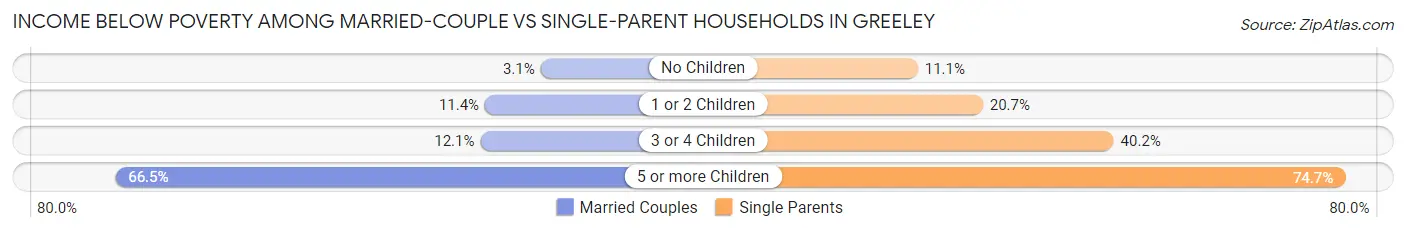
| Children | Married-Couple Families | Single-Parent Households |
| No Children | 305 (3.1%) | 254 (11.1%) |
| 1 or 2 Children | 719 (11.4%) | 629 (20.7%) |
| 3 or 4 Children | 228 (12.1%) | 529 (40.2%) |
| 5 or more Children | 119 (66.5%) | 68 (74.7%) |
| Total | 1,371 (7.5%) | 1,480 (22.0%) |
Race in Greeley
The most populous races in Greeley are White / Caucasian (82,069 | 76.0%), Hispanic or Latino (43,058 | 39.9%), and Two or more Races (11,688 | 10.8%).
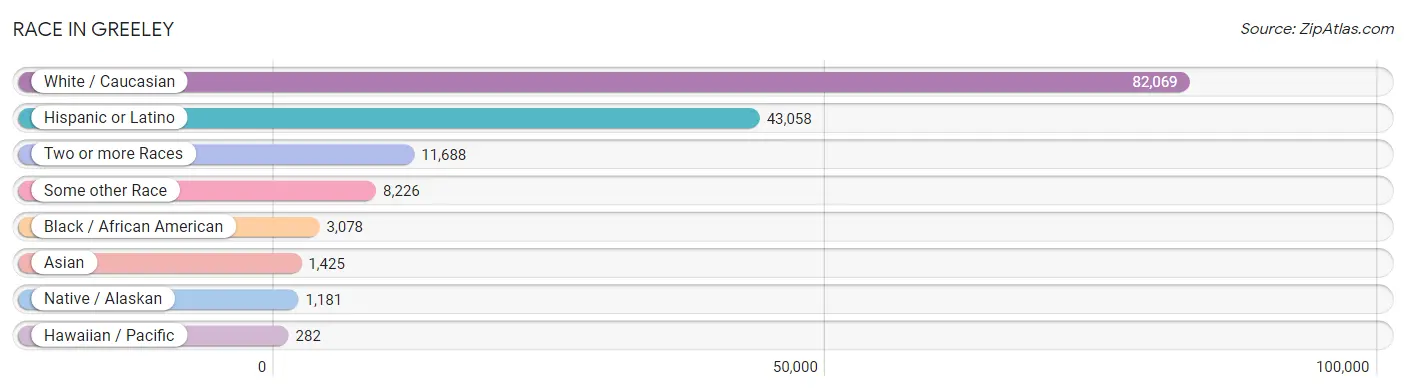
| Race | # Population | % Population |
| Asian | 1,425 | 1.3% |
| Black / African American | 3,078 | 2.9% |
| Hawaiian / Pacific | 282 | 0.3% |
| Hispanic or Latino | 43,058 | 39.9% |
| Native / Alaskan | 1,181 | 1.1% |
| White / Caucasian | 82,069 | 76.0% |
| Two or more Races | 11,688 | 10.8% |
| Some other Race | 8,226 | 7.6% |
| Total | 107,949 | 100.0% |
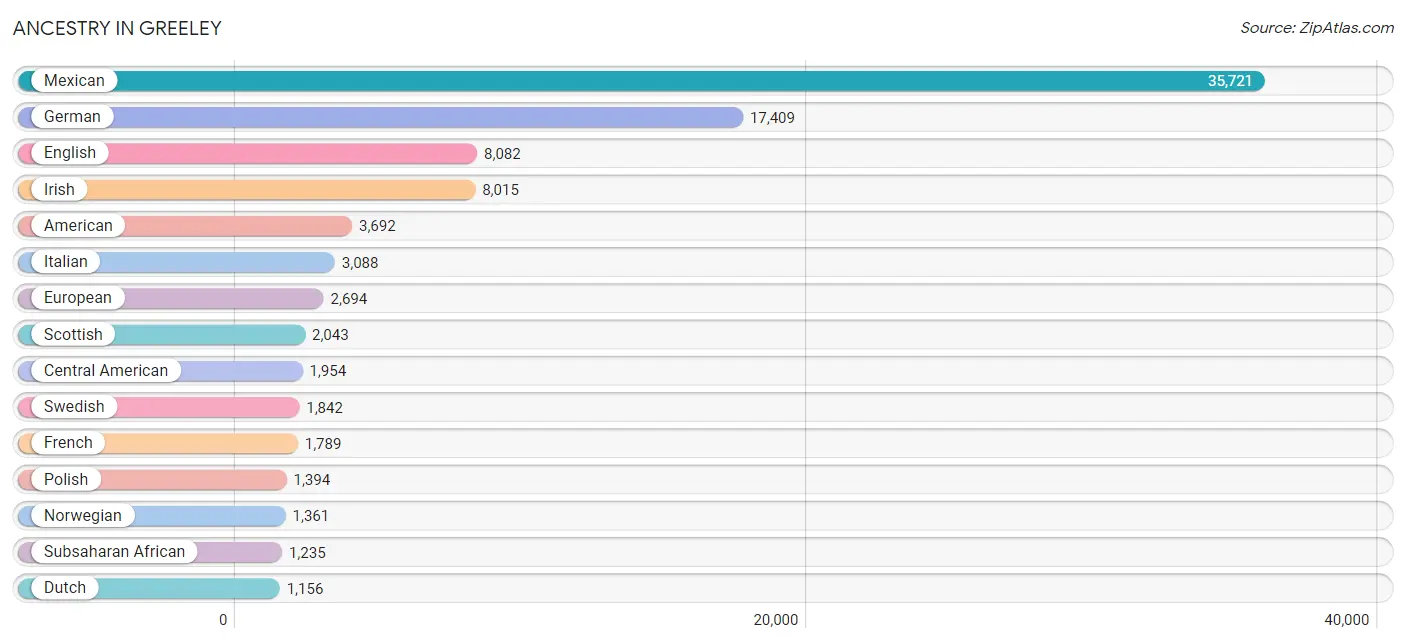
Ancestry in Greeley
The most populous ancestries reported in Greeley are Mexican (35,721 | 33.1%), German (17,409 | 16.1%), English (8,082 | 7.5%), Irish (8,015 | 7.4%), and American (3,692 | 3.4%), together accounting for 67.6% of all Greeley residents.
| Ancestry | # Population | % Population |
| African | 344 | 0.3% |
| American | 3,692 | 3.4% |
| Apache | 138 | 0.1% |
| Arab | 405 | 0.4% |
| Argentinean | 36 | 0.0% |
| Armenian | 22 | 0.0% |
| Austrian | 175 | 0.2% |
| Bangladeshi | 8 | 0.0% |
| Barbadian | 9 | 0.0% |
| Basque | 37 | 0.0% |
| Belgian | 80 | 0.1% |
| Bhutanese | 398 | 0.4% |
| Blackfeet | 24 | 0.0% |
| Brazilian | 27 | 0.0% |
| British | 454 | 0.4% |
| Bulgarian | 22 | 0.0% |
| Burmese | 378 | 0.4% |
| Cajun | 5 | 0.0% |
| Cambodian | 10 | 0.0% |
| Canadian | 102 | 0.1% |
| Celtic | 7 | 0.0% |
| Central American | 1,954 | 1.8% |
| Central American Indian | 147 | 0.1% |
| Cherokee | 370 | 0.3% |
| Chippewa | 91 | 0.1% |
| Choctaw | 18 | 0.0% |
| Colombian | 57 | 0.1% |
| Comanche | 54 | 0.1% |
| Cree | 20 | 0.0% |
| Croatian | 151 | 0.1% |
| Cuban | 122 | 0.1% |
| Czech | 335 | 0.3% |
| Czechoslovakian | 58 | 0.1% |
| Danish | 515 | 0.5% |
| Dominican | 8 | 0.0% |
| Dutch | 1,156 | 1.1% |
| Eastern European | 138 | 0.1% |
| Ecuadorian | 26 | 0.0% |
| Egyptian | 15 | 0.0% |
| English | 8,082 | 7.5% |
| Ethiopian | 385 | 0.4% |
| European | 2,694 | 2.5% |
| Filipino | 69 | 0.1% |
| Finnish | 65 | 0.1% |
| French | 1,789 | 1.7% |
| French Canadian | 344 | 0.3% |
| German | 17,409 | 16.1% |
| German Russian | 109 | 0.1% |
| Greek | 204 | 0.2% |
| Guamanian / Chamorro | 170 | 0.2% |
| Guatemalan | 759 | 0.7% |
| Haitian | 52 | 0.1% |
| Honduran | 180 | 0.2% |
| Hungarian | 76 | 0.1% |
| Icelander | 20 | 0.0% |
| Indian (Asian) | 229 | 0.2% |
| Indonesian | 217 | 0.2% |
| Inupiat | 3 | 0.0% |
| Iranian | 131 | 0.1% |
| Irish | 8,015 | 7.4% |
| Italian | 3,088 | 2.9% |
| Japanese | 108 | 0.1% |
| Kenyan | 217 | 0.2% |
| Korean | 396 | 0.4% |
| Lebanese | 132 | 0.1% |
| Lithuanian | 82 | 0.1% |
| Luxembourger | 21 | 0.0% |
| Macedonian | 7 | 0.0% |
| Malaysian | 18 | 0.0% |
| Marshallese | 15 | 0.0% |
| Mexican | 35,721 | 33.1% |
| Mexican American Indian | 353 | 0.3% |
| Mongolian | 10 | 0.0% |
| Moroccan | 27 | 0.0% |
| Native Hawaiian | 180 | 0.2% |
| Navajo | 464 | 0.4% |
| Nicaraguan | 42 | 0.0% |
| Nigerian | 12 | 0.0% |
| Northern European | 284 | 0.3% |
| Norwegian | 1,361 | 1.3% |
| Osage | 7 | 0.0% |
| Pakistani | 39 | 0.0% |
| Panamanian | 82 | 0.1% |
| Paraguayan | 8 | 0.0% |
| Pennsylvania German | 11 | 0.0% |
| Peruvian | 102 | 0.1% |
| Polish | 1,394 | 1.3% |
| Portuguese | 131 | 0.1% |
| Pueblo | 254 | 0.2% |
| Puerto Rican | 882 | 0.8% |
| Romanian | 56 | 0.1% |
| Russian | 1,156 | 1.1% |
| Salvadoran | 891 | 0.8% |
| Samoan | 51 | 0.1% |
| Scandinavian | 566 | 0.5% |
| Scotch-Irish | 871 | 0.8% |
| Scottish | 2,043 | 1.9% |
| Sierra Leonean | 15 | 0.0% |
| Sioux | 315 | 0.3% |
| Slavic | 28 | 0.0% |
| Slovak | 55 | 0.1% |
| Slovene | 46 | 0.0% |
| Somali | 244 | 0.2% |
| South American | 312 | 0.3% |
| Spaniard | 1,094 | 1.0% |
| Spanish | 462 | 0.4% |
| Spanish American | 18 | 0.0% |
| Spanish American Indian | 58 | 0.1% |
| Sri Lankan | 111 | 0.1% |
| Subsaharan African | 1,235 | 1.1% |
| Swedish | 1,842 | 1.7% |
| Swiss | 232 | 0.2% |
| Syrian | 32 | 0.0% |
| Thai | 133 | 0.1% |
| Tlingit-Haida | 7 | 0.0% |
| Tohono O'Odham | 42 | 0.0% |
| Tongan | 20 | 0.0% |
| Turkish | 29 | 0.0% |
| Ugandan | 8 | 0.0% |
| Ukrainian | 24 | 0.0% |
| Ute | 39 | 0.0% |
| Venezuelan | 83 | 0.1% |
| Welsh | 676 | 0.6% |
| West Indian | 7 | 0.0% |
| Yaqui | 99 | 0.1% |
| Yugoslavian | 20 | 0.0% |
| Yuman | 16 | 0.0% |
| Yup'ik | 19 | 0.0% | View All 128 Rows |
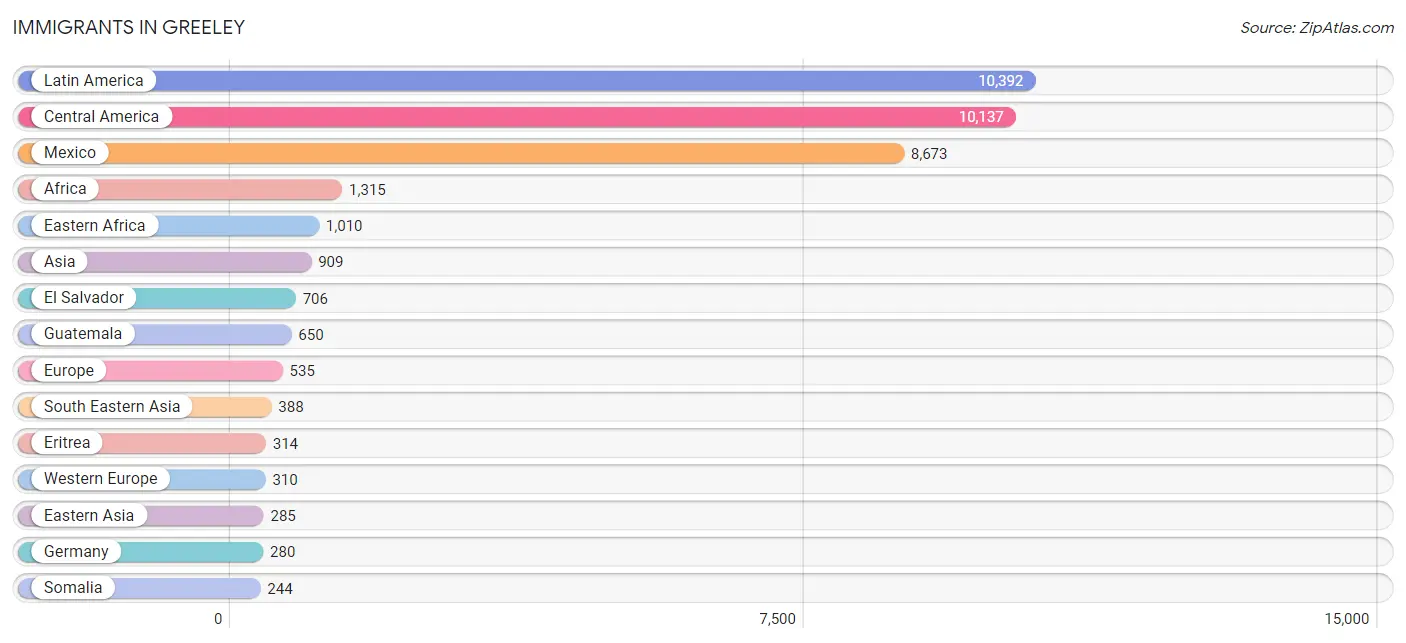
Immigrants in Greeley
The most numerous immigrant groups reported in Greeley came from Latin America (10,392 | 9.6%), Central America (10,137 | 9.4%), Mexico (8,673 | 8.0%), Africa (1,315 | 1.2%), and Eastern Africa (1,010 | 0.9%), together accounting for 29.2% of all Greeley residents.
| Immigration Origin | # Population | % Population |
| Africa | 1,315 | 1.2% |
| Argentina | 25 | 0.0% |
| Asia | 909 | 0.8% |
| Australia | 15 | 0.0% |
| Austria | 16 | 0.0% |
| Barbados | 9 | 0.0% |
| Belgium | 7 | 0.0% |
| Brazil | 11 | 0.0% |
| Cambodia | 23 | 0.0% |
| Canada | 86 | 0.1% |
| Caribbean | 36 | 0.0% |
| Central America | 10,137 | 9.4% |
| China | 113 | 0.1% |
| Colombia | 44 | 0.0% |
| Congo | 30 | 0.0% |
| Eastern Africa | 1,010 | 0.9% |
| Eastern Asia | 285 | 0.3% |
| Eastern Europe | 59 | 0.1% |
| Ecuador | 26 | 0.0% |
| El Salvador | 706 | 0.6% |
| England | 91 | 0.1% |
| Eritrea | 314 | 0.3% |
| Ethiopia | 94 | 0.1% |
| Europe | 535 | 0.5% |
| Germany | 280 | 0.3% |
| Guatemala | 650 | 0.6% |
| Haiti | 27 | 0.0% |
| Honduras | 97 | 0.1% |
| India | 19 | 0.0% |
| Iraq | 55 | 0.1% |
| Ireland | 23 | 0.0% |
| Israel | 9 | 0.0% |
| Japan | 31 | 0.0% |
| Kenya | 217 | 0.2% |
| Korea | 141 | 0.1% |
| Kuwait | 44 | 0.0% |
| Laos | 6 | 0.0% |
| Latin America | 10,392 | 9.6% |
| Mexico | 8,673 | 8.0% |
| Middle Africa | 53 | 0.1% |
| Morocco | 27 | 0.0% |
| Nepal | 44 | 0.0% |
| Nicaragua | 11 | 0.0% |
| Nigeria | 55 | 0.1% |
| Northern Africa | 27 | 0.0% |
| Northern Europe | 156 | 0.1% |
| Oceania | 15 | 0.0% |
| Peru | 10 | 0.0% |
| Philippines | 103 | 0.1% |
| Poland | 18 | 0.0% |
| Romania | 11 | 0.0% |
| Russia | 27 | 0.0% |
| Scotland | 4 | 0.0% |
| Somalia | 244 | 0.2% |
| South Africa | 15 | 0.0% |
| South America | 219 | 0.2% |
| South Central Asia | 102 | 0.1% |
| South Eastern Asia | 388 | 0.4% |
| Sweden | 16 | 0.0% |
| Switzerland | 7 | 0.0% |
| Syria | 15 | 0.0% |
| Taiwan | 29 | 0.0% |
| Thailand | 22 | 0.0% |
| Turkey | 11 | 0.0% |
| Ukraine | 3 | 0.0% |
| Venezuela | 95 | 0.1% |
| Vietnam | 26 | 0.0% |
| Western Africa | 202 | 0.2% |
| Western Asia | 134 | 0.1% |
| Western Europe | 310 | 0.3% |
| Zimbabwe | 13 | 0.0% | View All 71 Rows |
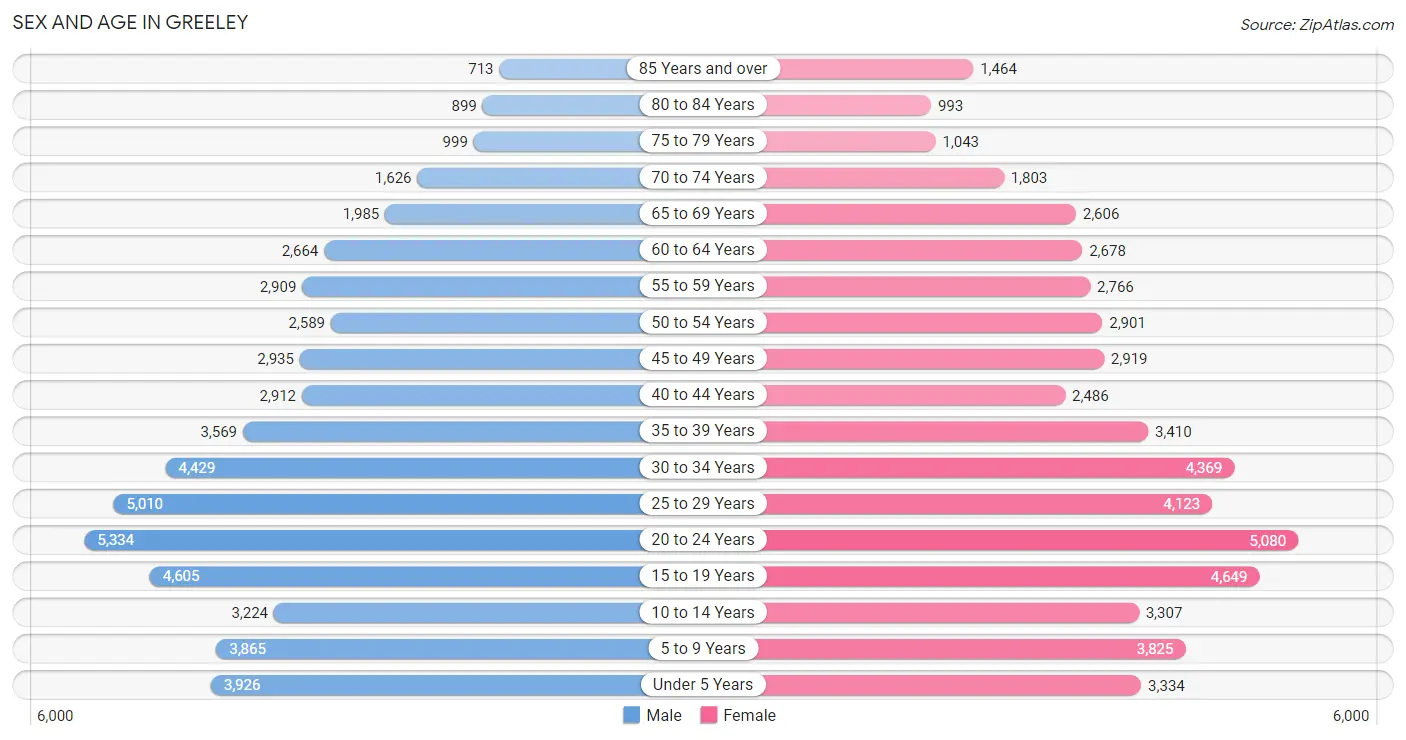
Sex and Age in Greeley
Sex and Age in Greeley
The most populous age groups in Greeley are 20 to 24 Years (5,334 | 9.8%) for men and 20 to 24 Years (5,080 | 9.5%) for women.
| Age Bracket | Male | Female |
| Under 5 Years | 3,926 (7.2%) | 3,334 (6.2%) |
| 5 to 9 Years | 3,865 (7.1%) | 3,825 (7.1%) |
| 10 to 14 Years | 3,224 (5.9%) | 3,307 (6.1%) |
| 15 to 19 Years | 4,605 (8.5%) | 4,649 (8.6%) |
| 20 to 24 Years | 5,334 (9.8%) | 5,080 (9.5%) |
| 25 to 29 Years | 5,010 (9.2%) | 4,123 (7.7%) |
| 30 to 34 Years | 4,429 (8.2%) | 4,369 (8.1%) |
| 35 to 39 Years | 3,569 (6.6%) | 3,410 (6.3%) |
| 40 to 44 Years | 2,912 (5.4%) | 2,486 (4.6%) |
| 45 to 49 Years | 2,935 (5.4%) | 2,919 (5.4%) |
| 50 to 54 Years | 2,589 (4.8%) | 2,901 (5.4%) |
| 55 to 59 Years | 2,909 (5.4%) | 2,766 (5.1%) |
| 60 to 64 Years | 2,664 (4.9%) | 2,678 (5.0%) |
| 65 to 69 Years | 1,985 (3.7%) | 2,606 (4.9%) |
| 70 to 74 Years | 1,626 (3.0%) | 1,803 (3.4%) |
| 75 to 79 Years | 999 (1.8%) | 1,043 (1.9%) |
| 80 to 84 Years | 899 (1.7%) | 993 (1.8%) |
| 85 Years and over | 713 (1.3%) | 1,464 (2.7%) |
| Total | 54,193 (100.0%) | 53,756 (100.0%) |
Families and Households in Greeley
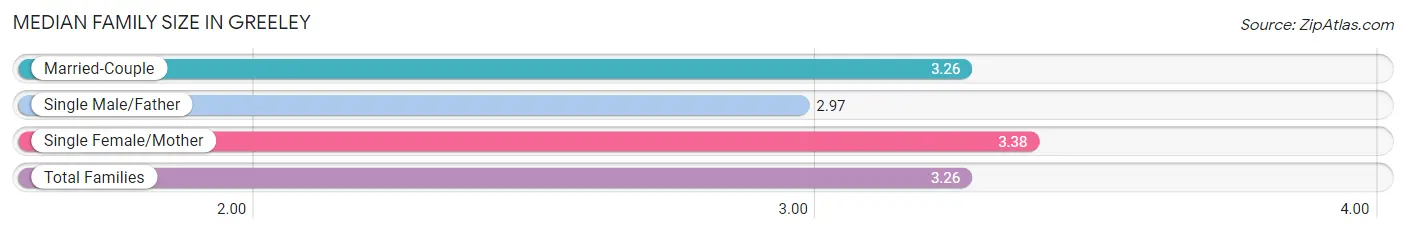
Median Family Size in Greeley
The median family size in Greeley is 3.26 persons per family, with single female/mother families (4,815 | 19.3%) accounting for the largest median family size of 3.38 persons per family. On the other hand, single male/father families (1,923 | 7.7%) represent the smallest median family size with 2.97 persons per family.
| Family Type | # Families | Family Size |
| Married-Couple | 18,159 (72.9%) | 3.26 |
| Single Male/Father | 1,923 (7.7%) | 2.97 |
| Single Female/Mother | 4,815 (19.3%) | 3.38 |
| Total Families | 24,897 (100.0%) | 3.26 |
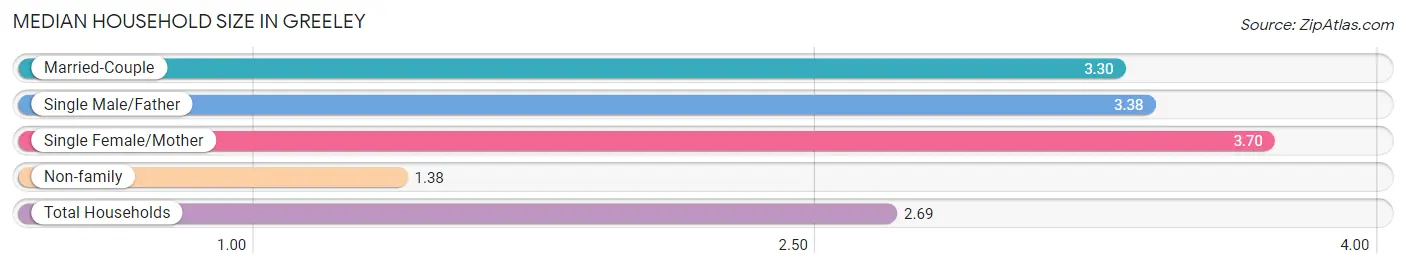
Median Household Size in Greeley
The median household size in Greeley is 2.69 persons per household, with single female/mother households (4,815 | 12.7%) accounting for the largest median household size of 3.7 persons per household. non-family households (13,109 | 34.5%) represent the smallest median household size with 1.38 persons per household.
| Household Type | # Households | Household Size |
| Married-Couple | 18,159 (47.8%) | 3.30 |
| Single Male/Father | 1,923 (5.1%) | 3.38 |
| Single Female/Mother | 4,815 (12.7%) | 3.70 |
| Non-family | 13,109 (34.5%) | 1.38 |
| Total Households | 38,006 (100.0%) | 2.69 |
Household Size by Marriage Status in Greeley
Out of a total of 38,006 households in Greeley, 24,897 (65.5%) are family households, while 13,109 (34.5%) are nonfamily households. The most numerous type of family households are 2-person households, comprising 10,042, and the most common type of nonfamily households are 1-person households, comprising 10,242.
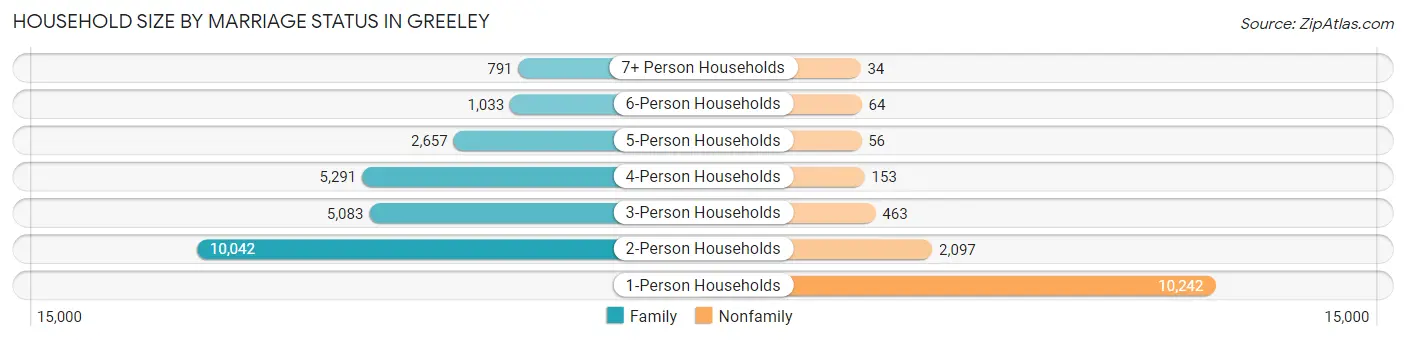
| Household Size | Family Households | Nonfamily Households |
| 1-Person Households | - | 10,242 (27.0%) |
| 2-Person Households | 10,042 (26.4%) | 2,097 (5.5%) |
| 3-Person Households | 5,083 (13.4%) | 463 (1.2%) |
| 4-Person Households | 5,291 (13.9%) | 153 (0.4%) |
| 5-Person Households | 2,657 (7.0%) | 56 (0.2%) |
| 6-Person Households | 1,033 (2.7%) | 64 (0.2%) |
| 7+ Person Households | 791 (2.1%) | 34 (0.1%) |
| Total | 24,897 (65.5%) | 13,109 (34.5%) |
Female Fertility in Greeley
Fertility by Age in Greeley
Average fertility rate in Greeley is 54.0 births per 1,000 women. Women in the age bracket of 20 to 34 years have the highest fertility rate with 94.0 births per 1,000 women. Women in the age bracket of 20 to 34 years acount for 85.2% of all women with births.
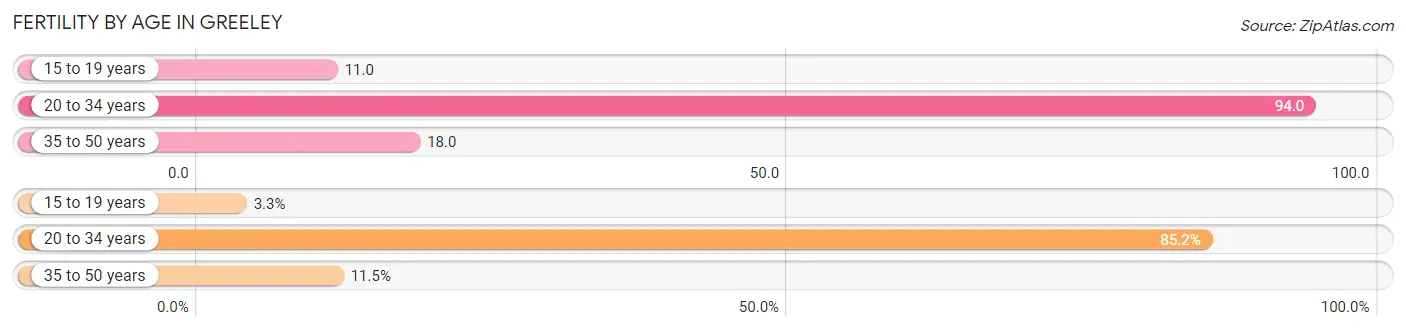
| Age Bracket | Women with Births | Births / 1,000 Women |
| 15 to 19 years | 49 (3.3%) | 11.0 |
| 20 to 34 years | 1,274 (85.2%) | 94.0 |
| 35 to 50 years | 172 (11.5%) | 18.0 |
| Total | 1,495 (100.0%) | 54.0 |
Fertility by Age by Marriage Status in Greeley
65.7% of women with births (1,495) in Greeley are married. The highest percentage of unmarried women with births falls into 15 to 19 years age bracket with 95.9% of them unmarried at the time of birth, while the lowest percentage of unmarried women with births belong to 35 to 50 years age bracket with 0.0% of them unmarried.
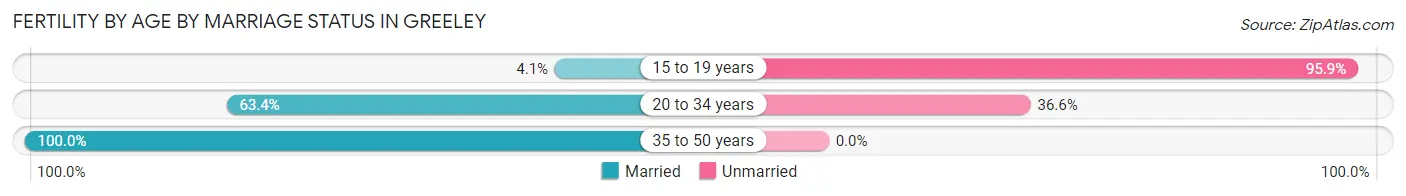
| Age Bracket | Married | Unmarried |
| 15 to 19 years | 2 (4.1%) | 47 (95.9%) |
| 20 to 34 years | 808 (63.4%) | 466 (36.6%) |
| 35 to 50 years | 172 (100.0%) | 0 (0.0%) |
| Total | 982 (65.7%) | 513 (34.3%) |
Fertility by Education in Greeley
Average fertility rate in Greeley is 54.0 births per 1,000 women. Women with the education attainment of high school diploma have the highest fertility rate of 79.0 births per 1,000 women, while women with the education attainment of less than high school have the lowest fertility at 42.0 births per 1,000 women. Women with the education attainment of high school diploma represent 36.0% of all women with births.
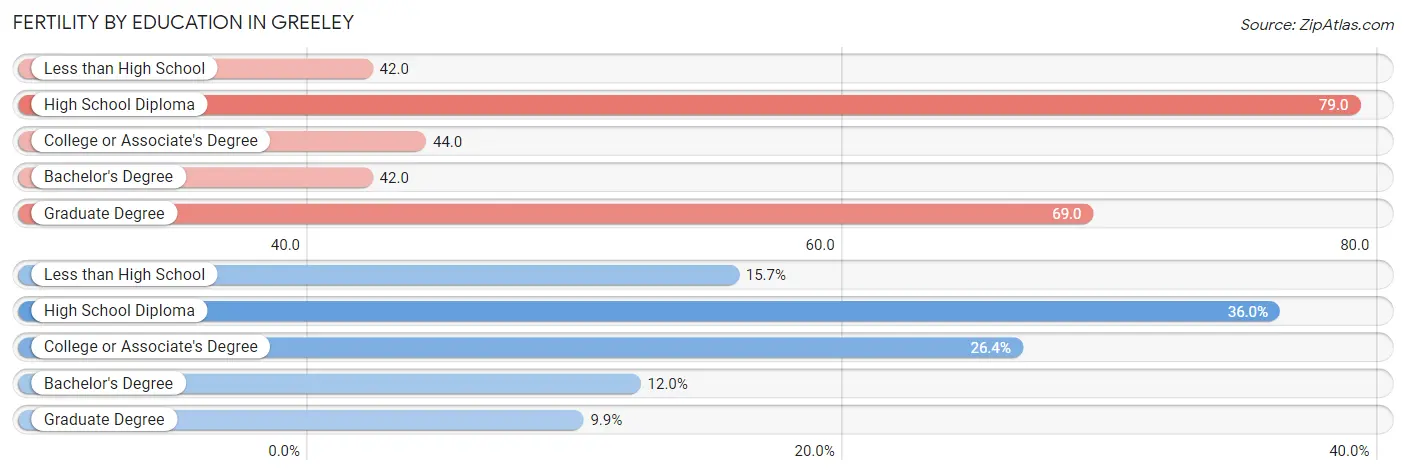
| Educational Attainment | Women with Births | Births / 1,000 Women |
| Less than High School | 235 (15.7%) | 42.0 |
| High School Diploma | 538 (36.0%) | 79.0 |
| College or Associate's Degree | 394 (26.4%) | 44.0 |
| Bachelor's Degree | 180 (12.0%) | 42.0 |
| Graduate Degree | 148 (9.9%) | 69.0 |
| Total | 1,495 (100.0%) | 54.0 |
Fertility by Education by Marriage Status in Greeley
34.3% of women with births in Greeley are unmarried. Women with the educational attainment of graduate degree are most likely to be married with 85.1% of them married at childbirth, while women with the educational attainment of high school diploma are least likely to be married with 48.0% of them unmarried at childbirth.
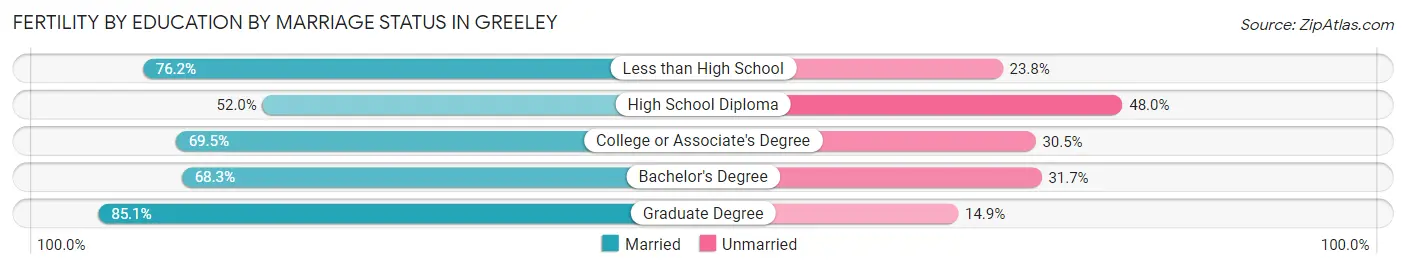
| Educational Attainment | Married | Unmarried |
| Less than High School | 179 (76.2%) | 56 (23.8%) |
| High School Diploma | 280 (52.0%) | 258 (48.0%) |
| College or Associate's Degree | 274 (69.5%) | 120 (30.5%) |
| Bachelor's Degree | 123 (68.3%) | 57 (31.7%) |
| Graduate Degree | 126 (85.1%) | 22 (14.9%) |
| Total | 982 (65.7%) | 513 (34.3%) |
Employment Characteristics in Greeley
Employment by Class of Employer in Greeley
Among the 51,073 employed individuals in Greeley, private company employees (35,432 | 69.4%), local government employees (3,810 | 7.5%), and not-for-profit organizations (3,808 | 7.5%) make up the most common classes of employment.
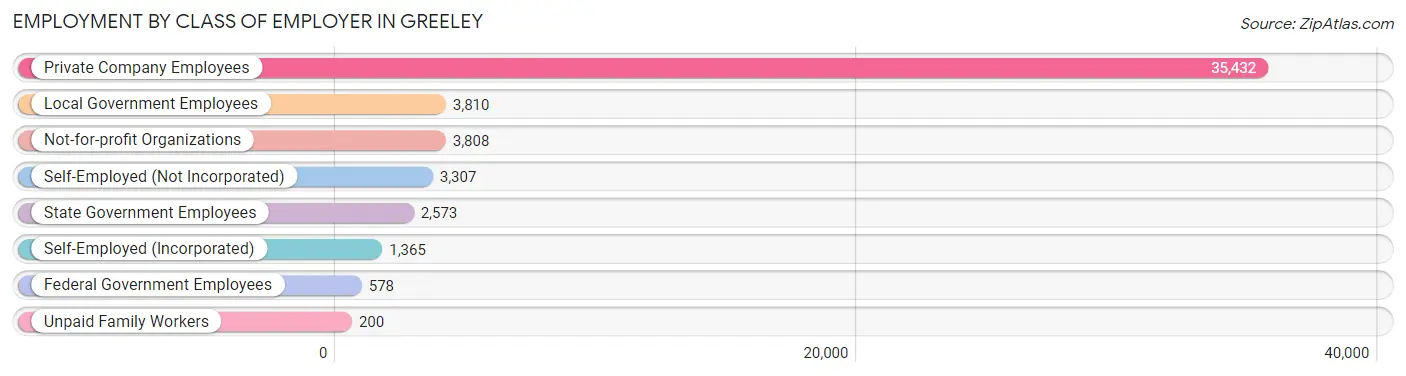
| Employer Class | # Employees | % Employees |
| Private Company Employees | 35,432 | 69.4% |
| Self-Employed (Incorporated) | 1,365 | 2.7% |
| Self-Employed (Not Incorporated) | 3,307 | 6.5% |
| Not-for-profit Organizations | 3,808 | 7.5% |
| Local Government Employees | 3,810 | 7.5% |
| State Government Employees | 2,573 | 5.0% |
| Federal Government Employees | 578 | 1.1% |
| Unpaid Family Workers | 200 | 0.4% |
| Total | 51,073 | 100.0% |
Employment Status by Age in Greeley
According to the labor force statistics for Greeley, out of the total population over 16 years of age (84,737), 65.2% or 55,249 individuals are in the labor force, with 5.6% or 3,094 of them unemployed. The age group with the highest labor force participation rate is 35 to 44 years, with 83.6% or 10,347 individuals in the labor force. Within the labor force, the 16 to 19 years age range has the highest percentage of unemployed individuals, with 22.2% or 688 of them being unemployed.
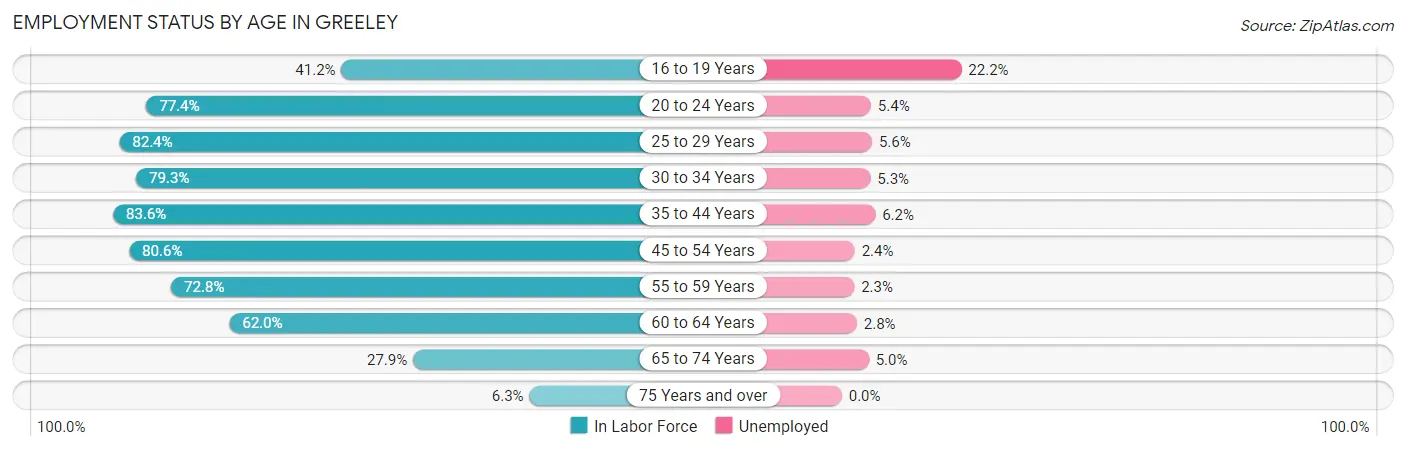
| Age Bracket | In Labor Force | Unemployed |
| 16 to 19 Years | 3,099 (41.2%) | 688 (22.2%) |
| 20 to 24 Years | 8,060 (77.4%) | 435 (5.4%) |
| 25 to 29 Years | 7,526 (82.4%) | 421 (5.6%) |
| 30 to 34 Years | 6,977 (79.3%) | 370 (5.3%) |
| 35 to 44 Years | 10,347 (83.6%) | 642 (6.2%) |
| 45 to 54 Years | 9,143 (80.6%) | 219 (2.4%) |
| 55 to 59 Years | 4,131 (72.8%) | 95 (2.3%) |
| 60 to 64 Years | 3,312 (62.0%) | 93 (2.8%) |
| 65 to 74 Years | 2,238 (27.9%) | 112 (5.0%) |
| 75 Years and over | 385 (6.3%) | 0 (0.0%) |
| Total | 55,249 (65.2%) | 3,094 (5.6%) |
Employment Status by Educational Attainment in Greeley
According to labor force statistics for Greeley, 78.6% of individuals (41,398) out of the total population between 25 and 64 years of age (52,669) are in the labor force, with 4.4% or 1,822 of them being unemployed. The group with the highest labor force participation rate are those with the educational attainment of bachelor's degree or higher, with 87.6% or 11,963 individuals in the labor force. Within the labor force, individuals with less than high school education have the highest percentage of unemployment, with 7.5% or 450 of them being unemployed.
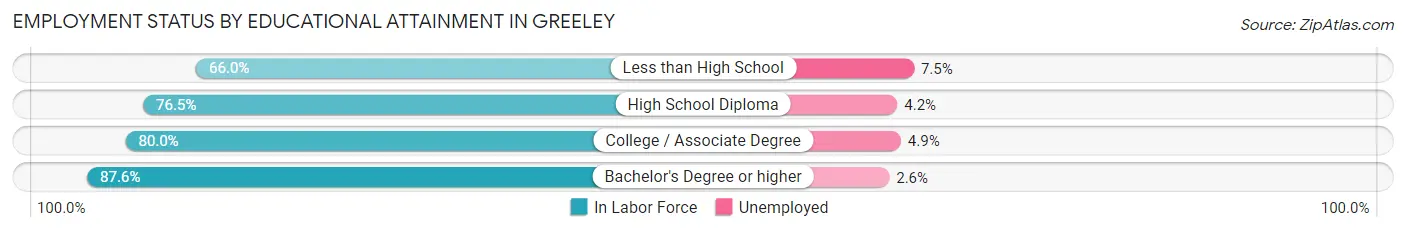
| Educational Attainment | In Labor Force | Unemployed |
| Less than High School | 6,000 (66.0%) | 682 (7.5%) |
| High School Diploma | 10,168 (76.5%) | 558 (4.2%) |
| College / Associate Degree | 13,305 (80.0%) | 815 (4.9%) |
| Bachelor's Degree or higher | 11,963 (87.6%) | 355 (2.6%) |
| Total | 41,398 (78.6%) | 2,317 (4.4%) |
Employment Occupations by Sex in Greeley
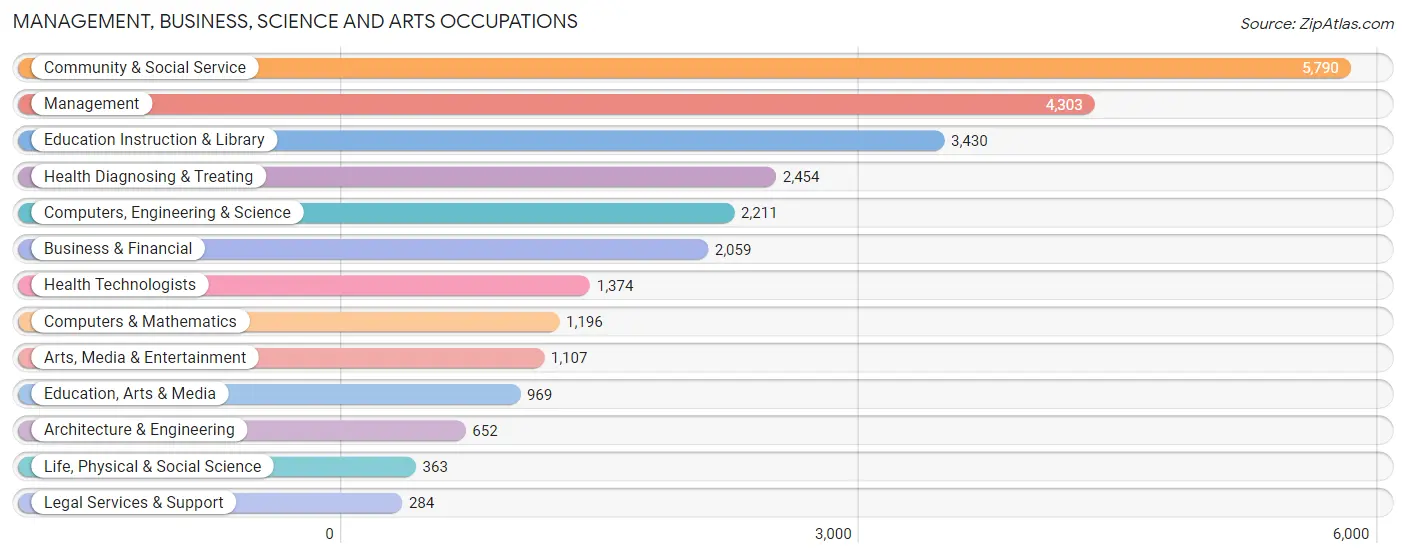
Management, Business, Science and Arts Occupations
The most common Management, Business, Science and Arts occupations in Greeley are Community & Social Service (5,790 | 11.1%), Management (4,303 | 8.3%), Education Instruction & Library (3,430 | 6.6%), Health Diagnosing & Treating (2,454 | 4.7%), and Computers, Engineering & Science (2,211 | 4.3%).
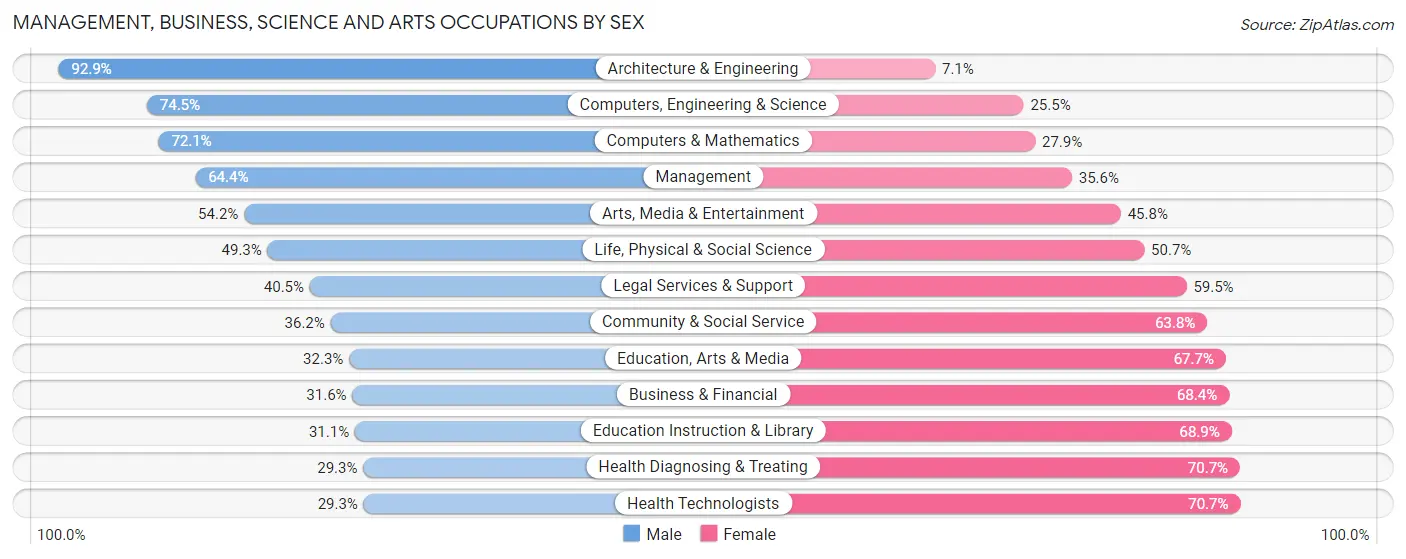
Management, Business, Science and Arts Occupations by Sex
Within the Management, Business, Science and Arts occupations in Greeley, the most male-oriented occupations are Architecture & Engineering (92.9%), Computers, Engineering & Science (74.5%), and Computers & Mathematics (72.1%), while the most female-oriented occupations are Health Technologists (70.7%), Health Diagnosing & Treating (70.7%), and Education Instruction & Library (68.9%).
| Occupation | Male | Female |
| Management | 2,771 (64.4%) | 1,532 (35.6%) |
| Business & Financial | 651 (31.6%) | 1,408 (68.4%) |
| Computers, Engineering & Science | 1,647 (74.5%) | 564 (25.5%) |
| Computers & Mathematics | 862 (72.1%) | 334 (27.9%) |
| Architecture & Engineering | 606 (92.9%) | 46 (7.1%) |
| Life, Physical & Social Science | 179 (49.3%) | 184 (50.7%) |
| Community & Social Service | 2,094 (36.2%) | 3,696 (63.8%) |
| Education, Arts & Media | 313 (32.3%) | 656 (67.7%) |
| Legal Services & Support | 115 (40.5%) | 169 (59.5%) |
| Education Instruction & Library | 1,066 (31.1%) | 2,364 (68.9%) |
| Arts, Media & Entertainment | 600 (54.2%) | 507 (45.8%) |
| Health Diagnosing & Treating | 720 (29.3%) | 1,734 (70.7%) |
| Health Technologists | 402 (29.3%) | 972 (70.7%) |
| Total (Category) | 7,883 (46.9%) | 8,934 (53.1%) |
| Total (Overall) | 28,726 (55.2%) | 23,302 (44.8%) |
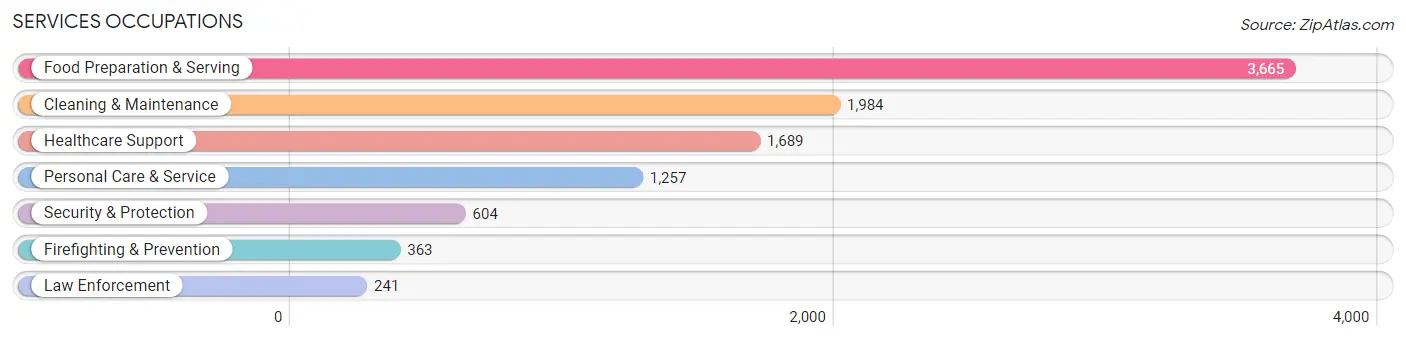
Services Occupations
The most common Services occupations in Greeley are Food Preparation & Serving (3,665 | 7.0%), Cleaning & Maintenance (1,984 | 3.8%), Healthcare Support (1,689 | 3.3%), Personal Care & Service (1,257 | 2.4%), and Security & Protection (604 | 1.2%).
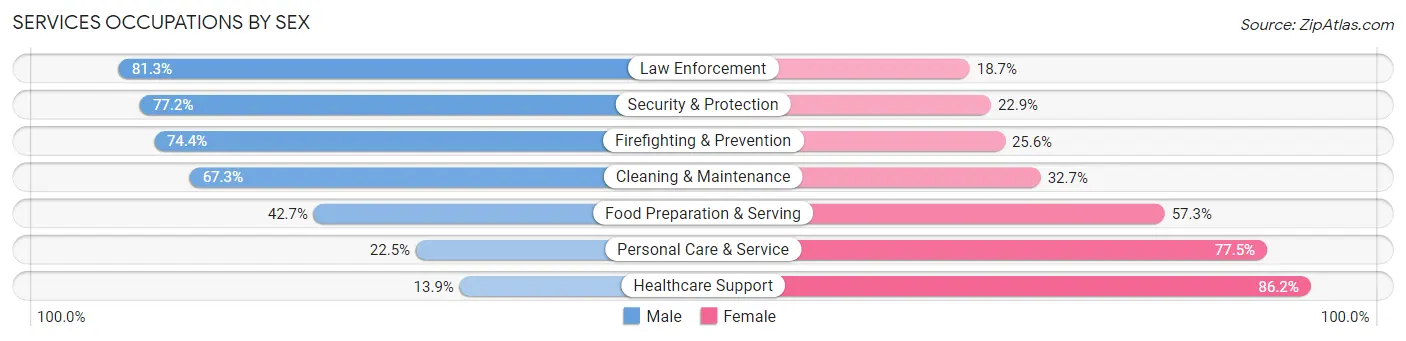
Services Occupations by Sex
Within the Services occupations in Greeley, the most male-oriented occupations are Law Enforcement (81.3%), Security & Protection (77.1%), and Firefighting & Prevention (74.4%), while the most female-oriented occupations are Healthcare Support (86.2%), Personal Care & Service (77.5%), and Food Preparation & Serving (57.3%).
| Occupation | Male | Female |
| Healthcare Support | 234 (13.9%) | 1,455 (86.2%) |
| Security & Protection | 466 (77.1%) | 138 (22.9%) |
| Firefighting & Prevention | 270 (74.4%) | 93 (25.6%) |
| Law Enforcement | 196 (81.3%) | 45 (18.7%) |
| Food Preparation & Serving | 1,566 (42.7%) | 2,099 (57.3%) |
| Cleaning & Maintenance | 1,335 (67.3%) | 649 (32.7%) |
| Personal Care & Service | 283 (22.5%) | 974 (77.5%) |
| Total (Category) | 3,884 (42.2%) | 5,315 (57.8%) |
| Total (Overall) | 28,726 (55.2%) | 23,302 (44.8%) |
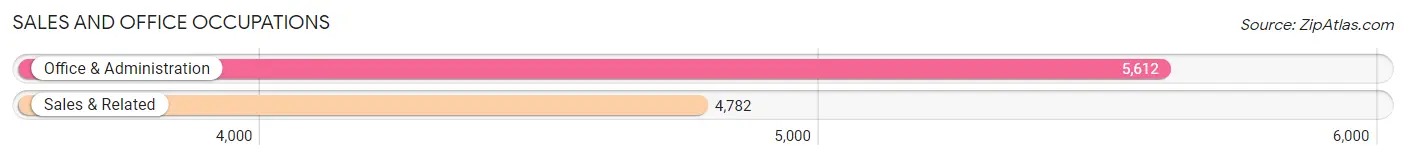
Sales and Office Occupations
The most common Sales and Office occupations in Greeley are Office & Administration (5,612 | 10.8%), and Sales & Related (4,782 | 9.2%).
Sales and Office Occupations by Sex
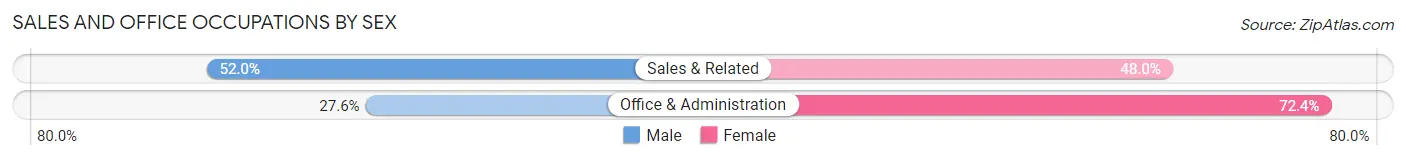
| Occupation | Male | Female |
| Sales & Related | 2,486 (52.0%) | 2,296 (48.0%) |
| Office & Administration | 1,547 (27.6%) | 4,065 (72.4%) |
| Total (Category) | 4,033 (38.8%) | 6,361 (61.2%) |
| Total (Overall) | 28,726 (55.2%) | 23,302 (44.8%) |
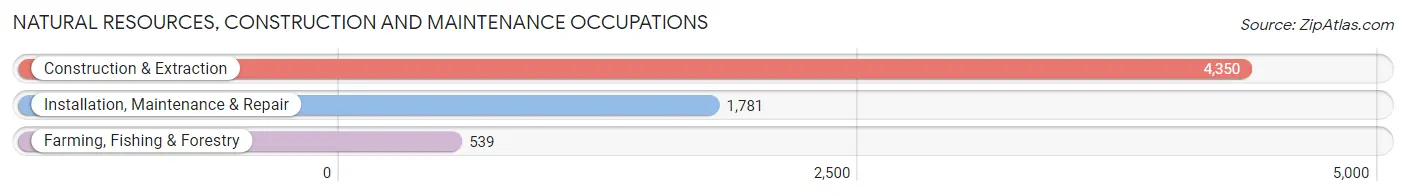
Natural Resources, Construction and Maintenance Occupations
The most common Natural Resources, Construction and Maintenance occupations in Greeley are Construction & Extraction (4,350 | 8.4%), Installation, Maintenance & Repair (1,781 | 3.4%), and Farming, Fishing & Forestry (539 | 1.0%).
Natural Resources, Construction and Maintenance Occupations by Sex
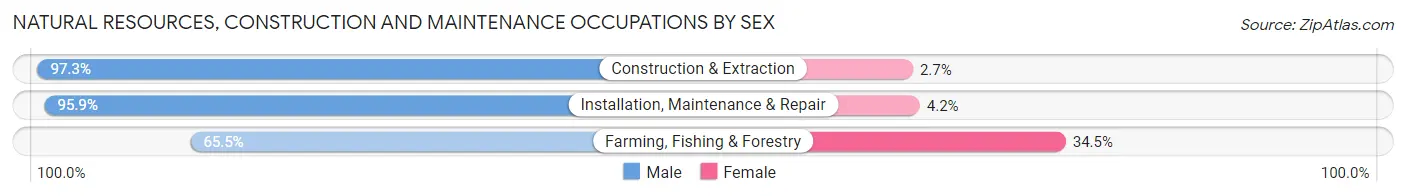
| Occupation | Male | Female |
| Farming, Fishing & Forestry | 353 (65.5%) | 186 (34.5%) |
| Construction & Extraction | 4,232 (97.3%) | 118 (2.7%) |
| Installation, Maintenance & Repair | 1,707 (95.9%) | 74 (4.2%) |
| Total (Category) | 6,292 (94.3%) | 378 (5.7%) |
| Total (Overall) | 28,726 (55.2%) | 23,302 (44.8%) |
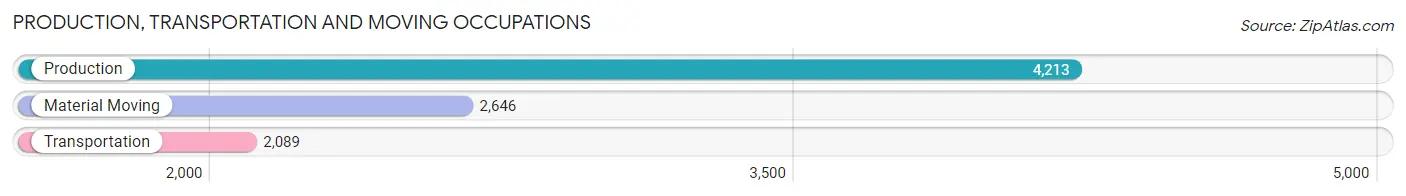
Production, Transportation and Moving Occupations
The most common Production, Transportation and Moving occupations in Greeley are Production (4,213 | 8.1%), Material Moving (2,646 | 5.1%), and Transportation (2,089 | 4.0%).
Production, Transportation and Moving Occupations by Sex
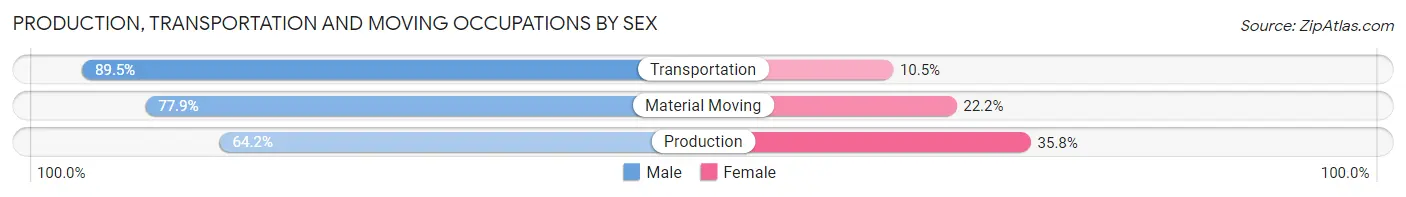
| Occupation | Male | Female |
| Production | 2,705 (64.2%) | 1,508 (35.8%) |
| Transportation | 1,869 (89.5%) | 220 (10.5%) |
| Material Moving | 2,060 (77.8%) | 586 (22.2%) |
| Total (Category) | 6,634 (74.1%) | 2,314 (25.9%) |
| Total (Overall) | 28,726 (55.2%) | 23,302 (44.8%) |
Employment Industries by Sex in Greeley
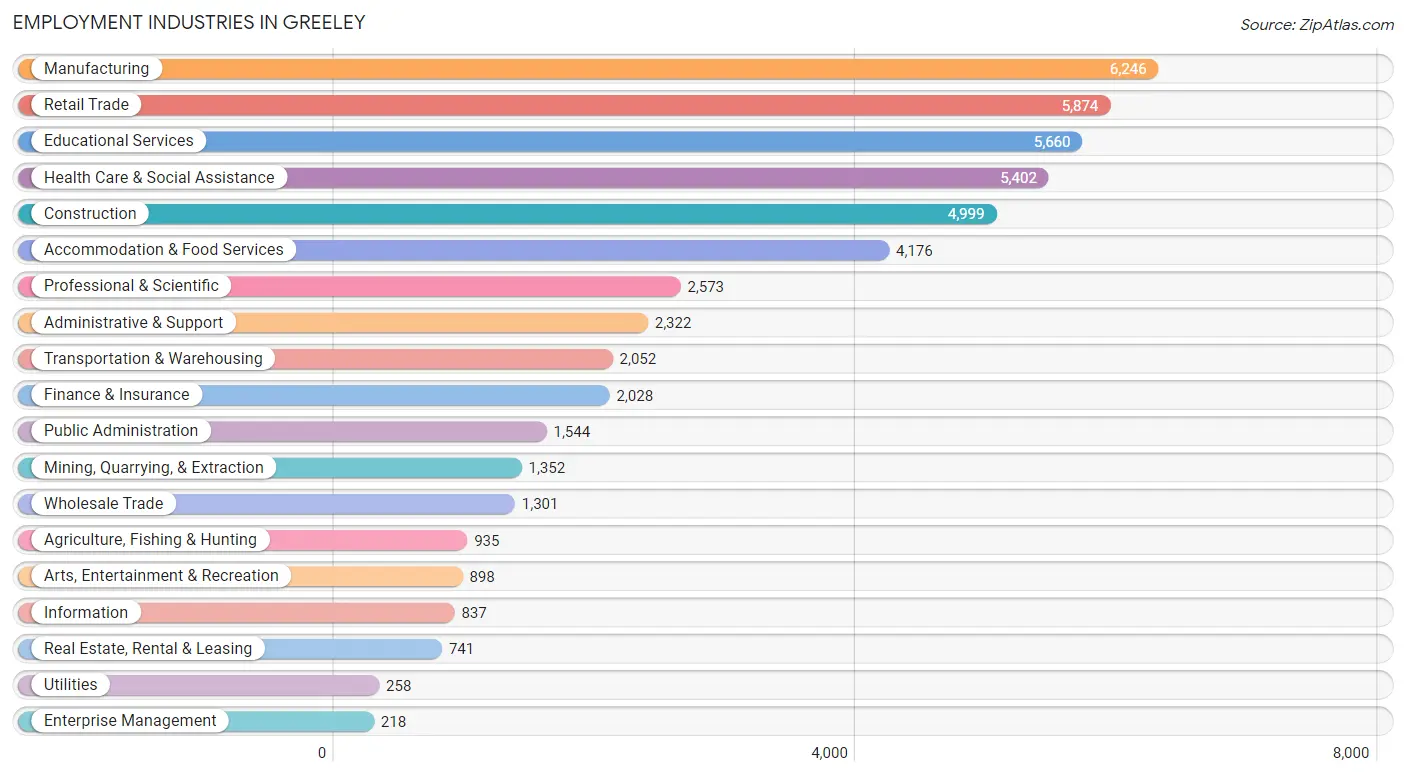
Employment Industries in Greeley
The major employment industries in Greeley include Manufacturing (6,246 | 12.0%), Retail Trade (5,874 | 11.3%), Educational Services (5,660 | 10.9%), Health Care & Social Assistance (5,402 | 10.4%), and Construction (4,999 | 9.6%).
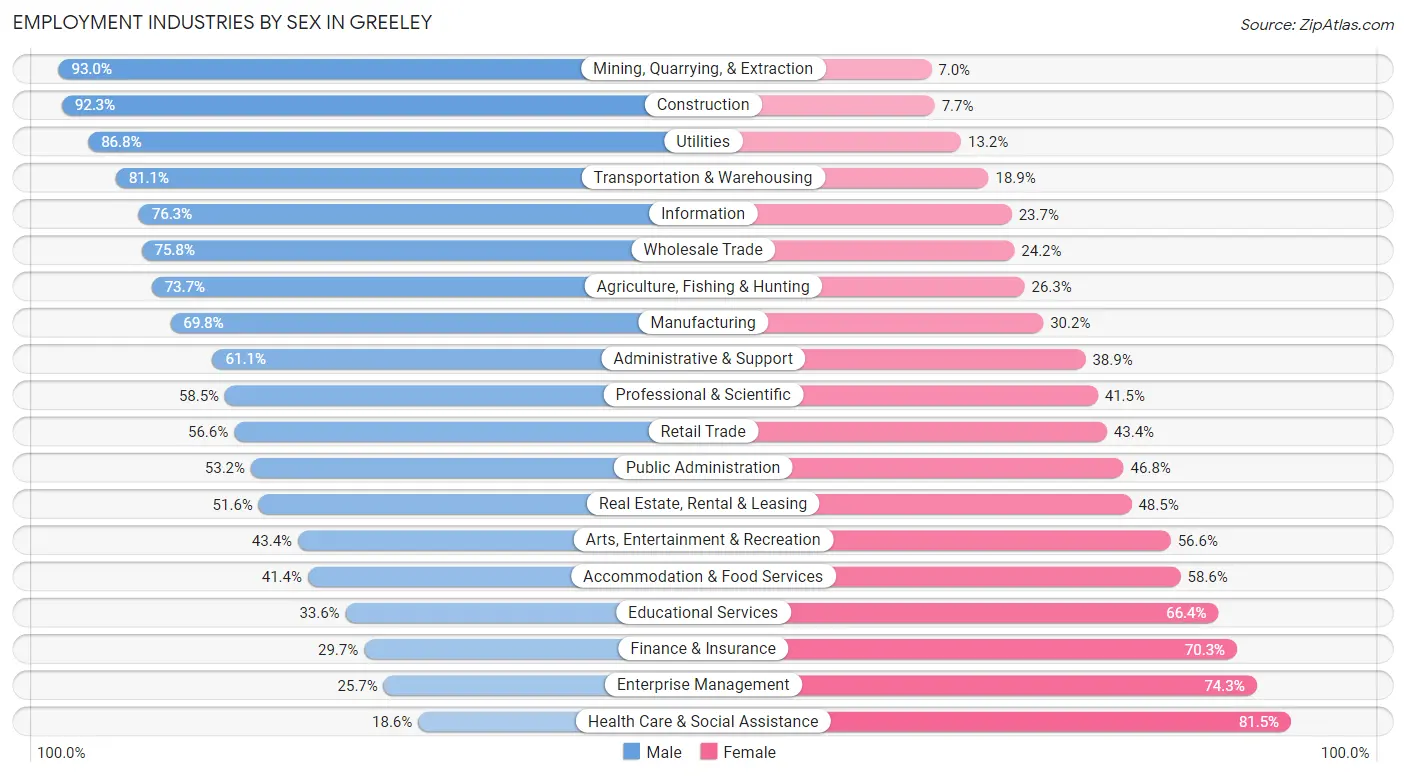
Employment Industries by Sex in Greeley
The Greeley industries that see more men than women are Mining, Quarrying, & Extraction (93.0%), Construction (92.3%), and Utilities (86.8%), whereas the industries that tend to have a higher number of women are Health Care & Social Assistance (81.5%), Enterprise Management (74.3%), and Finance & Insurance (70.3%).
| Industry | Male | Female |
| Agriculture, Fishing & Hunting | 689 (73.7%) | 246 (26.3%) |
| Mining, Quarrying, & Extraction | 1,257 (93.0%) | 95 (7.0%) |
| Construction | 4,613 (92.3%) | 386 (7.7%) |
| Manufacturing | 4,361 (69.8%) | 1,885 (30.2%) |
| Wholesale Trade | 986 (75.8%) | 315 (24.2%) |
| Retail Trade | 3,327 (56.6%) | 2,547 (43.4%) |
| Transportation & Warehousing | 1,665 (81.1%) | 387 (18.9%) |
| Utilities | 224 (86.8%) | 34 (13.2%) |
| Information | 639 (76.3%) | 198 (23.7%) |
| Finance & Insurance | 603 (29.7%) | 1,425 (70.3%) |
| Real Estate, Rental & Leasing | 382 (51.5%) | 359 (48.4%) |
| Professional & Scientific | 1,506 (58.5%) | 1,067 (41.5%) |
| Enterprise Management | 56 (25.7%) | 162 (74.3%) |
| Administrative & Support | 1,418 (61.1%) | 904 (38.9%) |
| Educational Services | 1,901 (33.6%) | 3,759 (66.4%) |
| Health Care & Social Assistance | 1,002 (18.5%) | 4,400 (81.5%) |
| Arts, Entertainment & Recreation | 390 (43.4%) | 508 (56.6%) |
| Accommodation & Food Services | 1,728 (41.4%) | 2,448 (58.6%) |
| Public Administration | 821 (53.2%) | 723 (46.8%) |
| Total | 28,726 (55.2%) | 23,302 (44.8%) |
Education in Greeley
School Enrollment in Greeley
The most common levels of schooling among the 31,179 students in Greeley are college / undergraduate (9,353 | 30.0%), elementary school (6,422 | 20.6%), and high school (5,817 | 18.7%).
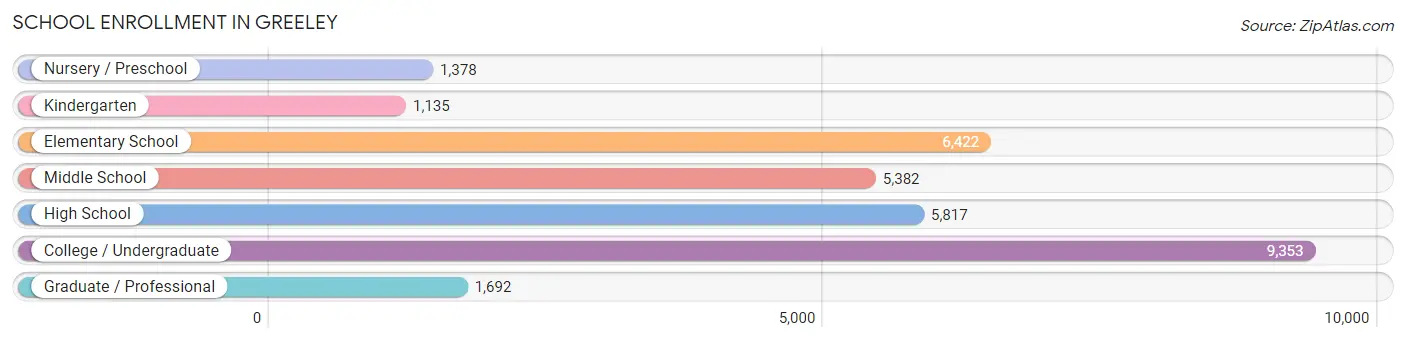
| School Level | # Students | % Students |
| Nursery / Preschool | 1,378 | 4.4% |
| Kindergarten | 1,135 | 3.6% |
| Elementary School | 6,422 | 20.6% |
| Middle School | 5,382 | 17.3% |
| High School | 5,817 | 18.7% |
| College / Undergraduate | 9,353 | 30.0% |
| Graduate / Professional | 1,692 | 5.4% |
| Total | 31,179 | 100.0% |
School Enrollment by Age by Funding Source in Greeley
Out of a total of 31,179 students who are enrolled in schools in Greeley, 2,463 (7.9%) attend a private institution, while the remaining 28,716 (92.1%) are enrolled in public schools. The age group of 3 to 4 year olds has the highest likelihood of being enrolled in private schools, with 249 (25.1% in the age bracket) enrolled. Conversely, the age group of 18 to 19 year olds has the lowest likelihood of being enrolled in a private school, with 3,778 (96.9% in the age bracket) attending a public institution.
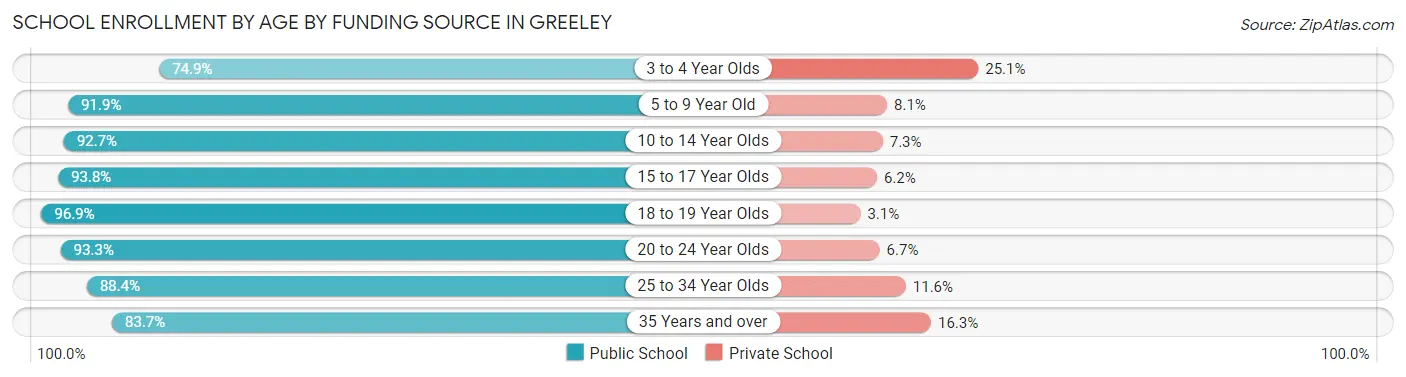
| Age Bracket | Public School | Private School |
| 3 to 4 Year Olds | 744 (74.9%) | 249 (25.1%) |
| 5 to 9 Year Old | 6,706 (91.9%) | 590 (8.1%) |
| 10 to 14 Year Olds | 5,952 (92.7%) | 468 (7.3%) |
| 15 to 17 Year Olds | 4,205 (93.8%) | 279 (6.2%) |
| 18 to 19 Year Olds | 3,778 (96.9%) | 122 (3.1%) |
| 20 to 24 Year Olds | 4,459 (93.3%) | 320 (6.7%) |
| 25 to 34 Year Olds | 1,848 (88.4%) | 242 (11.6%) |
| 35 Years and over | 1,019 (83.7%) | 198 (16.3%) |
| Total | 28,716 (92.1%) | 2,463 (7.9%) |
Educational Attainment by Field of Study in Greeley
Business (3,060 | 15.2%), education (3,047 | 15.2%), science & technology (1,845 | 9.2%), arts & humanities (1,807 | 9.0%), and bio, nature & agricultural (1,578 | 7.9%) are the most common fields of study among 20,073 individuals in Greeley who have obtained a bachelor's degree or higher.
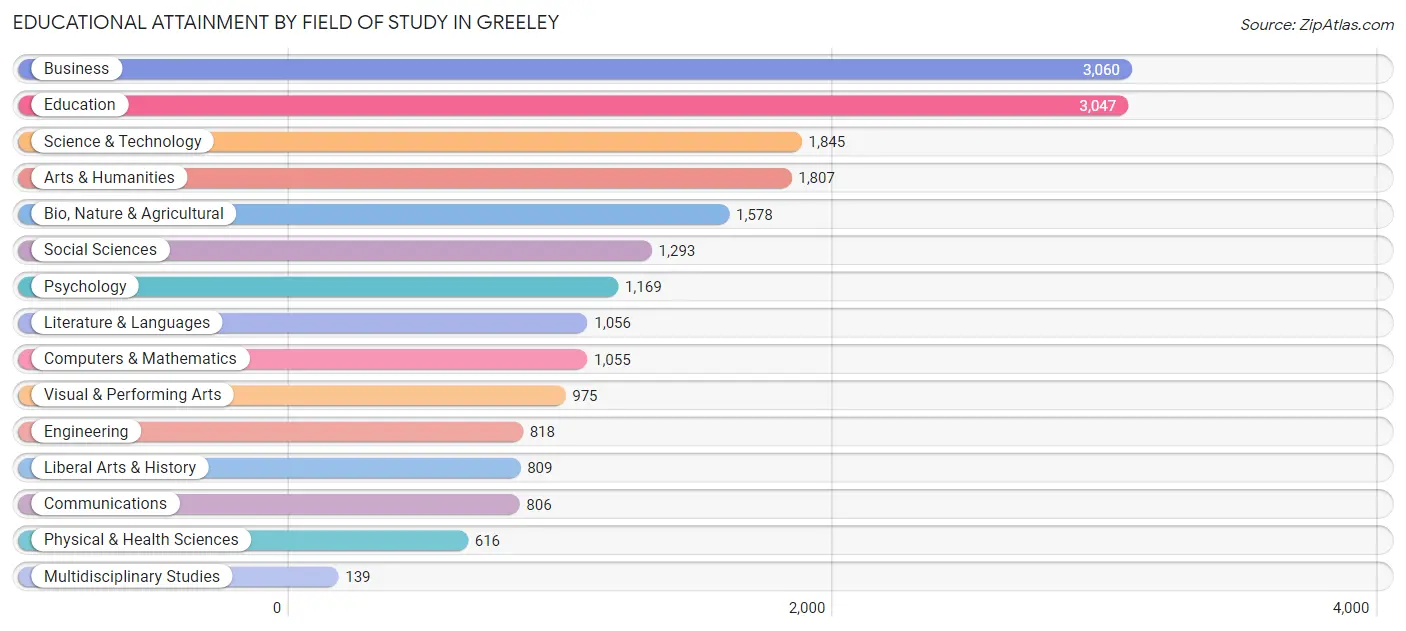
| Field of Study | # Graduates | % Graduates |
| Computers & Mathematics | 1,055 | 5.3% |
| Bio, Nature & Agricultural | 1,578 | 7.9% |
| Physical & Health Sciences | 616 | 3.1% |
| Psychology | 1,169 | 5.8% |
| Social Sciences | 1,293 | 6.4% |
| Engineering | 818 | 4.1% |
| Multidisciplinary Studies | 139 | 0.7% |
| Science & Technology | 1,845 | 9.2% |
| Business | 3,060 | 15.2% |
| Education | 3,047 | 15.2% |
| Literature & Languages | 1,056 | 5.3% |
| Liberal Arts & History | 809 | 4.0% |
| Visual & Performing Arts | 975 | 4.9% |
| Communications | 806 | 4.0% |
| Arts & Humanities | 1,807 | 9.0% |
| Total | 20,073 | 100.0% |
Transportation & Commute in Greeley
Vehicle Availability by Sex in Greeley
The most prevalent vehicle ownership categories in Greeley are males with 2 vehicles (11,305, accounting for 40.8%) and females with 2 vehicles (8,669, making up 51.9%).
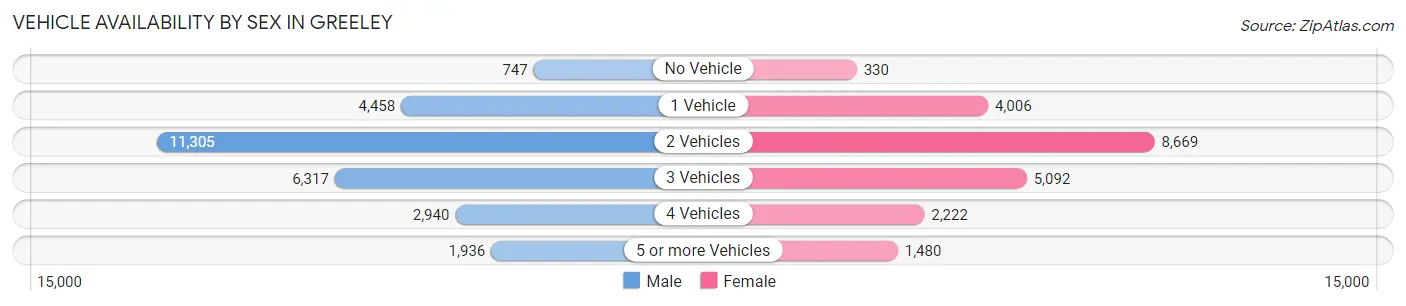
| Vehicles Available | Male | Female |
| No Vehicle | 747 (2.7%) | 330 (1.5%) |
| 1 Vehicle | 4,458 (16.1%) | 4,006 (18.4%) |
| 2 Vehicles | 11,305 (40.8%) | 8,669 (39.8%) |
| 3 Vehicles | 6,317 (22.8%) | 5,092 (23.4%) |
| 4 Vehicles | 2,940 (10.6%) | 2,222 (10.2%) |
| 5 or more Vehicles | 1,936 (7.0%) | 1,480 (6.8%) |
| Total | 27,703 (100.0%) | 21,799 (100.0%) |
Commute Time in Greeley
The most frequently occuring commute durations in Greeley are 10 to 14 minutes (9,878 commuters, 20.9%), 15 to 19 minutes (7,859 commuters, 16.6%), and 5 to 9 minutes (6,506 commuters, 13.8%).
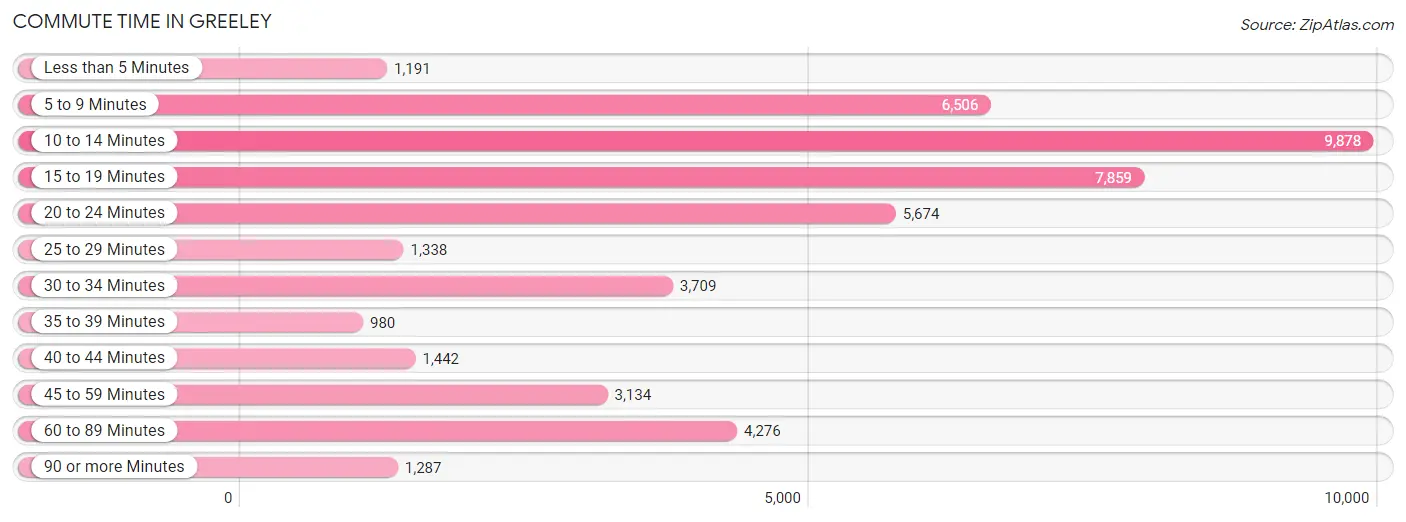
| Commute Time | # Commuters | % Commuters |
| Less than 5 Minutes | 1,191 | 2.5% |
| 5 to 9 Minutes | 6,506 | 13.8% |
| 10 to 14 Minutes | 9,878 | 20.9% |
| 15 to 19 Minutes | 7,859 | 16.6% |
| 20 to 24 Minutes | 5,674 | 12.0% |
| 25 to 29 Minutes | 1,338 | 2.8% |
| 30 to 34 Minutes | 3,709 | 7.9% |
| 35 to 39 Minutes | 980 | 2.1% |
| 40 to 44 Minutes | 1,442 | 3.0% |
| 45 to 59 Minutes | 3,134 | 6.6% |
| 60 to 89 Minutes | 4,276 | 9.0% |
| 90 or more Minutes | 1,287 | 2.7% |
Commute Time by Sex in Greeley
The most common commute times in Greeley are 10 to 14 minutes (4,984 commuters, 18.8%) for males and 10 to 14 minutes (4,894 commuters, 23.6%) for females.
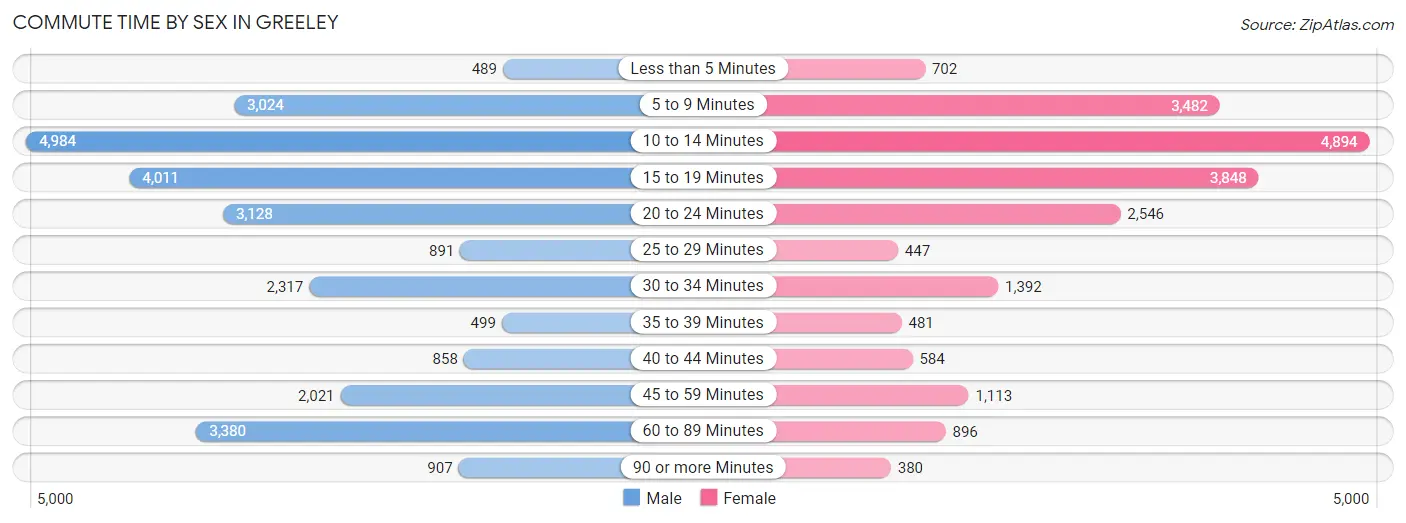
| Commute Time | Male | Female |
| Less than 5 Minutes | 489 (1.8%) | 702 (3.4%) |
| 5 to 9 Minutes | 3,024 (11.4%) | 3,482 (16.8%) |
| 10 to 14 Minutes | 4,984 (18.8%) | 4,894 (23.6%) |
| 15 to 19 Minutes | 4,011 (15.1%) | 3,848 (18.5%) |
| 20 to 24 Minutes | 3,128 (11.8%) | 2,546 (12.3%) |
| 25 to 29 Minutes | 891 (3.4%) | 447 (2.1%) |
| 30 to 34 Minutes | 2,317 (8.7%) | 1,392 (6.7%) |
| 35 to 39 Minutes | 499 (1.9%) | 481 (2.3%) |
| 40 to 44 Minutes | 858 (3.2%) | 584 (2.8%) |
| 45 to 59 Minutes | 2,021 (7.6%) | 1,113 (5.4%) |
| 60 to 89 Minutes | 3,380 (12.8%) | 896 (4.3%) |
| 90 or more Minutes | 907 (3.4%) | 380 (1.8%) |
Time of Departure to Work by Sex in Greeley
The most frequent times of departure to work in Greeley are 6:00 AM to 6:29 AM (3,286, 12.4%) for males and 7:00 AM to 7:29 AM (3,098, 14.9%) for females.
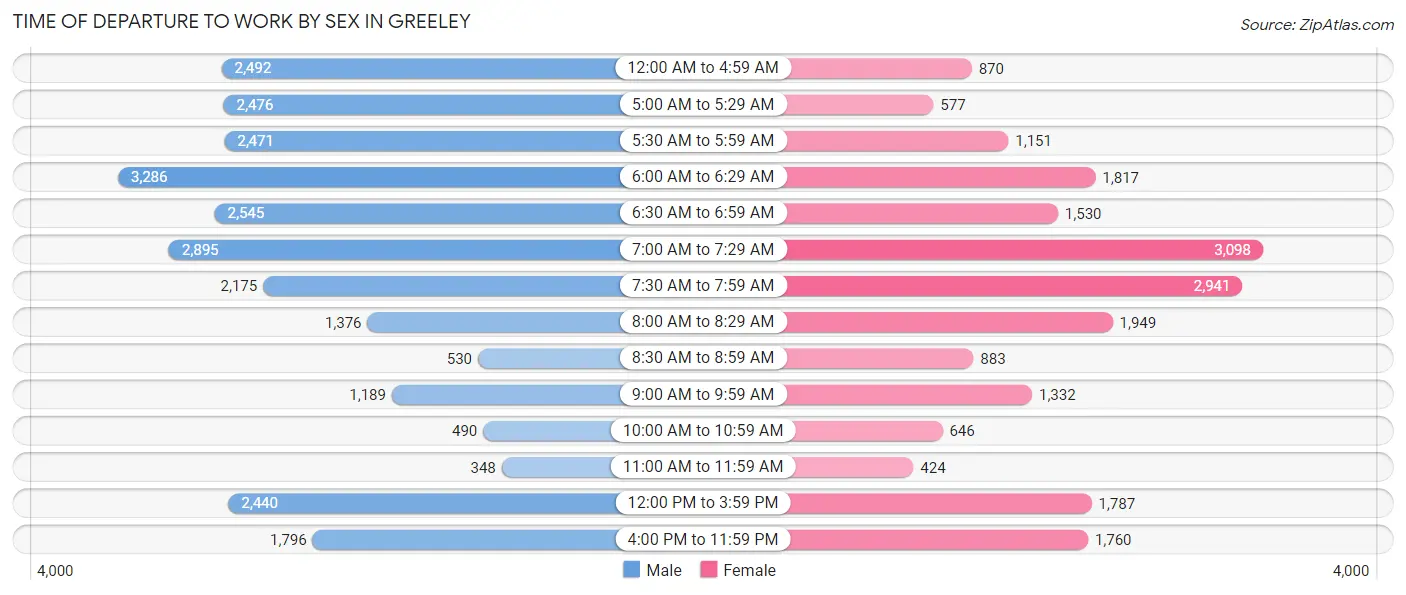
| Time of Departure | Male | Female |
| 12:00 AM to 4:59 AM | 2,492 (9.4%) | 870 (4.2%) |
| 5:00 AM to 5:29 AM | 2,476 (9.3%) | 577 (2.8%) |
| 5:30 AM to 5:59 AM | 2,471 (9.3%) | 1,151 (5.5%) |
| 6:00 AM to 6:29 AM | 3,286 (12.4%) | 1,817 (8.7%) |
| 6:30 AM to 6:59 AM | 2,545 (9.6%) | 1,530 (7.4%) |
| 7:00 AM to 7:29 AM | 2,895 (10.9%) | 3,098 (14.9%) |
| 7:30 AM to 7:59 AM | 2,175 (8.2%) | 2,941 (14.2%) |
| 8:00 AM to 8:29 AM | 1,376 (5.2%) | 1,949 (9.4%) |
| 8:30 AM to 8:59 AM | 530 (2.0%) | 883 (4.3%) |
| 9:00 AM to 9:59 AM | 1,189 (4.5%) | 1,332 (6.4%) |
| 10:00 AM to 10:59 AM | 490 (1.8%) | 646 (3.1%) |
| 11:00 AM to 11:59 AM | 348 (1.3%) | 424 (2.0%) |
| 12:00 PM to 3:59 PM | 2,440 (9.2%) | 1,787 (8.6%) |
| 4:00 PM to 11:59 PM | 1,796 (6.8%) | 1,760 (8.5%) |
| Total | 26,509 (100.0%) | 20,765 (100.0%) |
Housing Occupancy in Greeley
Occupancy by Ownership in Greeley
Of the total 38,006 dwellings in Greeley, owner-occupied units account for 23,046 (60.6%), while renter-occupied units make up 14,960 (39.4%).
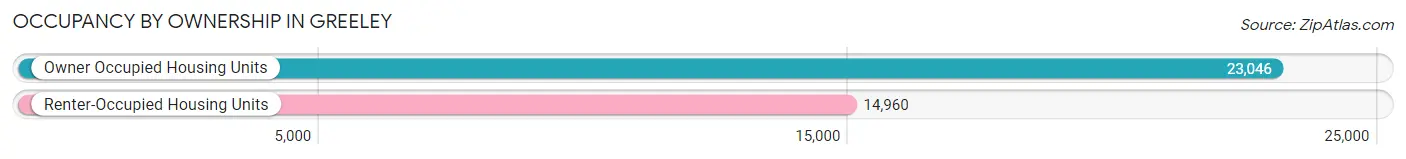
| Occupancy | # Housing Units | % Housing Units |
| Owner Occupied Housing Units | 23,046 | 60.6% |
| Renter-Occupied Housing Units | 14,960 | 39.4% |
| Total Occupied Housing Units | 38,006 | 100.0% |
Occupancy by Household Size in Greeley
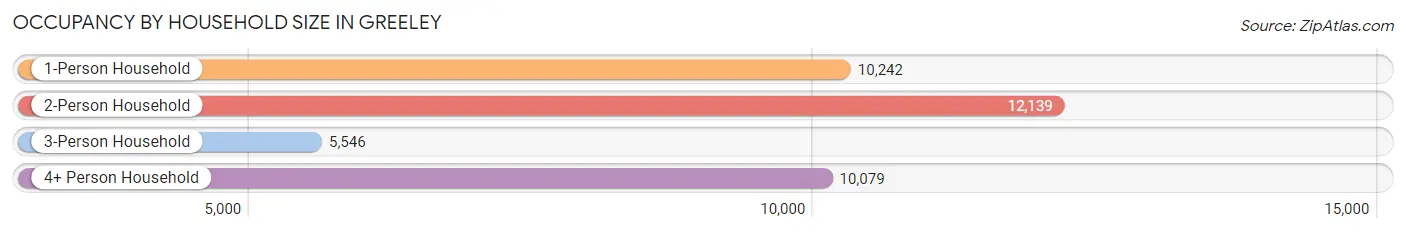
| Household Size | # Housing Units | % Housing Units |
| 1-Person Household | 10,242 | 27.0% |
| 2-Person Household | 12,139 | 31.9% |
| 3-Person Household | 5,546 | 14.6% |
| 4+ Person Household | 10,079 | 26.5% |
| Total Housing Units | 38,006 | 100.0% |
Occupancy by Ownership by Household Size in Greeley
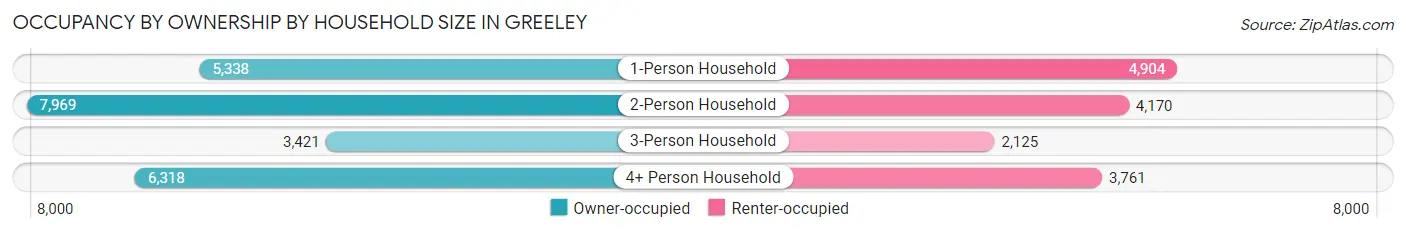
| Household Size | Owner-occupied | Renter-occupied |
| 1-Person Household | 5,338 (52.1%) | 4,904 (47.9%) |
| 2-Person Household | 7,969 (65.6%) | 4,170 (34.4%) |
| 3-Person Household | 3,421 (61.7%) | 2,125 (38.3%) |
| 4+ Person Household | 6,318 (62.7%) | 3,761 (37.3%) |
| Total Housing Units | 23,046 (60.6%) | 14,960 (39.4%) |
Occupancy by Educational Attainment in Greeley
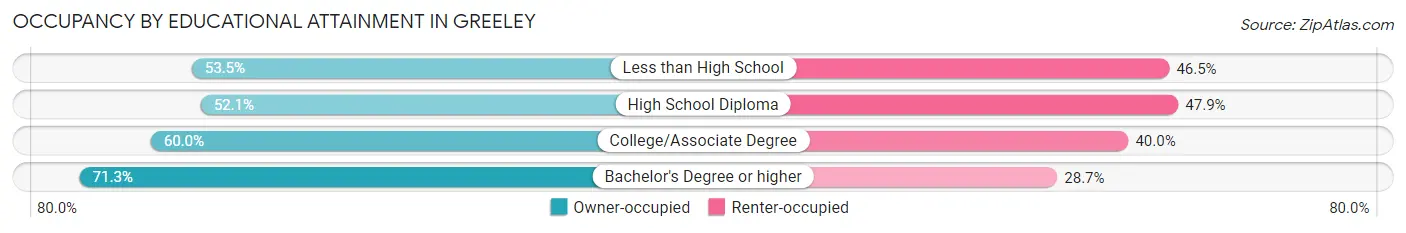
| Household Size | Owner-occupied | Renter-occupied |
| Less than High School | 2,984 (53.5%) | 2,596 (46.5%) |
| High School Diploma | 4,369 (52.1%) | 4,024 (47.9%) |
| College/Associate Degree | 7,617 (60.0%) | 5,083 (40.0%) |
| Bachelor's Degree or higher | 8,076 (71.3%) | 3,257 (28.7%) |
Occupancy by Age of Householder in Greeley
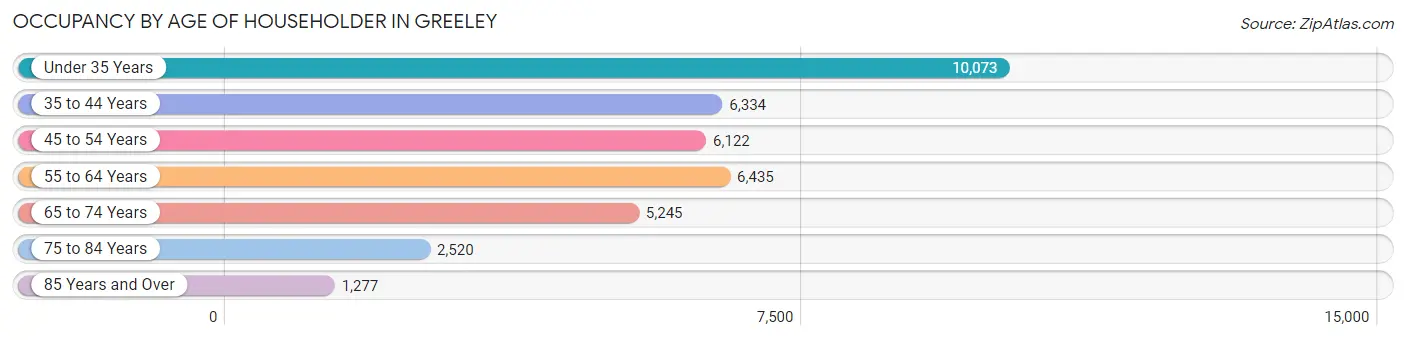
| Age Bracket | # Households | % Households |
| Under 35 Years | 10,073 | 26.5% |
| 35 to 44 Years | 6,334 | 16.7% |
| 45 to 54 Years | 6,122 | 16.1% |
| 55 to 64 Years | 6,435 | 16.9% |
| 65 to 74 Years | 5,245 | 13.8% |
| 75 to 84 Years | 2,520 | 6.6% |
| 85 Years and Over | 1,277 | 3.4% |
| Total | 38,006 | 100.0% |
Housing Finances in Greeley
Median Income by Occupancy in Greeley
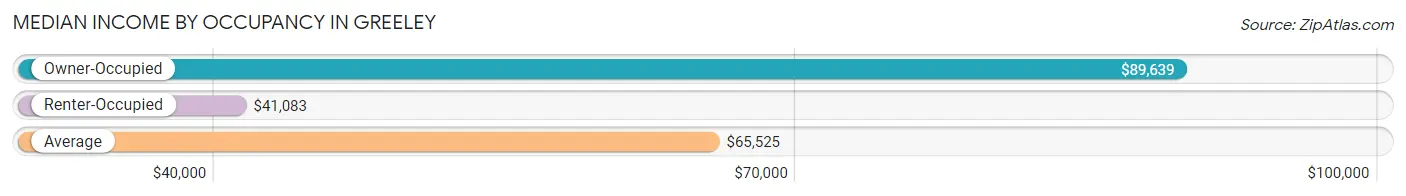
| Occupancy Type | # Households | Median Income |
| Owner-Occupied | 23,046 (60.6%) | $89,639 |
| Renter-Occupied | 14,960 (39.4%) | $41,083 |
| Average | 38,006 (100.0%) | $65,525 |
Occupancy by Householder Income Bracket in Greeley
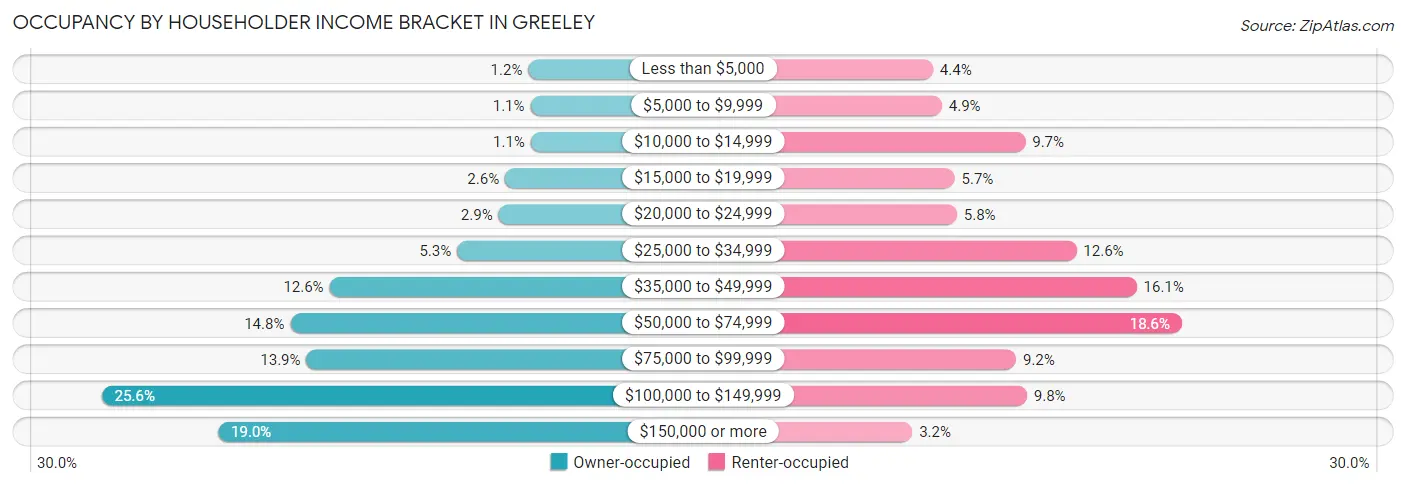
| Income Bracket | Owner-occupied | Renter-occupied |
| Less than $5,000 | 281 (1.2%) | 661 (4.4%) |
| $5,000 to $9,999 | 253 (1.1%) | 737 (4.9%) |
| $10,000 to $14,999 | 249 (1.1%) | 1,451 (9.7%) |
| $15,000 to $19,999 | 587 (2.5%) | 847 (5.7%) |
| $20,000 to $24,999 | 672 (2.9%) | 866 (5.8%) |
| $25,000 to $34,999 | 1,220 (5.3%) | 1,888 (12.6%) |
| $35,000 to $49,999 | 2,899 (12.6%) | 2,402 (16.1%) |
| $50,000 to $74,999 | 3,415 (14.8%) | 2,788 (18.6%) |
| $75,000 to $99,999 | 3,204 (13.9%) | 1,372 (9.2%) |
| $100,000 to $149,999 | 5,899 (25.6%) | 1,464 (9.8%) |
| $150,000 or more | 4,367 (19.0%) | 484 (3.2%) |
| Total | 23,046 (100.0%) | 14,960 (100.0%) |
Monthly Housing Cost Tiers in Greeley
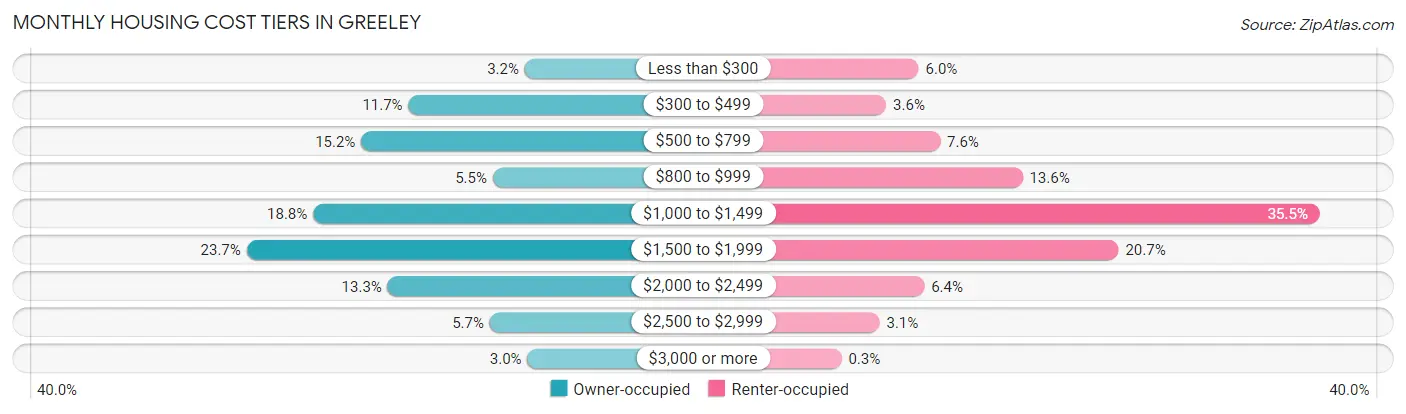
| Monthly Cost | Owner-occupied | Renter-occupied |
| Less than $300 | 729 (3.2%) | 894 (6.0%) |
| $300 to $499 | 2,704 (11.7%) | 537 (3.6%) |
| $500 to $799 | 3,505 (15.2%) | 1,131 (7.6%) |
| $800 to $999 | 1,272 (5.5%) | 2,039 (13.6%) |
| $1,000 to $1,499 | 4,322 (18.8%) | 5,314 (35.5%) |
| $1,500 to $1,999 | 5,451 (23.6%) | 3,097 (20.7%) |
| $2,000 to $2,499 | 3,055 (13.3%) | 956 (6.4%) |
| $2,500 to $2,999 | 1,323 (5.7%) | 464 (3.1%) |
| $3,000 or more | 685 (3.0%) | 45 (0.3%) |
| Total | 23,046 (100.0%) | 14,960 (100.0%) |
Physical Housing Characteristics in Greeley
Housing Structures in Greeley
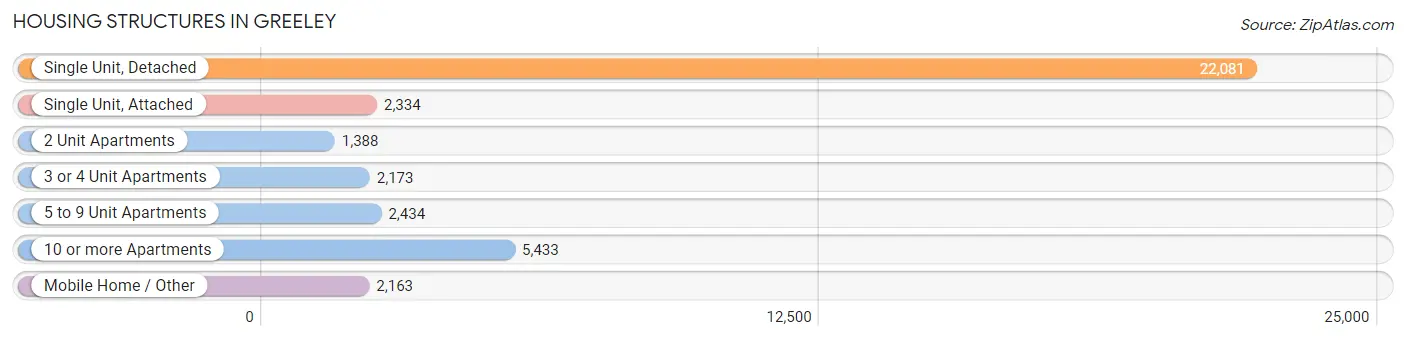
| Structure Type | # Housing Units | % Housing Units |
| Single Unit, Detached | 22,081 | 58.1% |
| Single Unit, Attached | 2,334 | 6.1% |
| 2 Unit Apartments | 1,388 | 3.6% |
| 3 or 4 Unit Apartments | 2,173 | 5.7% |
| 5 to 9 Unit Apartments | 2,434 | 6.4% |
| 10 or more Apartments | 5,433 | 14.3% |
| Mobile Home / Other | 2,163 | 5.7% |
| Total | 38,006 | 100.0% |
Housing Structures by Occupancy in Greeley
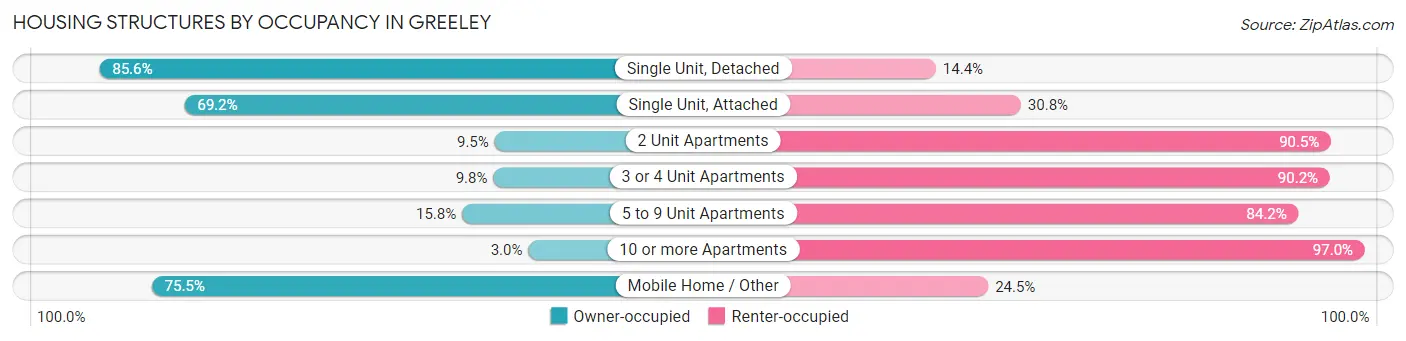
| Structure Type | Owner-occupied | Renter-occupied |
| Single Unit, Detached | 18,904 (85.6%) | 3,177 (14.4%) |
| Single Unit, Attached | 1,616 (69.2%) | 718 (30.8%) |
| 2 Unit Apartments | 132 (9.5%) | 1,256 (90.5%) |
| 3 or 4 Unit Apartments | 212 (9.8%) | 1,961 (90.2%) |
| 5 to 9 Unit Apartments | 384 (15.8%) | 2,050 (84.2%) |
| 10 or more Apartments | 164 (3.0%) | 5,269 (97.0%) |
| Mobile Home / Other | 1,634 (75.5%) | 529 (24.5%) |
| Total | 23,046 (60.6%) | 14,960 (39.4%) |
Housing Structures by Number of Rooms in Greeley
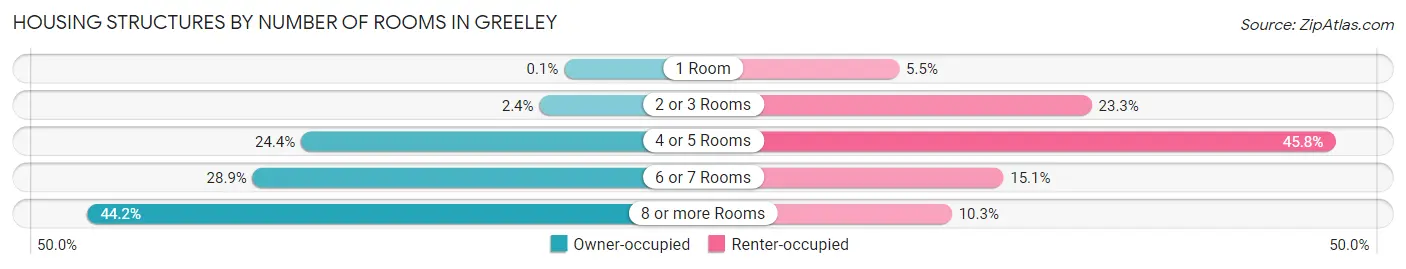
| Number of Rooms | Owner-occupied | Renter-occupied |
| 1 Room | 22 (0.1%) | 820 (5.5%) |
| 2 or 3 Rooms | 550 (2.4%) | 3,482 (23.3%) |
| 4 or 5 Rooms | 5,630 (24.4%) | 6,850 (45.8%) |
| 6 or 7 Rooms | 6,662 (28.9%) | 2,261 (15.1%) |
| 8 or more Rooms | 10,182 (44.2%) | 1,547 (10.3%) |
| Total | 23,046 (100.0%) | 14,960 (100.0%) |
Housing Structure by Heating Type in Greeley
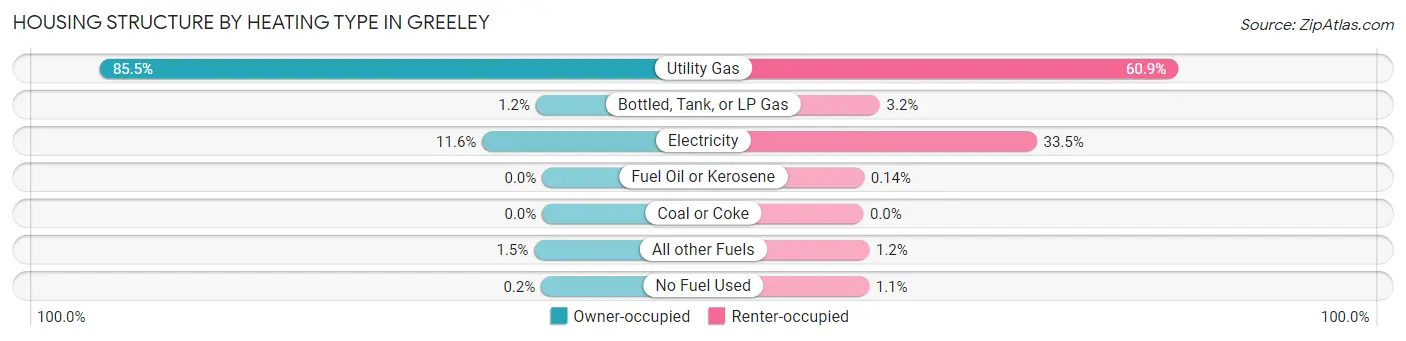
| Heating Type | Owner-occupied | Renter-occupied |
| Utility Gas | 19,699 (85.5%) | 9,107 (60.9%) |
| Bottled, Tank, or LP Gas | 278 (1.2%) | 479 (3.2%) |
| Electricity | 2,669 (11.6%) | 5,014 (33.5%) |
| Fuel Oil or Kerosene | 0 (0.0%) | 21 (0.1%) |
| Coal or Coke | 0 (0.0%) | 0 (0.0%) |
| All other Fuels | 355 (1.5%) | 173 (1.2%) |
| No Fuel Used | 45 (0.2%) | 166 (1.1%) |
| Total | 23,046 (100.0%) | 14,960 (100.0%) |
Household Vehicle Usage in Greeley
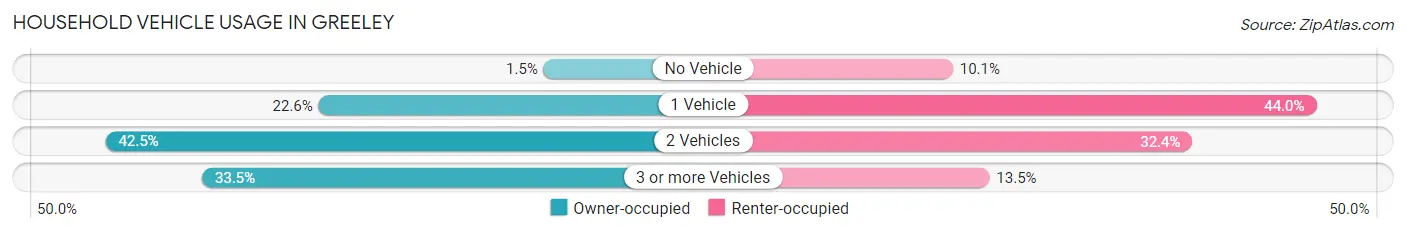
| Vehicles per Household | Owner-occupied | Renter-occupied |
| No Vehicle | 355 (1.5%) | 1,507 (10.1%) |
| 1 Vehicle | 5,199 (22.6%) | 6,583 (44.0%) |
| 2 Vehicles | 9,783 (42.4%) | 4,852 (32.4%) |
| 3 or more Vehicles | 7,709 (33.5%) | 2,018 (13.5%) |
| Total | 23,046 (100.0%) | 14,960 (100.0%) |
Real Estate & Mortgages in Greeley
Real Estate and Mortgage Overview in Greeley
| Characteristic | Without Mortgage | With Mortgage |
| Housing Units | 7,237 | 15,809 |
| Median Property Value | $330,100 | $352,600 |
| Median Household Income | $71,330 | $3,219 |
| Monthly Housing Costs | $518 | $673 |
| Real Estate Taxes | $1,522 | $413 |
Property Value by Mortgage Status in Greeley
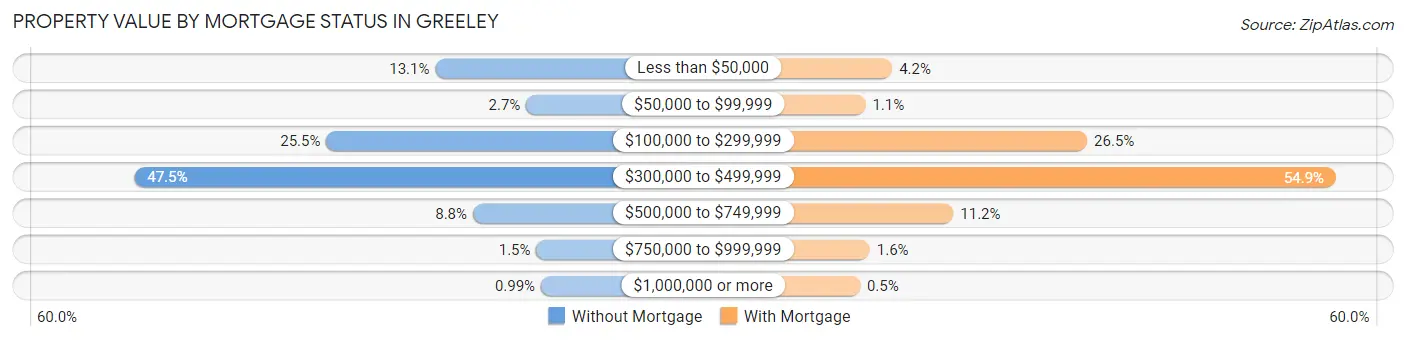
| Property Value | Without Mortgage | With Mortgage |
| Less than $50,000 | 945 (13.1%) | 662 (4.2%) |
| $50,000 to $99,999 | 194 (2.7%) | 178 (1.1%) |
| $100,000 to $299,999 | 1,847 (25.5%) | 4,185 (26.5%) |
| $300,000 to $499,999 | 3,435 (47.5%) | 8,679 (54.9%) |
| $500,000 to $749,999 | 635 (8.8%) | 1,768 (11.2%) |
| $750,000 to $999,999 | 109 (1.5%) | 258 (1.6%) |
| $1,000,000 or more | 72 (1.0%) | 79 (0.5%) |
| Total | 7,237 (100.0%) | 15,809 (100.0%) |
Household Income by Mortgage Status in Greeley
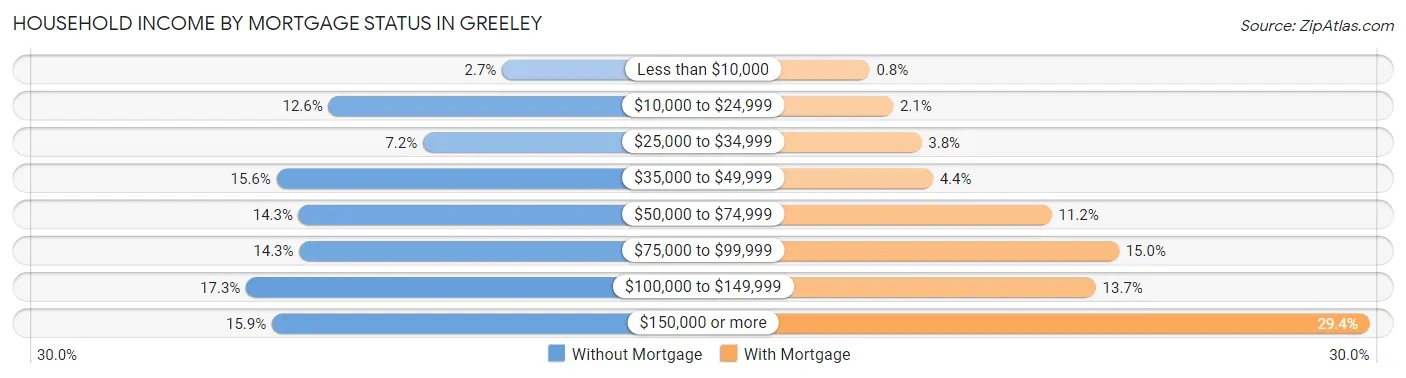
| Household Income | Without Mortgage | With Mortgage |
| Less than $10,000 | 196 (2.7%) | 127 (0.8%) |
| $10,000 to $24,999 | 914 (12.6%) | 338 (2.1%) |
| $25,000 to $34,999 | 523 (7.2%) | 594 (3.8%) |
| $35,000 to $49,999 | 1,129 (15.6%) | 697 (4.4%) |
| $50,000 to $74,999 | 1,037 (14.3%) | 1,770 (11.2%) |
| $75,000 to $99,999 | 1,035 (14.3%) | 2,378 (15.0%) |
| $100,000 to $149,999 | 1,255 (17.3%) | 2,169 (13.7%) |
| $150,000 or more | 1,148 (15.9%) | 4,644 (29.4%) |
| Total | 7,237 (100.0%) | 15,809 (100.0%) |
Property Value to Household Income Ratio in Greeley
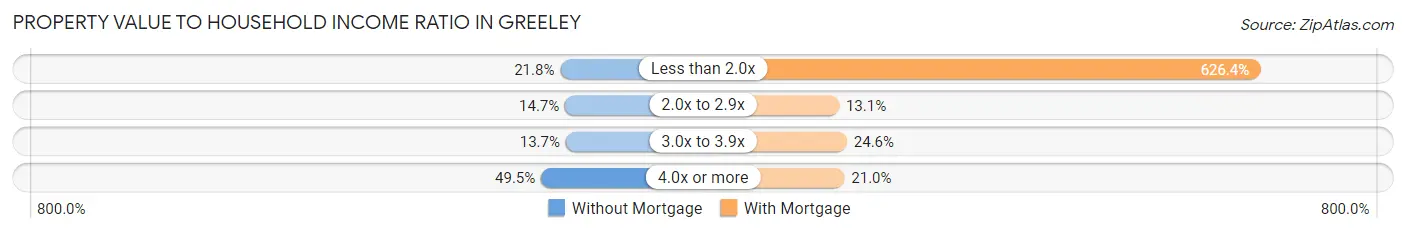
| Value-to-Income Ratio | Without Mortgage | With Mortgage |
| Less than 2.0x | 1,579 (21.8%) | 99,030 (626.4%) |
| 2.0x to 2.9x | 1,065 (14.7%) | 2,078 (13.1%) |
| 3.0x to 3.9x | 990 (13.7%) | 3,888 (24.6%) |
| 4.0x or more | 3,585 (49.5%) | 3,314 (21.0%) |
| Total | 7,237 (100.0%) | 15,809 (100.0%) |
Real Estate Taxes by Mortgage Status in Greeley
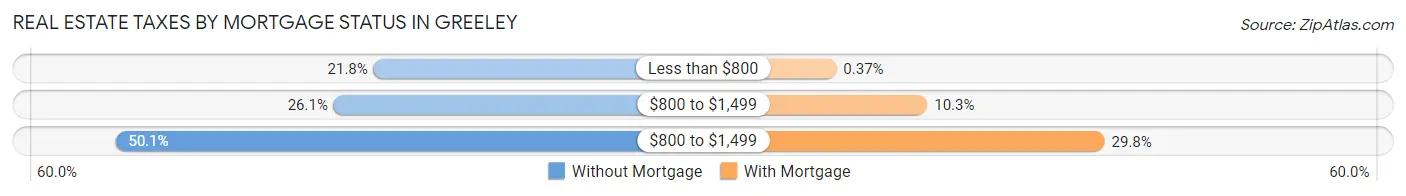
| Property Taxes | Without Mortgage | With Mortgage |
| Less than $800 | 1,574 (21.7%) | 59 (0.4%) |
| $800 to $1,499 | 1,890 (26.1%) | 1,633 (10.3%) |
| $800 to $1,499 | 3,623 (50.1%) | 4,704 (29.8%) |
| Total | 7,237 (100.0%) | 15,809 (100.0%) |
Health & Disability in Greeley
Health Insurance Coverage by Age in Greeley
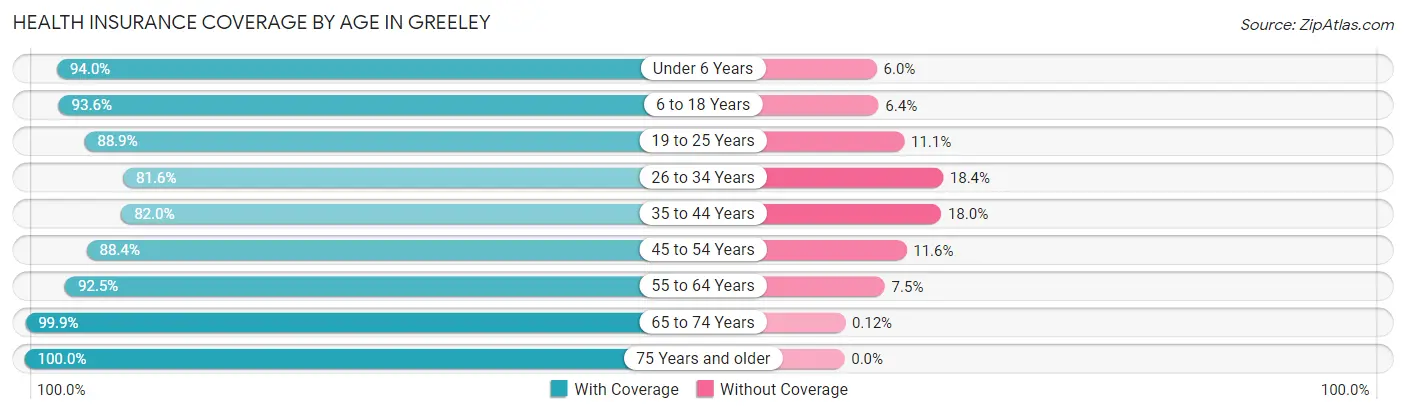
| Age Bracket | With Coverage | Without Coverage |
| Under 6 Years | 8,087 (94.0%) | 519 (6.0%) |
| 6 to 18 Years | 18,351 (93.6%) | 1,246 (6.4%) |
| 19 to 25 Years | 12,903 (88.9%) | 1,618 (11.1%) |
| 26 to 34 Years | 12,824 (81.6%) | 2,888 (18.4%) |
| 35 to 44 Years | 9,932 (82.0%) | 2,184 (18.0%) |
| 45 to 54 Years | 9,852 (88.4%) | 1,288 (11.6%) |
| 55 to 64 Years | 10,091 (92.5%) | 822 (7.5%) |
| 65 to 74 Years | 7,996 (99.9%) | 10 (0.1%) |
| 75 Years and older | 5,509 (100.0%) | 0 (0.0%) |
| Total | 95,545 (90.0%) | 10,575 (10.0%) |
Health Insurance Coverage by Citizenship Status in Greeley
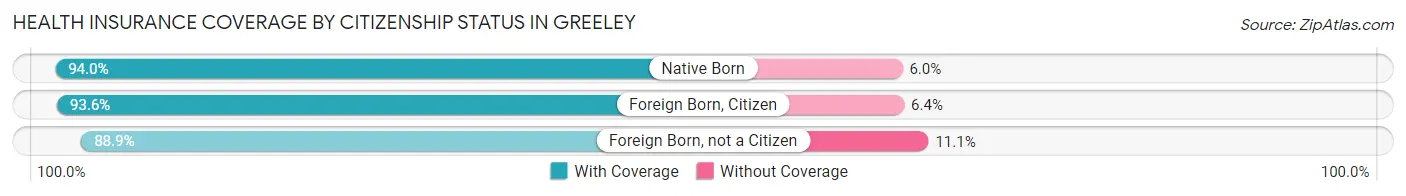
| Citizenship Status | With Coverage | Without Coverage |
| Native Born | 8,087 (94.0%) | 519 (6.0%) |
| Foreign Born, Citizen | 18,351 (93.6%) | 1,246 (6.4%) |
| Foreign Born, not a Citizen | 12,903 (88.9%) | 1,618 (11.1%) |
Health Insurance Coverage by Household Income in Greeley
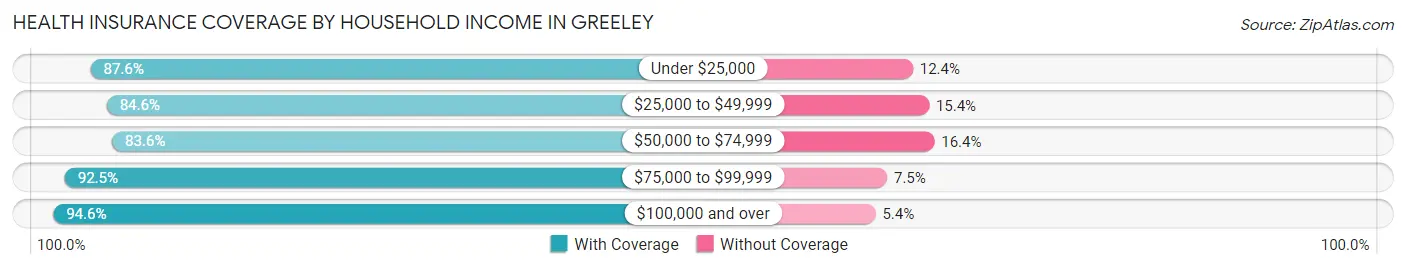
| Household Income | With Coverage | Without Coverage |
| Under $25,000 | 12,098 (87.6%) | 1,706 (12.4%) |
| $25,000 to $49,999 | 15,399 (84.6%) | 2,802 (15.4%) |
| $50,000 to $74,999 | 14,077 (83.6%) | 2,760 (16.4%) |
| $75,000 to $99,999 | 12,887 (92.5%) | 1,051 (7.5%) |
| $100,000 and over | 37,317 (94.6%) | 2,119 (5.4%) |
Public vs Private Health Insurance Coverage by Age in Greeley
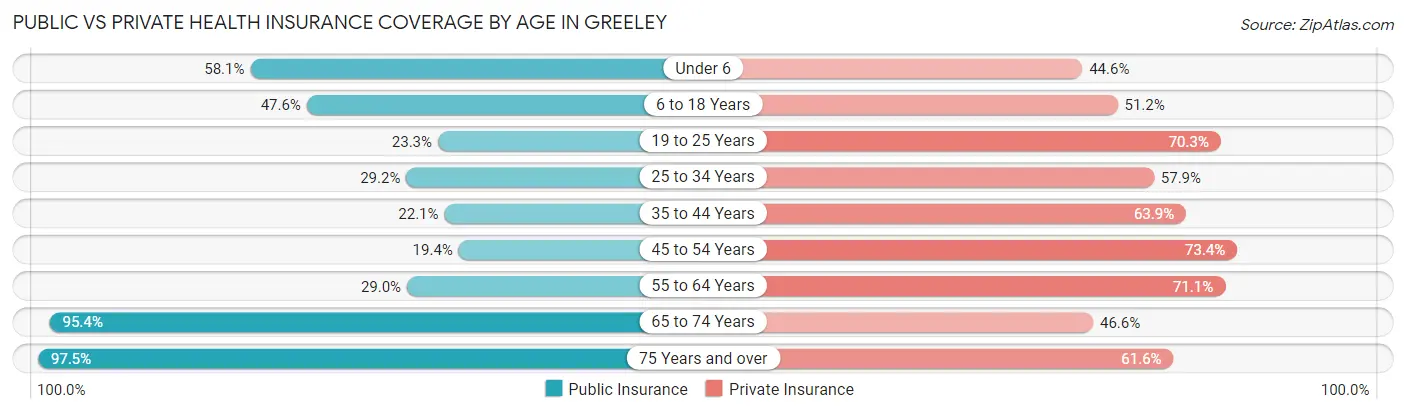
| Age Bracket | Public Insurance | Private Insurance |
| Under 6 | 5,000 (58.1%) | 3,841 (44.6%) |
| 6 to 18 Years | 9,336 (47.6%) | 10,029 (51.2%) |
| 19 to 25 Years | 3,382 (23.3%) | 10,213 (70.3%) |
| 25 to 34 Years | 4,582 (29.2%) | 9,101 (57.9%) |
| 35 to 44 Years | 2,677 (22.1%) | 7,740 (63.9%) |
| 45 to 54 Years | 2,165 (19.4%) | 8,175 (73.4%) |
| 55 to 64 Years | 3,168 (29.0%) | 7,762 (71.1%) |
| 65 to 74 Years | 7,635 (95.4%) | 3,734 (46.6%) |
| 75 Years and over | 5,373 (97.5%) | 3,391 (61.6%) |
| Total | 43,318 (40.8%) | 63,986 (60.3%) |
Disability Status by Sex by Age in Greeley
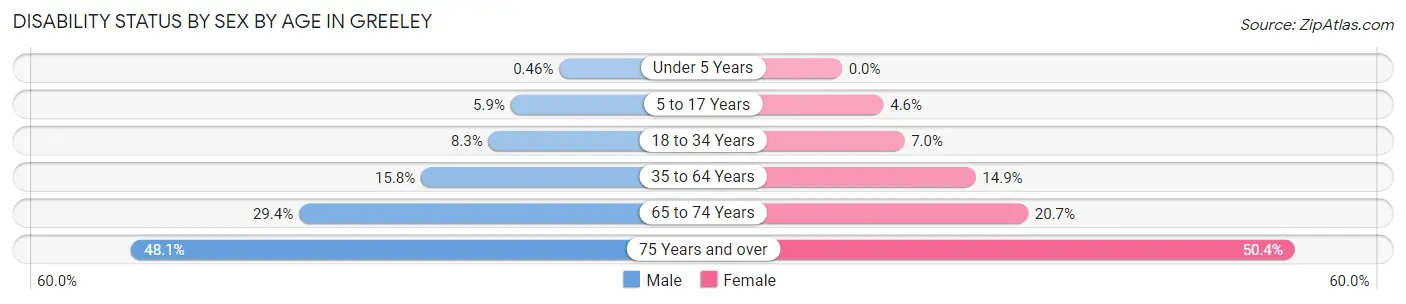
| Age Bracket | Male | Female |
| Under 5 Years | 18 (0.5%) | 0 (0.0%) |
| 5 to 17 Years | 558 (5.9%) | 426 (4.6%) |
| 18 to 34 Years | 1,369 (8.3%) | 1,112 (7.0%) |
| 35 to 64 Years | 2,720 (15.8%) | 2,529 (14.9%) |
| 65 to 74 Years | 1,061 (29.4%) | 912 (20.7%) |
| 75 Years and over | 1,164 (48.1%) | 1,558 (50.4%) |
Disability Class by Sex by Age in Greeley
Disability Class: Hearing Difficulty
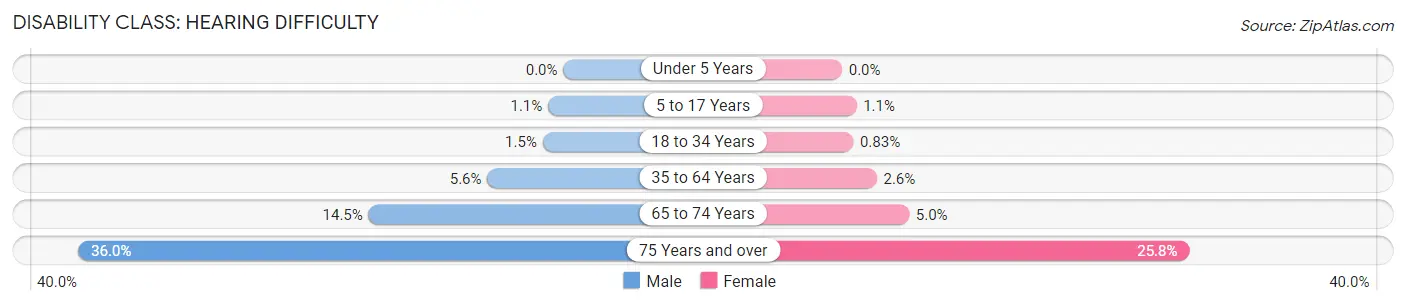
| Age Bracket | Male | Female |
| Under 5 Years | 0 (0.0%) | 0 (0.0%) |
| 5 to 17 Years | 108 (1.1%) | 99 (1.1%) |
| 18 to 34 Years | 251 (1.5%) | 133 (0.8%) |
| 35 to 64 Years | 969 (5.6%) | 439 (2.6%) |
| 65 to 74 Years | 521 (14.5%) | 219 (5.0%) |
| 75 Years and over | 872 (36.0%) | 797 (25.8%) |
Disability Class: Vision Difficulty
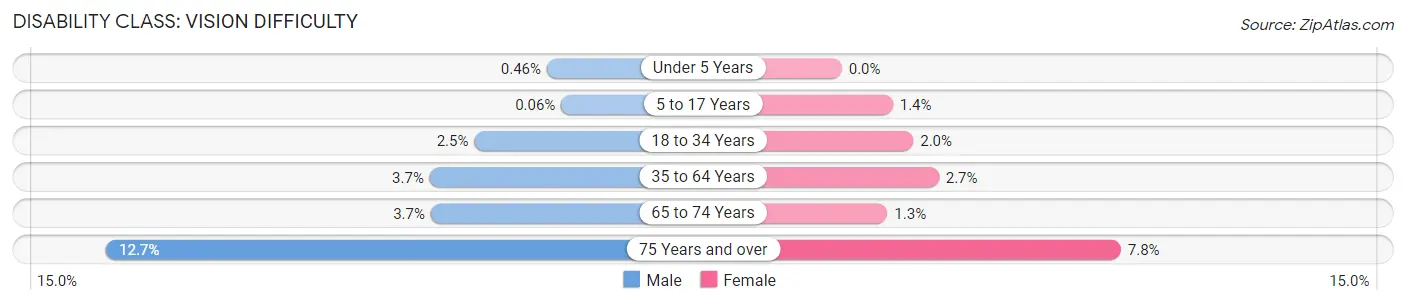
| Age Bracket | Male | Female |
| Under 5 Years | 18 (0.5%) | 0 (0.0%) |
| 5 to 17 Years | 6 (0.1%) | 131 (1.4%) |
| 18 to 34 Years | 408 (2.5%) | 318 (2.0%) |
| 35 to 64 Years | 638 (3.7%) | 459 (2.7%) |
| 65 to 74 Years | 133 (3.7%) | 56 (1.3%) |
| 75 Years and over | 308 (12.7%) | 240 (7.8%) |
Disability Class: Cognitive Difficulty
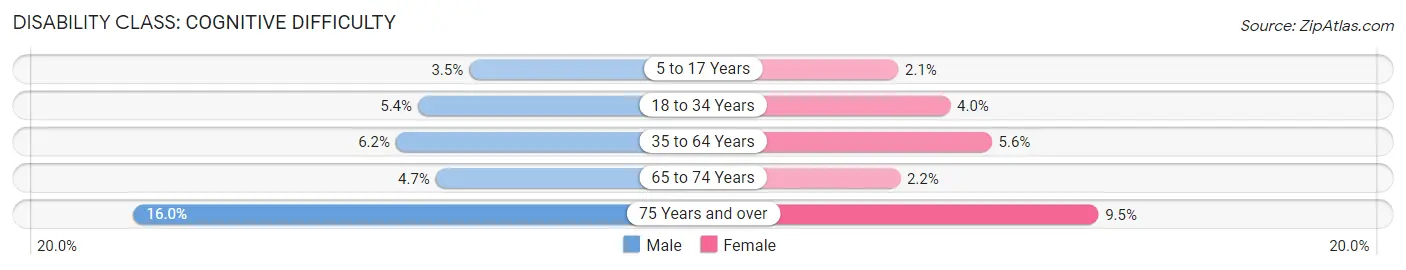
| Age Bracket | Male | Female |
| 5 to 17 Years | 333 (3.5%) | 193 (2.1%) |
| 18 to 34 Years | 887 (5.4%) | 643 (4.0%) |
| 35 to 64 Years | 1,067 (6.2%) | 945 (5.6%) |
| 65 to 74 Years | 171 (4.7%) | 95 (2.2%) |
| 75 Years and over | 386 (16.0%) | 294 (9.5%) |
Disability Class: Ambulatory Difficulty
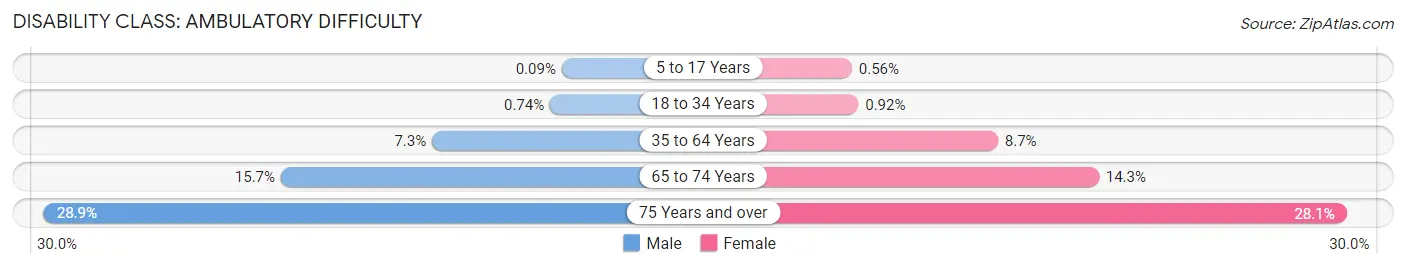
| Age Bracket | Male | Female |
| 5 to 17 Years | 9 (0.1%) | 52 (0.6%) |
| 18 to 34 Years | 121 (0.7%) | 148 (0.9%) |
| 35 to 64 Years | 1,255 (7.3%) | 1,478 (8.7%) |
| 65 to 74 Years | 567 (15.7%) | 630 (14.3%) |
| 75 Years and over | 700 (28.9%) | 868 (28.1%) |
Disability Class: Self-Care Difficulty
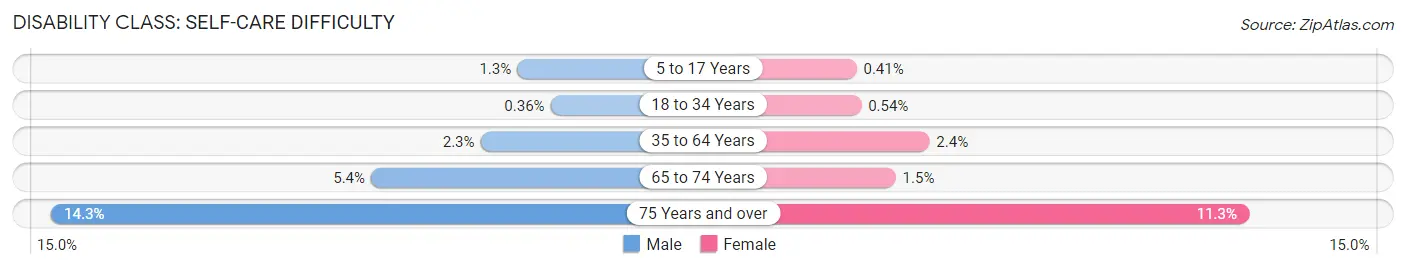
| Age Bracket | Male | Female |
| 5 to 17 Years | 123 (1.3%) | 38 (0.4%) |
| 18 to 34 Years | 59 (0.4%) | 87 (0.5%) |
| 35 to 64 Years | 397 (2.3%) | 414 (2.4%) |
| 65 to 74 Years | 193 (5.4%) | 66 (1.5%) |
| 75 Years and over | 345 (14.3%) | 350 (11.3%) |
Technology Access in Greeley
Computing Device Access in Greeley

| Device Type | # Households | % Households |
| Desktop or Laptop | 29,464 | 77.5% |
| Smartphone | 33,666 | 88.6% |
| Tablet | 23,685 | 62.3% |
| No Computing Device | 1,743 | 4.6% |
| Total | 38,006 | 100.0% |
Internet Access in Greeley
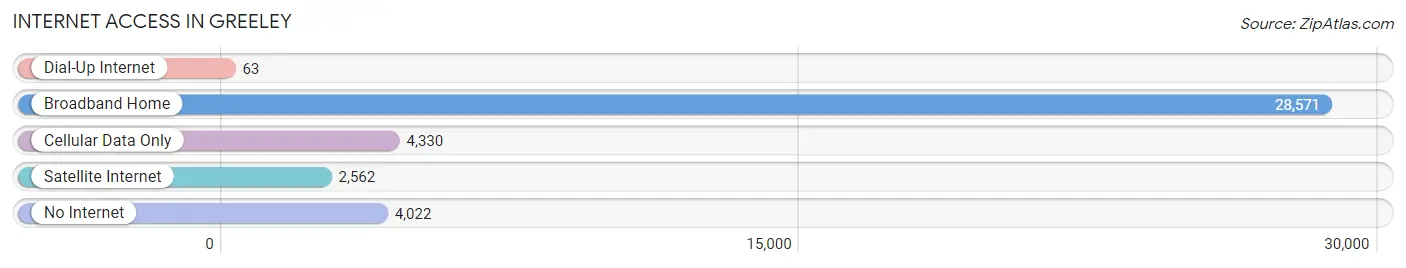
| Internet Type | # Households | % Households |
| Dial-Up Internet | 63 | 0.2% |
| Broadband Home | 28,571 | 75.2% |
| Cellular Data Only | 4,330 | 11.4% |
| Satellite Internet | 2,562 | 6.7% |
| No Internet | 4,022 | 10.6% |
| Total | 38,006 | 100.0% |
Greeley Summary
Greeley, Colorado is a city located in Weld County, Colorado, United States. It is the county seat and the most populous city of Weld County, with an estimated population of 106,856 in 2019. Greeley is a part of the Front Range Urban Corridor, an area of urban development along the Front Range of the Rocky Mountains. It is situated 49 miles (79 km) north-northeast of the Colorado State Capitol in Denver.
History
Greeley was founded in 1870 as the Union Colony, an experimental utopian society, by Nathan Meeker, a newspaper reporter from New York City. Meeker named it after Horace Greeley, his editor at the New York Tribune, who had earlier urged settlers to "Go West, young man." The name was later shortened to Greeley.
The Union Colony was intended to be a model community, inspired by the ideals of the United States Declaration of Independence, the United States Constitution, and the teachings of Jesus Christ. Meeker and his associates founded the Union Colony on principles of temperance, religion, education, and social justice. The Union Colony was one of the first planned communities in the United States.
Geography
Greeley is located in the South Platte River Valley on the western edge of the High Plains, just east of the Front Range of the Rocky Mountains. The city lies along the Cache la Poudre River, approximately 55 miles (89 km) north of Denver. The city is situated at an elevation of 4,658 feet (1,422 m).
Greeley is located in Weld County, which is the fourth most populous county in Colorado. The county covers an area of 4,017 square miles (10,420 km2). The city is bordered by the towns of Evans to the west, Windsor to the north, and Eaton to the east.
Economy
Greeley is an important economic center for Weld County and the Front Range region. The city is home to a variety of industries, including agriculture, manufacturing, energy, healthcare, and retail.
Agriculture is a major part of the local economy. Weld County is the top agricultural county in Colorado, and Greeley is home to a number of large agricultural companies, including JBS USA, Leprino Foods, and Cargill.
Manufacturing is also an important part of the local economy. Greeley is home to a number of manufacturing companies, including Vestas, a wind turbine manufacturer, and Anheuser-Busch, a beer producer.
Energy is another major industry in Greeley. The city is home to a number of energy companies, including EnCana, a natural gas producer, and Xcel Energy, an electricity provider.
Healthcare is also an important part of the local economy. Greeley is home to a number of healthcare providers, including North Colorado Medical Center, a major hospital, and Banner Health, a healthcare provider.
Demographics
As of the 2019 census, the population of Greeley was estimated to be 106,856. The city has a population density of 1,845 people per square mile (715/km2). The racial makeup of the city was 79.2% White, 2.2% African American, 0.7% Native American, 1.3% Asian, 0.1% Pacific Islander, 13.3% from other races, and 3.2% from two or more races. Hispanic or Latino of any race were 33.2% of the population.
Greeley is a diverse city, with a variety of cultures and religions represented. The city is home to a large Hispanic population, as well as a growing population of immigrants from Asia and Africa. The city also has a large Mormon population, as well as a number of other religious groups.
Common Questions
What is Per Capita Income in Greeley?
Per Capita income in Greeley is $31,565.
What is the Median Family Income in Greeley?
Median Family Income in Greeley is $81,872.
What is the Median Household income in Greeley?
Median Household Income in Greeley is $65,525.
What is Income or Wage Gap in Greeley?
Income or Wage Gap in Greeley is 27.9%.
Women in Greeley earn 72.1 cents for every dollar earned by a man.
What is Family Income Deficit in Greeley?
Family Income Deficit in Greeley is $12,520.
Families that are below poverty line in Greeley earn $12,520 less on average than the poverty threshold level.
What is Inequality or Gini Index in Greeley?
Inequality or Gini Index in Greeley is 0.44.
What is the Total Population of Greeley?
Total Population of Greeley is 107,949.
What is the Total Male Population of Greeley?
Total Male Population of Greeley is 54,193.
What is the Total Female Population of Greeley?
Total Female Population of Greeley is 53,756.
What is the Ratio of Males per 100 Females in Greeley?
There are 100.81 Males per 100 Females in Greeley.
What is the Ratio of Females per 100 Males in Greeley?
There are 99.19 Females per 100 Males in Greeley.
What is the Median Population Age in Greeley?
Median Population Age in Greeley is 31.9 Years.
What is the Average Family Size in Greeley
Average Family Size in Greeley is 3.3 People.
What is the Average Household Size in Greeley
Average Household Size in Greeley is 2.7 People.
How Large is the Labor Force in Greeley?
There are 55,249 People in the Labor Forcein in Greeley.
What is the Percentage of People in the Labor Force in Greeley?
65.2% of People are in the Labor Force in Greeley.
What is the Unemployment Rate in Greeley?
Unemployment Rate in Greeley is 5.6%.