Zip Codes with the Highest Percentage of Population with a Degree in Liberal Arts and History in Sacramento, CA
RELATED REPORTS & OPTIONS
Liberal Arts and History
Sacramento
Compare Zip Codes
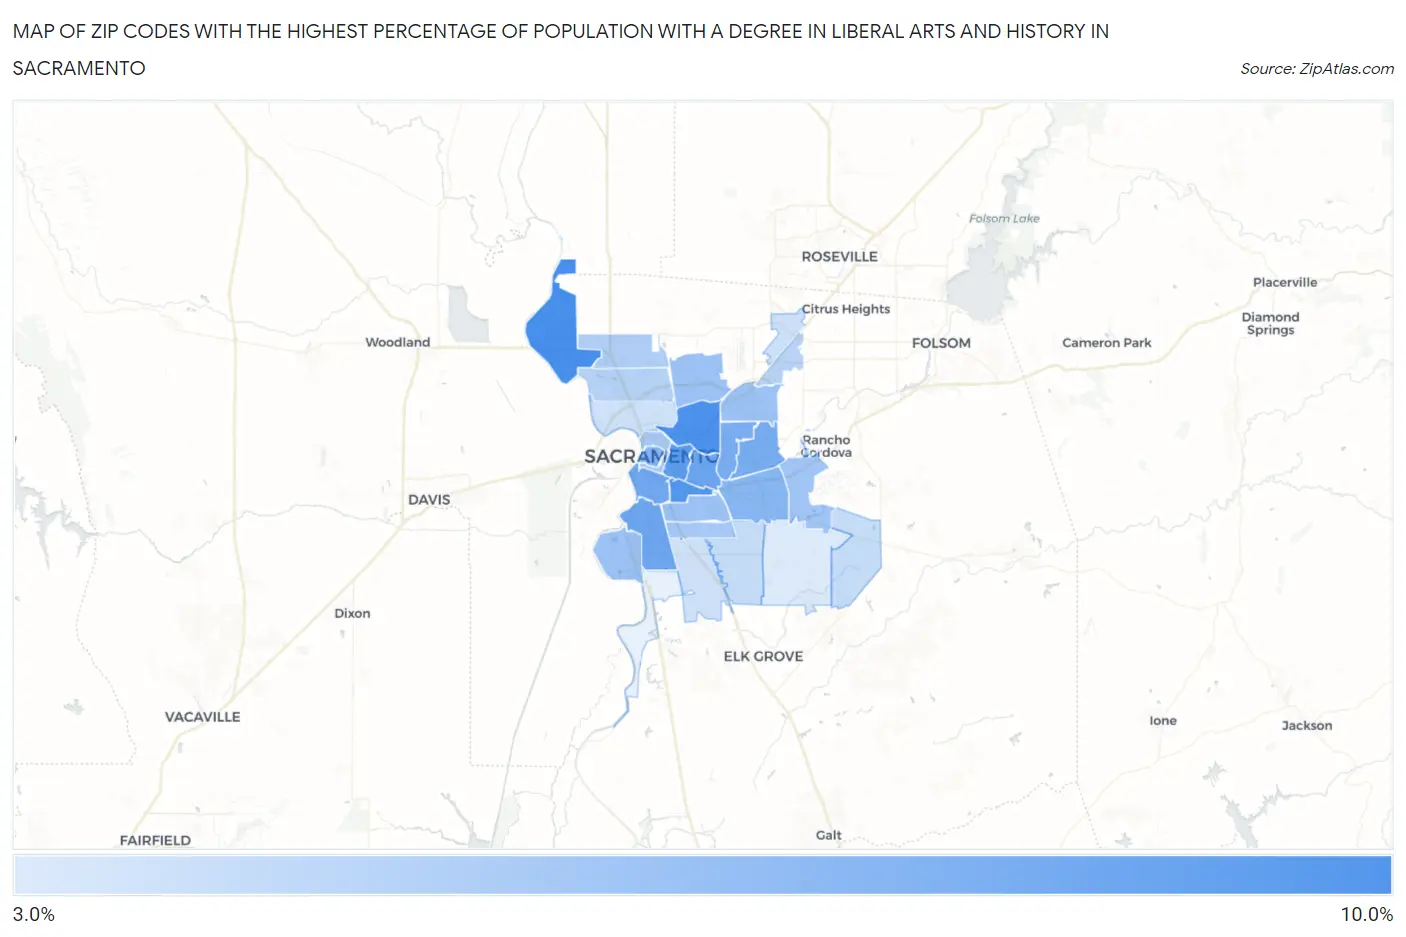
Map of Zip Codes with the Highest Percentage of Population with a Degree in Liberal Arts and History in Sacramento
3.4%
9.1%
Zip Codes with the Highest Percentage of Population with a Degree in Liberal Arts and History in Sacramento, CA
| Zip Code | % Graduates | vs State | vs National | |
| 1. | 95837 | 9.1% | 5.5%(+3.59)#283 | 4.9%(+4.22)#3,774 |
| 2. | 95815 | 8.9% | 5.5%(+3.41)#295 | 4.9%(+4.04)#3,933 |
| 3. | 95817 | 8.6% | 5.5%(+3.15)#310 | 4.9%(+3.77)#4,179 |
| 4. | 95816 | 8.4% | 5.5%(+2.90)#340 | 4.9%(+3.53)#4,446 |
| 5. | 95819 | 7.6% | 5.5%(+2.13)#437 | 4.9%(+2.76)#5,397 |
| 6. | 95822 | 7.6% | 5.5%(+2.10)#445 | 4.9%(+2.72)#5,445 |
| 7. | 95818 | 7.5% | 5.5%(+2.01)#461 | 4.9%(+2.63)#5,579 |
| 8. | 95864 | 7.2% | 5.5%(+1.73)#505 | 4.9%(+2.35)#6,012 |
| 9. | 95825 | 7.2% | 5.5%(+1.68)#511 | 4.9%(+2.30)#6,090 |
| 10. | 95814 | 6.9% | 5.5%(+1.41)#550 | 4.9%(+2.04)#6,541 |
| 11. | 95826 | 6.6% | 5.5%(+1.10)#606 | 4.9%(+1.72)#7,151 |
| 12. | 95831 | 5.9% | 5.5%(+0.439)#757 | 4.9%(+1.06)#8,684 |
| 13. | 95838 | 5.9% | 5.5%(+0.404)#767 | 4.9%(+1.03)#8,777 |
| 14. | 95820 | 5.9% | 5.5%(+0.368)#775 | 4.9%(+0.992)#8,885 |
| 15. | 95821 | 5.8% | 5.5%(+0.346)#786 | 4.9%(+0.970)#8,934 |
| 16. | 95827 | 5.7% | 5.5%(+0.179)#818 | 4.9%(+0.802)#9,365 |
| 17. | 95824 | 5.4% | 5.5%(-0.055)#875 | 4.9%(+0.569)#10,032 |
| 18. | 95811 | 5.4% | 5.5%(-0.098)#881 | 4.9%(+0.526)#10,139 |
| 19. | 95835 | 5.2% | 5.5%(-0.337)#946 | 4.9%(+0.287)#10,847 |
| 20. | 95834 | 4.9% | 5.5%(-0.624)#1,000 | 4.9%(-0.000)#11,745 |
| 21. | 95841 | 4.8% | 5.5%(-0.728)#1,024 | 4.9%(-0.104)#12,074 |
| 22. | 95830 | 4.3% | 5.5%(-1.19)#1,117 | 4.9%(-0.562)#13,609 |
| 23. | 95828 | 4.2% | 5.5%(-1.25)#1,136 | 4.9%(-0.629)#13,847 |
| 24. | 95842 | 4.0% | 5.5%(-1.51)#1,183 | 4.9%(-0.883)#14,839 |
| 25. | 95833 | 3.9% | 5.5%(-1.56)#1,197 | 4.9%(-0.931)#15,015 |
| 26. | 95823 | 3.9% | 5.5%(-1.59)#1,205 | 4.9%(-0.965)#15,147 |
| 27. | 95829 | 3.4% | 5.5%(-2.07)#1,291 | 4.9%(-1.45)#16,891 |
1
Common Questions
What are the Top 10 Zip Codes with the Highest Percentage of Population with a Degree in Liberal Arts and History in Sacramento, CA?
Top 10 Zip Codes with the Highest Percentage of Population with a Degree in Liberal Arts and History in Sacramento, CA are:
What zip code has the Highest Percentage of Population with a Degree in Liberal Arts and History in Sacramento, CA?
95837 has the Highest Percentage of Population with a Degree in Liberal Arts and History in Sacramento, CA with 9.1%.
What is the Percentage of Population with a Degree in Liberal Arts and History in Sacramento, CA?
Percentage of Population with a Degree in Liberal Arts and History in Sacramento is 6.2%.
What is the Percentage of Population with a Degree in Liberal Arts and History in California?
Percentage of Population with a Degree in Liberal Arts and History in California is 5.5%.
What is the Percentage of Population with a Degree in Liberal Arts and History in the United States?
Percentage of Population with a Degree in Liberal Arts and History in the United States is 4.9%.