Zip Codes with the Highest Percentage of Population with a Degree in Liberal Arts and History in San Diego, CA
RELATED REPORTS & OPTIONS
Liberal Arts and History
San Diego
Compare Zip Codes
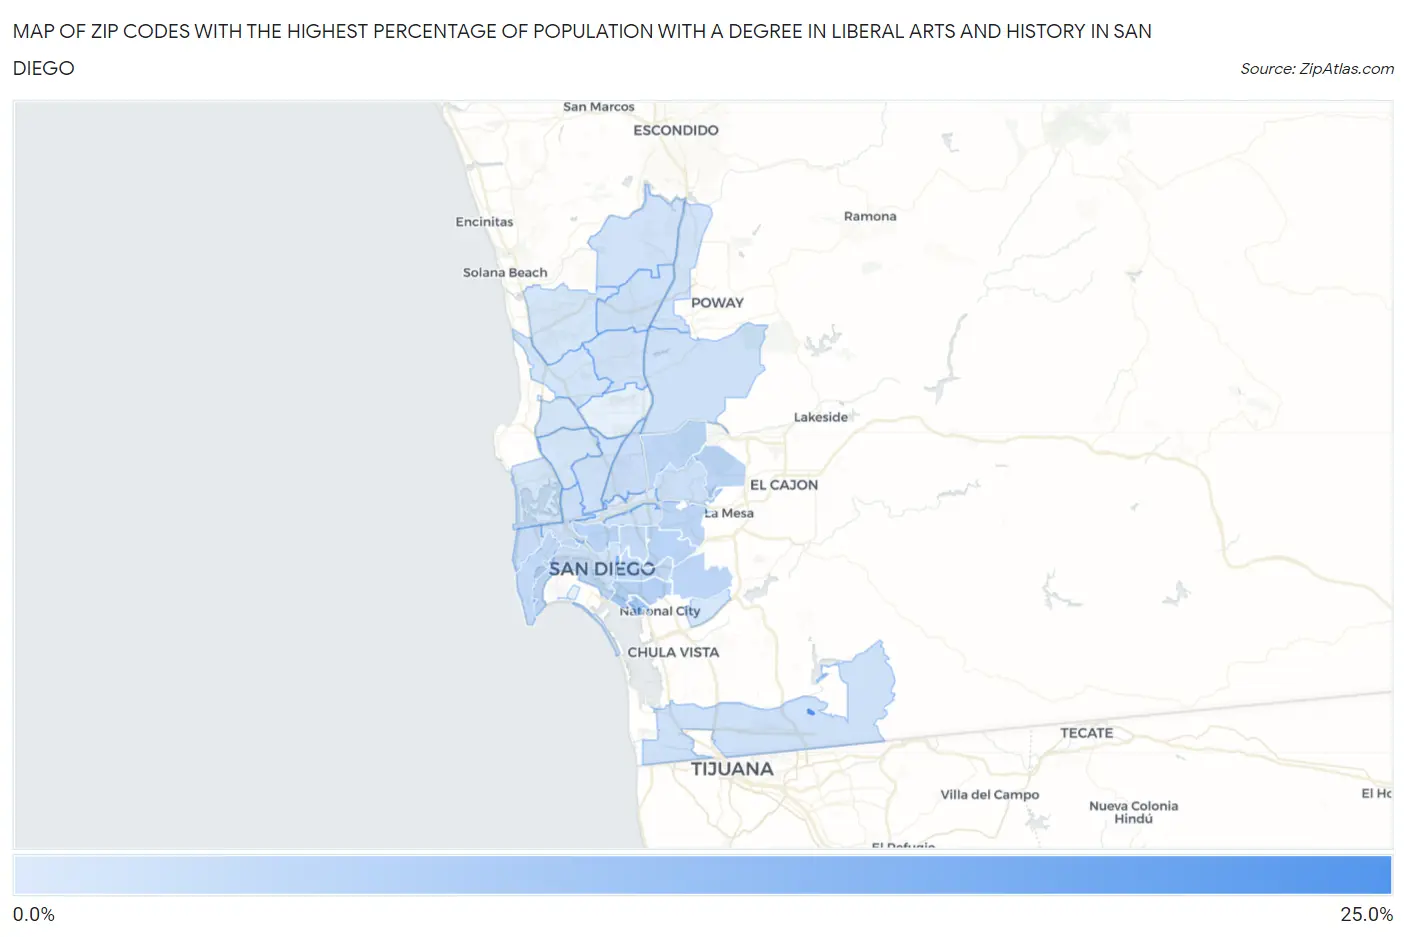
Map of Zip Codes with the Highest Percentage of Population with a Degree in Liberal Arts and History in San Diego
2.1%
21.8%
Zip Codes with the Highest Percentage of Population with a Degree in Liberal Arts and History in San Diego, CA
| Zip Code | % Graduates | vs State | vs National | |
| 1. | 92179 | 21.8% | 5.5%(+16.3)#52 | 4.9%(+17.0)#744 |
| 2. | 92136 | 9.1% | 5.5%(+3.63)#281 | 4.9%(+4.25)#3,731 |
| 3. | 92113 | 6.8% | 5.5%(+1.33)#575 | 4.9%(+1.95)#6,689 |
| 4. | 92103 | 6.5% | 5.5%(+1.01)#617 | 4.9%(+1.64)#7,328 |
| 5. | 92105 | 6.2% | 5.5%(+0.753)#677 | 4.9%(+1.38)#7,918 |
| 6. | 92114 | 6.2% | 5.5%(+0.664)#699 | 4.9%(+1.29)#8,124 |
| 7. | 92119 | 6.1% | 5.5%(+0.606)#718 | 4.9%(+1.23)#8,260 |
| 8. | 92115 | 5.9% | 5.5%(+0.449)#753 | 4.9%(+1.07)#8,659 |
| 9. | 92140 | 5.9% | 5.5%(+0.386)#770 | 4.9%(+1.01)#8,807 |
| 10. | 92124 | 5.7% | 5.5%(+0.228)#810 | 4.9%(+0.852)#9,235 |
| 11. | 92102 | 5.5% | 5.5%(+0.049)#848 | 4.9%(+0.673)#9,736 |
| 12. | 92106 | 5.5% | 5.5%(-0.011)#861 | 4.9%(+0.613)#9,907 |
| 13. | 92104 | 5.3% | 5.5%(-0.198)#912 | 4.9%(+0.426)#10,450 |
| 14. | 92123 | 4.4% | 5.5%(-1.06)#1,095 | 4.9%(-0.435)#13,165 |
| 15. | 92107 | 4.4% | 5.5%(-1.06)#1,096 | 4.9%(-0.435)#13,166 |
| 16. | 92120 | 4.0% | 5.5%(-1.49)#1,180 | 4.9%(-0.864)#14,744 |
| 17. | 92154 | 3.9% | 5.5%(-1.58)#1,203 | 4.9%(-0.956)#15,116 |
| 18. | 92116 | 3.9% | 5.5%(-1.59)#1,207 | 4.9%(-0.968)#15,157 |
| 19. | 92110 | 3.8% | 5.5%(-1.72)#1,225 | 4.9%(-1.09)#15,596 |
| 20. | 92129 | 3.7% | 5.5%(-1.79)#1,237 | 4.9%(-1.16)#15,857 |
| 21. | 92111 | 3.7% | 5.5%(-1.82)#1,242 | 4.9%(-1.19)#15,976 |
| 22. | 92131 | 3.7% | 5.5%(-1.83)#1,246 | 4.9%(-1.21)#16,021 |
| 23. | 92128 | 3.6% | 5.5%(-1.86)#1,252 | 4.9%(-1.23)#16,096 |
| 24. | 92101 | 3.4% | 5.5%(-2.09)#1,293 | 4.9%(-1.47)#16,955 |
| 25. | 92127 | 3.4% | 5.5%(-2.12)#1,296 | 4.9%(-1.49)#17,042 |
| 26. | 92126 | 3.4% | 5.5%(-2.12)#1,297 | 4.9%(-1.50)#17,053 |
| 27. | 92121 | 3.1% | 5.5%(-2.40)#1,341 | 4.9%(-1.77)#18,006 |
| 28. | 92109 | 3.1% | 5.5%(-2.44)#1,345 | 4.9%(-1.82)#18,142 |
| 29. | 92122 | 3.0% | 5.5%(-2.51)#1,352 | 4.9%(-1.88)#18,396 |
| 30. | 92130 | 2.9% | 5.5%(-2.59)#1,360 | 4.9%(-1.96)#18,669 |
| 31. | 92139 | 2.9% | 5.5%(-2.61)#1,363 | 4.9%(-1.99)#18,733 |
| 32. | 92117 | 2.9% | 5.5%(-2.63)#1,364 | 4.9%(-2.01)#18,795 |
| 33. | 92108 | 2.1% | 5.5%(-3.38)#1,428 | 4.9%(-2.75)#21,041 |
1
Common Questions
What are the Top 10 Zip Codes with the Highest Percentage of Population with a Degree in Liberal Arts and History in San Diego, CA?
Top 10 Zip Codes with the Highest Percentage of Population with a Degree in Liberal Arts and History in San Diego, CA are:
What zip code has the Highest Percentage of Population with a Degree in Liberal Arts and History in San Diego, CA?
92179 has the Highest Percentage of Population with a Degree in Liberal Arts and History in San Diego, CA with 21.8%.
What is the Percentage of Population with a Degree in Liberal Arts and History in San Diego, CA?
Percentage of Population with a Degree in Liberal Arts and History in San Diego is 4.1%.
What is the Percentage of Population with a Degree in Liberal Arts and History in California?
Percentage of Population with a Degree in Liberal Arts and History in California is 5.5%.
What is the Percentage of Population with a Degree in Liberal Arts and History in the United States?
Percentage of Population with a Degree in Liberal Arts and History in the United States is 4.9%.